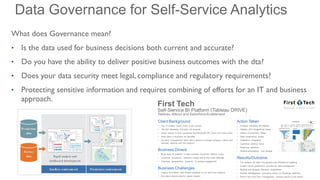
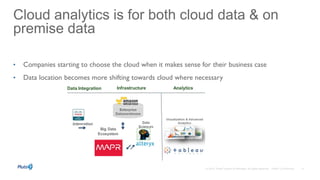
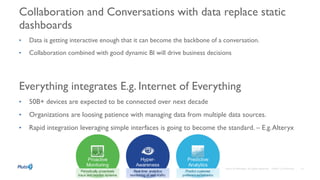
What does Governance mean?
• Is the data used for business decisions both current and accurate?
• Do you have the ability to deliver positive business outcomes with the dta?
• Does your data security meet legal, compliance and regulatory requirements?
• Protecting sensitive information and requires combining of efforts for an IT and business
approach.
• A competitive advantage
• Responsive product optimization
• Find out when a topic is starting to trend and what their customers are talking about.
• Brings into focus their influence on purchasing by others in their social networks.
• Business functions need customer insights not just for marketing campaigns, but also
for informing the organization’s sales, service, support, product development, and
other key functions about customer feedback and trends.
• Companies starting to choose the cloud when it makes sense for their business case
• Data location becomes more shifting towards cloud where necessary
Collaboration and Conversations with data replace static
dashboards
• Data is getting interactive enough that it can become the backbone of a conversation.
• Collaboration combined with good dynamic BI will drive business decisions
Everything integrates E.g. Internet of Everything
• 50B+ devices are expected to be connected over next decade
• Organizations are loosing patience with managing data from multiple data sources.
• Rapid integration leveraging simple interfaces is going to become the standard. – E.g.Alteryx
Mobile Solutions are maturing
Mobile solutions emerged many years back but are finally reaching a level of maturity that means that
mobile workers really can do light analysis from the road.
1. Address the elephants in the room – E.g. disagreement could be a DW platform selection
2. Divide work into bite-sized chunks that can be executed and funded within your company culture
3. Leverage what you have – Unless there is a significant gap
4. Articulate a clear business value – Must be viewed by the business as creating value
5. Avoid the miracle first year – There will be many “immediate needs”; don’t overpromise
• Who is my audience ?
• What decisions do they make?
• What questions do they need answered?
• Do they enjoy digging into the numbers?
• The dashboard’s level of detail and analytical capabilities should match
the audience comfort zone.
• Help management define what is important
• Set goals and expectations for specific individuals or groups
• Help executives sleep at night because they know what’s going on
• Encourage specific actions in a timely manner
• Highlight exceptions and provide alerts when problems occur
• Communicate progress and success
• Provide a common interface for interacting with and analyzing important
business data
Type of dashboard
• Scope : Broad or Specific function/Process/Product
• Business role
• Strategic : High Level, Broad and long term view
• Operational : focused, near-term and tactical view
• Time horizon : Historical, Snapshot, Real-time, Predictive
• Level of Detail : High level, Detailed – Drill-able
• Choosing the perfect metric – Actionable, Common Interpretation,
Transparent, Credible data
Dashboard Structure
• It requires a deep understanding of how the system you are
measuring works.
• Flow-based structure emphasizes a sequence of events or actions
across time.
• Relationships – could be mathematical, organizational, functional, or
geographical
• Grouping – group related information into categories or a hierarchy.
The Design
• Organize the dashboard page
• Appropriate use of color to enhance
• Fonts
• Chart type that best fits your data
• Style charts to be attractive and
effective
• Maximize contrast between your data
and the background.
• AvoidVisual noise
Design Principles
• Compactness
• Gradual reveal – Don’t bombard
the user with all the information
at once.
• Guide attention – positioning on
the page, use of color and fonts..
• Customizable – Build flexibility
to allow the dashboard to
become relevant for different
users.
Summarizing
• Don’t box yourself into “requirements”. Think Outside the Box Surprise the stakeholders
• Remember 80/20. Low hanging fruit first.
• Be Agile…..Reiterate.
• Executive sponsorship isn’t enough. Convert the laggards.
• Aim for novel insights, that challenge the business….not just labor productivity
• Facilitate “action”
• Measure success……Prove value….
Welcome
025© 2013 Pluto7 and/or its affiliates. All rights reserved. Pluto7 Confidential
contact@pluto7.com
Web
www.pluto7.com
Email
contact@pluto7.com
Phone
1- (408)-824-9213
• Decisions
• Insights( past trends, emerging trends, and predictions of future state )
• Actions
Actionable Insights
Predictive Analytics + Visualization + Big Data

Pluto7 meetup -sacramanto - 2015 version3

  • 7.
    What does Governancemean? • Is the data used for business decisions both current and accurate? • Do you have the ability to deliver positive business outcomes with the dta? • Does your data security meet legal, compliance and regulatory requirements? • Protecting sensitive information and requires combining of efforts for an IT and business approach.
  • 8.
    • A competitiveadvantage • Responsive product optimization • Find out when a topic is starting to trend and what their customers are talking about. • Brings into focus their influence on purchasing by others in their social networks. • Business functions need customer insights not just for marketing campaigns, but also for informing the organization’s sales, service, support, product development, and other key functions about customer feedback and trends.
  • 9.
    • Companies startingto choose the cloud when it makes sense for their business case • Data location becomes more shifting towards cloud where necessary
  • 10.
    Collaboration and Conversationswith data replace static dashboards • Data is getting interactive enough that it can become the backbone of a conversation. • Collaboration combined with good dynamic BI will drive business decisions Everything integrates E.g. Internet of Everything • 50B+ devices are expected to be connected over next decade • Organizations are loosing patience with managing data from multiple data sources. • Rapid integration leveraging simple interfaces is going to become the standard. – E.g.Alteryx
  • 11.
    Mobile Solutions arematuring Mobile solutions emerged many years back but are finally reaching a level of maturity that means that mobile workers really can do light analysis from the road.
  • 13.
    1. Address theelephants in the room – E.g. disagreement could be a DW platform selection 2. Divide work into bite-sized chunks that can be executed and funded within your company culture 3. Leverage what you have – Unless there is a significant gap 4. Articulate a clear business value – Must be viewed by the business as creating value 5. Avoid the miracle first year – There will be many “immediate needs”; don’t overpromise
  • 14.
    • Who ismy audience ? • What decisions do they make? • What questions do they need answered? • Do they enjoy digging into the numbers? • The dashboard’s level of detail and analytical capabilities should match the audience comfort zone.
  • 16.
    • Help managementdefine what is important • Set goals and expectations for specific individuals or groups • Help executives sleep at night because they know what’s going on • Encourage specific actions in a timely manner • Highlight exceptions and provide alerts when problems occur • Communicate progress and success • Provide a common interface for interacting with and analyzing important business data
  • 18.
    Type of dashboard •Scope : Broad or Specific function/Process/Product • Business role • Strategic : High Level, Broad and long term view • Operational : focused, near-term and tactical view • Time horizon : Historical, Snapshot, Real-time, Predictive • Level of Detail : High level, Detailed – Drill-able • Choosing the perfect metric – Actionable, Common Interpretation, Transparent, Credible data
  • 19.
    Dashboard Structure • Itrequires a deep understanding of how the system you are measuring works. • Flow-based structure emphasizes a sequence of events or actions across time. • Relationships – could be mathematical, organizational, functional, or geographical • Grouping – group related information into categories or a hierarchy.
  • 21.
    The Design • Organizethe dashboard page • Appropriate use of color to enhance • Fonts • Chart type that best fits your data • Style charts to be attractive and effective • Maximize contrast between your data and the background. • AvoidVisual noise Design Principles • Compactness • Gradual reveal – Don’t bombard the user with all the information at once. • Guide attention – positioning on the page, use of color and fonts.. • Customizable – Build flexibility to allow the dashboard to become relevant for different users.
  • 25.
    Summarizing • Don’t boxyourself into “requirements”. Think Outside the Box Surprise the stakeholders • Remember 80/20. Low hanging fruit first. • Be Agile…..Reiterate. • Executive sponsorship isn’t enough. Convert the laggards. • Aim for novel insights, that challenge the business….not just labor productivity • Facilitate “action” • Measure success……Prove value…. Welcome 025© 2013 Pluto7 and/or its affiliates. All rights reserved. Pluto7 Confidential
  • 26.
  • 27.
  • 28.
    • Decisions • Insights(past trends, emerging trends, and predictions of future state ) • Actions Actionable Insights Predictive Analytics + Visualization + Big Data