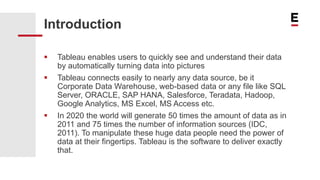
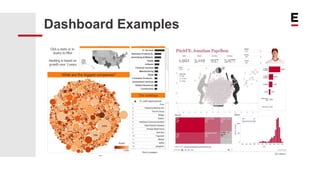
www.extentia.com | Confidential
Tableau
A Business Intelligence and Analytics Tool
Introduction
 Tableau enables users to quickly see and understand their data
by automatically turning data into pictures
 Tableau connects easily to nearly any data source, be it
Corporate Data Warehouse, web-based data or any file like SQL
Server, ORACLE, SAP HANA, Salesforce, Teradata, Hadoop,
Google Analytics, MS Excel, MS Access etc.
 In 2020 the world will generate 50 times the amount of data as in
2011 and 75 times the number of information sources (IDC,
2011). To manipulate these huge data people need the power of
data at their fingertips. Tableau is the software to deliver exactly
that.
Dashboard Examples
Dashboard Examples
Dashboard Examples
Company Background
 Tableau Software - American software company headquartered
in Seattle, WA, USA
 Founded at Stanford University’s Department of Computer
Science between 1997 and 2002. Professor Pat Hanrahan and
Ph.D. student Chris Stolte
 Combined Structured Query Language (SQL) for databases with
a descriptive language for rendering graphics and invented a
database visualization language called VizQL (Visual Query
Language).
Company Background
 VizQL formed the core of the Polaris system, an interface for
exploring large multi-dimensional databases – foundation for
Tableau
 Net Profit in Last 5 Years
Clientele
Features
Products
Pricing
Business Integration
JavaScript API Example
Competitors
 Microsoft Excel
 Microsoft BI Tools (SSIS,SSRS,SSAS)
 Google Charts
 Spotfire
 Qlik Sense
 IBM Cognos Business Intelligence
 GoodData
 iDashboards
 Salesforce Analytics Cloud (Wave)
2015 | CONFIDENTIAL
www.extentia.com

Tableau: A Business Intelligence and Analytics Software

  • 1.
    www.extentia.com | Confidential Tableau ABusiness Intelligence and Analytics Tool
  • 2.
    Introduction  Tableau enablesusers to quickly see and understand their data by automatically turning data into pictures  Tableau connects easily to nearly any data source, be it Corporate Data Warehouse, web-based data or any file like SQL Server, ORACLE, SAP HANA, Salesforce, Teradata, Hadoop, Google Analytics, MS Excel, MS Access etc.  In 2020 the world will generate 50 times the amount of data as in 2011 and 75 times the number of information sources (IDC, 2011). To manipulate these huge data people need the power of data at their fingertips. Tableau is the software to deliver exactly that.
  • 3.
  • 4.
  • 5.
  • 6.
    Company Background  TableauSoftware - American software company headquartered in Seattle, WA, USA  Founded at Stanford University’s Department of Computer Science between 1997 and 2002. Professor Pat Hanrahan and Ph.D. student Chris Stolte  Combined Structured Query Language (SQL) for databases with a descriptive language for rendering graphics and invented a database visualization language called VizQL (Visual Query Language).
  • 7.
    Company Background  VizQLformed the core of the Polaris system, an interface for exploring large multi-dimensional databases – foundation for Tableau  Net Profit in Last 5 Years
  • 8.
  • 9.
  • 10.
  • 11.
  • 12.
  • 13.
  • 14.
    Competitors  Microsoft Excel Microsoft BI Tools (SSIS,SSRS,SSAS)  Google Charts  Spotfire  Qlik Sense  IBM Cognos Business Intelligence  GoodData  iDashboards  Salesforce Analytics Cloud (Wave)
  • 15.