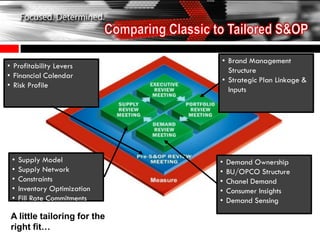
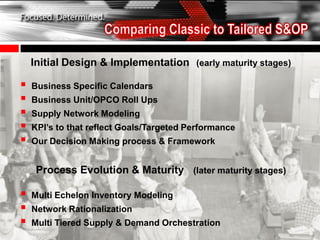
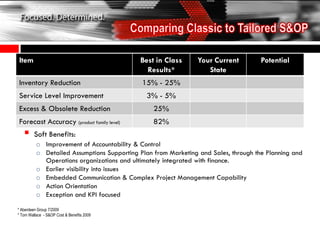
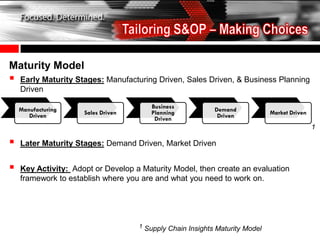
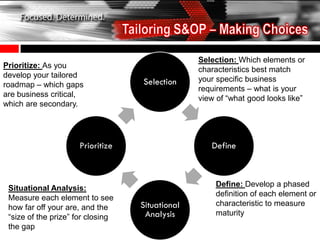
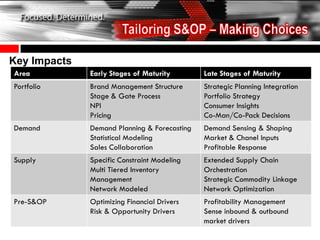
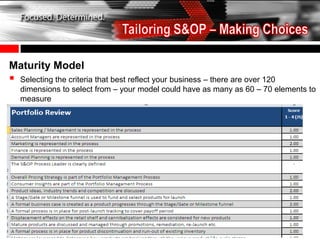
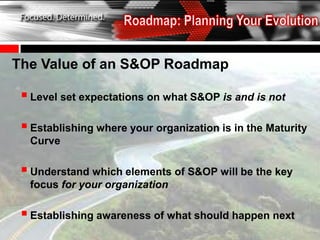
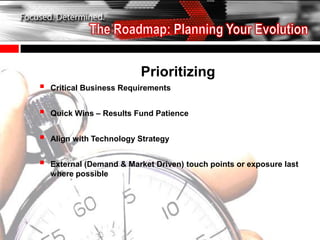
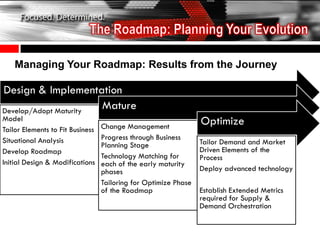
S&OP Leadership Exchange:
Tailoring S&OP to Fit Your Business


       With Andrew McCall
   Quick Introduction


   Key differences between Classic S&OP & a “Tailored” S&OP Process


   What choices do we face in Tailoring our process?


   How do we begin planning the evolution


   The Bottom Line


   Discussion & Closing
   Develop and Understanding of why tailoring S&OP can not only help
    create business benefit, but also create a process that fits better with
    your specific needs so that the change management hurdles are
    reduced


   Outline some of the key customizations or “tailoring” points that most
    business’s face – and how to navigate them


   Explain the road-mapping process so you can begin this journey in
    your organization
• Brand Management
• Profitability Levers
                                Structure
• Financial Calendar
                              • Strategic Plan Linkage &
• Risk Profile
                                Inputs


 •   Supply Model             •   Demand Ownership
 •   Supply Network           •   BU/OPCO Structure
 •   Constraints              •   Chanel Demand
 •   Inventory Optimization   •   Consumer Insights
 •   Fill Rate Commitments    •   Demand Sensing

 A little tailoring for the
 right fit…
At its most basic level
   S&OP in your organization is geared towards
             answering 3 questions:

 What are our Goals/Targeted Performance Levels?
 What do we need to measure to monitor performance?
 How do we make decisions?

                       - Lora Cecere, Supply Chain Insights
Initial Design & Implementation (early maturity stages)

   Business Specific Calendars
   Business Unit/OPCO Roll Ups
   Supply Network Modeling
   KPI’s to that reflect Goals/Targeted Performance
   Our Decision Making process & Framework


     Process Evolution & Maturity (later maturity stages)

   Multi Echelon Inventory Modeling
   Network Rationalization
   Multi Tiered Supply & Demand Orchestration
Item                                        Best in Class      Your Current          Potential
                                              Results*            State
Inventory Reduction                          15% - 25%
Service Level Improvement                     3% - 5%
Excess & Obsolete Reduction                      25%
Forecast Accuracy (product family level)         82%
        Soft Benefits:
          o Improvement of Accountability & Control
          o Detailed Assumptions Supporting Plan from Marketing and Sales, through the Planning and
            Operations organizations and ultimately integrated with finance.
          o Earlier visibility into issues
          o Embedded Communication & Complex Project Management Capability
          o Action Orientation
          o Exception and KPI focused

* Aberdeen Group 7/2009
* Tom Wallace - S&OP Cost & Benefits 2009
Maturity Model
   Early Maturity Stages: Manufacturing Driven, Sales Driven, & Business Planning
    Driven

    Manufacturing                       Business           Demand
       Driven        Sales Driven       Planning            Driven           Market Driven
                                         Driven
                                                                                             1

   Later Maturity Stages: Demand Driven, Market Driven


   Key Activity: Adopt or Develop a Maturity Model, then create an evaluation
    framework to establish where you are and what you need to work on.


                                    1 Supply Chain Insights Maturity Model
Selection: Which elements or
Prioritize: As you
                                                 characteristics best match
develop your tailored
                                   Selection     your specific business
roadmap – which gaps
                                                 requirements – what is your
are business critical,
                                                 view of “what good looks like”
which are secondary.


                      Prioritize                    Define


                                                     Define: Develop a phased
 Situational Analysis:
                                                     definition of each element or
 Measure each element to see
 how far off your are, and the     Situational       characteristic to measure
 “size of the prize” for closing    Analysis         maturity
 the gap
Key Impacts
Area          Early Stages of Maturity        Late Stages of Maturity
Portfolio     Brand Management Structure      Strategic Planning Integration
              Stage & Gate Process            Portfolio Strategy
              NPI                             Consumer Insights
              Pricing                         Co-Man/Co-Pack Decisions
Demand        Demand Planning & Forecasting   Demand Sensing & Shaping
              Statistical Modeling            Market & Chanel Inputs
              Sales Collaboration             Profitable Response
Supply        Specific Constraint Modeling    Extended Supply Chain
              Multi Tiered Inventory          Orchestration
              Management                      Strategic Commodity Linkage
              Network Modeled                 Network Optimization
Pre-S&OP      Optimizing Financial Drivers    Profitability Management
              Risk & Opportunity Drivers      Sense inbound & outbound
                                              market drivers
Maturity Model
   Selecting the criteria that best reflect your business – there are over 120
    dimensions to select from – your model could have as many as 60 – 70 elements to
    measure
The Value of an S&OP Roadmap

  Level set expectations on what S&OP is and is not
  Establishing where your organization is in the Maturity
  Curve

  Understand which elements of S&OP will be the key
  focus for your organization

  Establishing awareness of what should happen next
Gap Analysis
                                                                                                       Key Strengths

                                                                                    • Most Process Elements exist
                                                                                    • Technical Infrastructure is implemented, Data
                                                                                      access remains a struggle
                                                                                    • Several Key Integration Points are in place and
                                                                                      only required some structure/Maturity
                                                                                    • Executive & Financial processes exist and need to
                                                                                      be leveraged and re-sequenced


                                                                                                          Key Gaps


                                                                                      • Communication surrounding Forecast changes
                                                                                      • Understanding of the different elements across
                                    Bottom Line                                         the organization (UOM )
                                                                                      • Post Analysis Processes
 • Many Process Elements currently in place provide a foundation for future state     • Cross Functional understanding or process
   design                                                                               steps
 • Key Elements of the Org structure exist to support the process, change             • Accountability & Ownership of the forecast
   management will be largest challenge                                               • Depth of Horizon
 • Comprehensive Design Required to Orchestrate all Pieces
Prioritizing
   Critical Business Requirements


   Quick Wins – Results Fund Patience


   Align with Technology Strategy


   External (Demand & Market Driven) touch points or exposure last
    where possible
Managing Your Roadmap: Results from the Journey

Design & Implementation
Develop/Adopt Maturity
                       Mature
Model
                                  Change Management
                                                                 Optimize
Tailor Elements to Fit Business
Situational Analysis              Progress through Business
                                  Planning Stage                 Tailor Demand and Market
Develop Roadmap                                                  Driven Elements of the
                                  Technology Matching for        Process
Initial Design & Modifications    each of the early maturity
                                  phases                         Deploy advanced technology
                                  Tailoring for Optimize Phase
                                  of the Roadmap                 Establish Extended Metrics
                                                                 required for Supply &
                                                                 Demand Orchestration
    Tailoring S&OP requires work at both the design/implement
        phase, as well as while you measure your progress against a
                               maturity model.


   The Maturity Model you develop should be your ultimate vision
        of where you are going, and reflect both your business
      requirements, and your specific definitions of Goals, Key
     Performance Indicators, and the decision making framework
     and process that your organization requires to drive results.


     Your roadmap should outline which “customizations” you
    need early, and your planned evolution – regardless of how far
     off in the future you expect to reach your end state maturity.

S&OP Leadership Exchange: Tailoring S&OP to Fit your Business

  • 1.
    S&OP Leadership Exchange: TailoringS&OP to Fit Your Business With Andrew McCall
  • 2.
    Quick Introduction  Key differences between Classic S&OP & a “Tailored” S&OP Process  What choices do we face in Tailoring our process?  How do we begin planning the evolution  The Bottom Line  Discussion & Closing
  • 3.
    Develop and Understanding of why tailoring S&OP can not only help create business benefit, but also create a process that fits better with your specific needs so that the change management hurdles are reduced  Outline some of the key customizations or “tailoring” points that most business’s face – and how to navigate them  Explain the road-mapping process so you can begin this journey in your organization
  • 4.
    • Brand Management •Profitability Levers Structure • Financial Calendar • Strategic Plan Linkage & • Risk Profile Inputs • Supply Model • Demand Ownership • Supply Network • BU/OPCO Structure • Constraints • Chanel Demand • Inventory Optimization • Consumer Insights • Fill Rate Commitments • Demand Sensing A little tailoring for the right fit…
  • 5.
    At its mostbasic level S&OP in your organization is geared towards answering 3 questions:  What are our Goals/Targeted Performance Levels?  What do we need to measure to monitor performance?  How do we make decisions? - Lora Cecere, Supply Chain Insights
  • 6.
    Initial Design &Implementation (early maturity stages)  Business Specific Calendars  Business Unit/OPCO Roll Ups  Supply Network Modeling  KPI’s to that reflect Goals/Targeted Performance  Our Decision Making process & Framework Process Evolution & Maturity (later maturity stages)  Multi Echelon Inventory Modeling  Network Rationalization  Multi Tiered Supply & Demand Orchestration
  • 7.
    Item Best in Class Your Current Potential Results* State Inventory Reduction 15% - 25% Service Level Improvement 3% - 5% Excess & Obsolete Reduction 25% Forecast Accuracy (product family level) 82%  Soft Benefits: o Improvement of Accountability & Control o Detailed Assumptions Supporting Plan from Marketing and Sales, through the Planning and Operations organizations and ultimately integrated with finance. o Earlier visibility into issues o Embedded Communication & Complex Project Management Capability o Action Orientation o Exception and KPI focused * Aberdeen Group 7/2009 * Tom Wallace - S&OP Cost & Benefits 2009
  • 8.
    Maturity Model  Early Maturity Stages: Manufacturing Driven, Sales Driven, & Business Planning Driven Manufacturing Business Demand Driven Sales Driven Planning Driven Market Driven Driven 1  Later Maturity Stages: Demand Driven, Market Driven  Key Activity: Adopt or Develop a Maturity Model, then create an evaluation framework to establish where you are and what you need to work on. 1 Supply Chain Insights Maturity Model
  • 9.
    Selection: Which elementsor Prioritize: As you characteristics best match develop your tailored Selection your specific business roadmap – which gaps requirements – what is your are business critical, view of “what good looks like” which are secondary. Prioritize Define Define: Develop a phased Situational Analysis: definition of each element or Measure each element to see how far off your are, and the Situational characteristic to measure “size of the prize” for closing Analysis maturity the gap
  • 10.
    Key Impacts Area Early Stages of Maturity Late Stages of Maturity Portfolio Brand Management Structure Strategic Planning Integration Stage & Gate Process Portfolio Strategy NPI Consumer Insights Pricing Co-Man/Co-Pack Decisions Demand Demand Planning & Forecasting Demand Sensing & Shaping Statistical Modeling Market & Chanel Inputs Sales Collaboration Profitable Response Supply Specific Constraint Modeling Extended Supply Chain Multi Tiered Inventory Orchestration Management Strategic Commodity Linkage Network Modeled Network Optimization Pre-S&OP Optimizing Financial Drivers Profitability Management Risk & Opportunity Drivers Sense inbound & outbound market drivers
  • 11.
    Maturity Model  Selecting the criteria that best reflect your business – there are over 120 dimensions to select from – your model could have as many as 60 – 70 elements to measure
  • 12.
    The Value ofan S&OP Roadmap  Level set expectations on what S&OP is and is not  Establishing where your organization is in the Maturity Curve  Understand which elements of S&OP will be the key focus for your organization  Establishing awareness of what should happen next
  • 13.
    Gap Analysis Key Strengths • Most Process Elements exist • Technical Infrastructure is implemented, Data access remains a struggle • Several Key Integration Points are in place and only required some structure/Maturity • Executive & Financial processes exist and need to be leveraged and re-sequenced Key Gaps • Communication surrounding Forecast changes • Understanding of the different elements across Bottom Line the organization (UOM ) • Post Analysis Processes • Many Process Elements currently in place provide a foundation for future state • Cross Functional understanding or process design steps • Key Elements of the Org structure exist to support the process, change • Accountability & Ownership of the forecast management will be largest challenge • Depth of Horizon • Comprehensive Design Required to Orchestrate all Pieces
  • 14.
    Prioritizing  Critical Business Requirements  Quick Wins – Results Fund Patience  Align with Technology Strategy  External (Demand & Market Driven) touch points or exposure last where possible
  • 15.
    Managing Your Roadmap:Results from the Journey Design & Implementation Develop/Adopt Maturity Mature Model Change Management Optimize Tailor Elements to Fit Business Situational Analysis Progress through Business Planning Stage Tailor Demand and Market Develop Roadmap Driven Elements of the Technology Matching for Process Initial Design & Modifications each of the early maturity phases Deploy advanced technology Tailoring for Optimize Phase of the Roadmap Establish Extended Metrics required for Supply & Demand Orchestration
  • 16.
    Tailoring S&OP requires work at both the design/implement phase, as well as while you measure your progress against a maturity model.  The Maturity Model you develop should be your ultimate vision of where you are going, and reflect both your business requirements, and your specific definitions of Goals, Key Performance Indicators, and the decision making framework and process that your organization requires to drive results.  Your roadmap should outline which “customizations” you need early, and your planned evolution – regardless of how far off in the future you expect to reach your end state maturity.