Downloaded 665 times
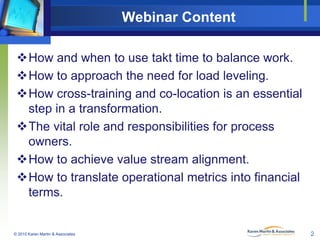
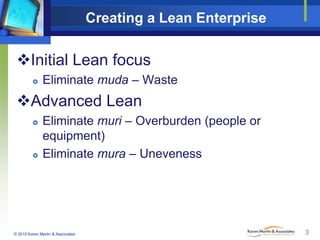
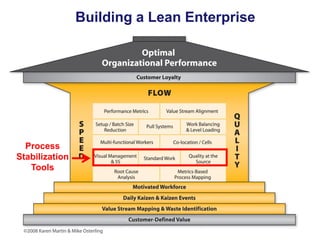
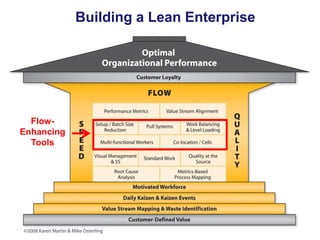
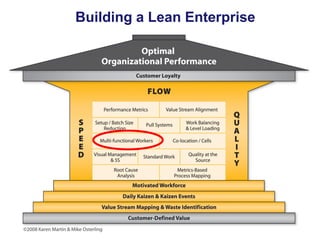
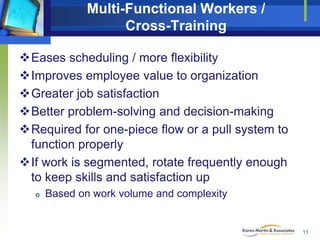
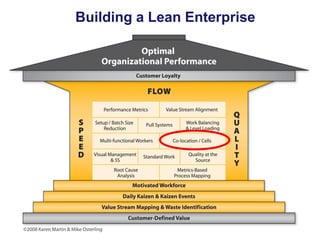
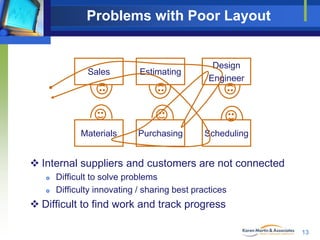
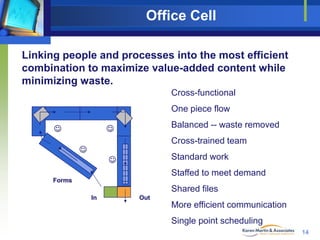
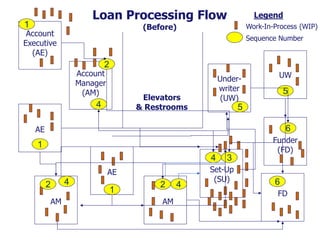
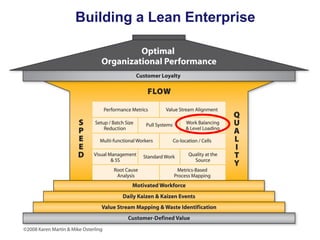
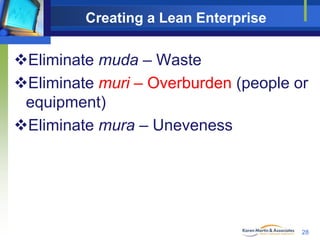
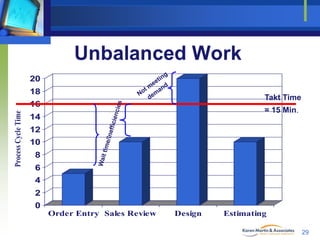
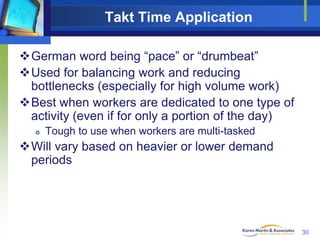
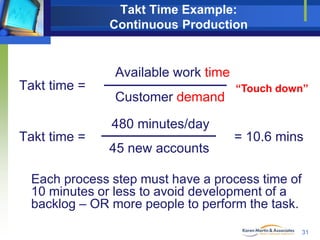

The document outlines a webinar on advanced lean principles for office and service environments, emphasizing strategies such as takt time, load leveling, cross-training, and value stream alignment. It discusses the importance of process ownership and financial translation of operational metrics while presenting various tools and techniques aimed at enhancing efficiency within organizations. Key insights include addressing waste, overburden, and unevenness, ultimately aiming to create a lean enterprise.