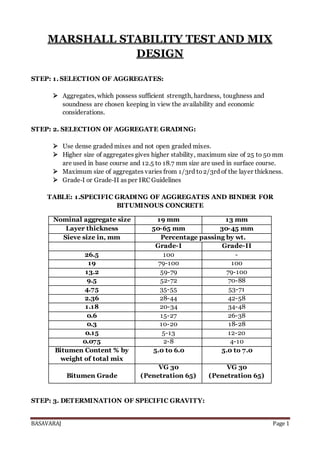
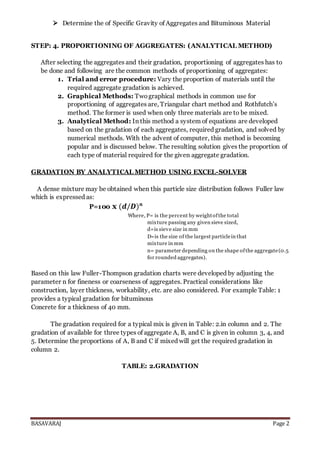
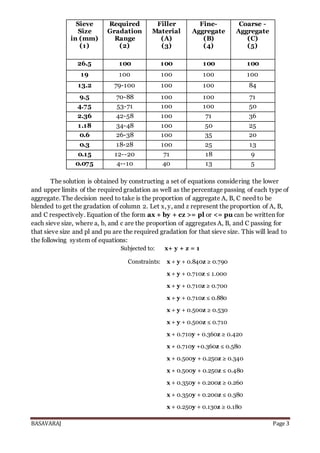
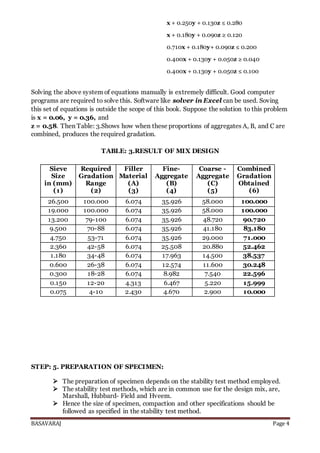
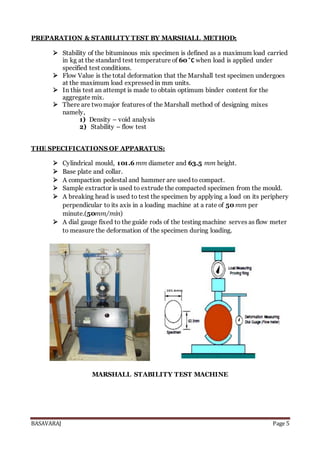
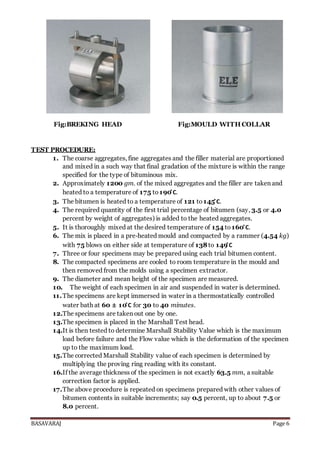
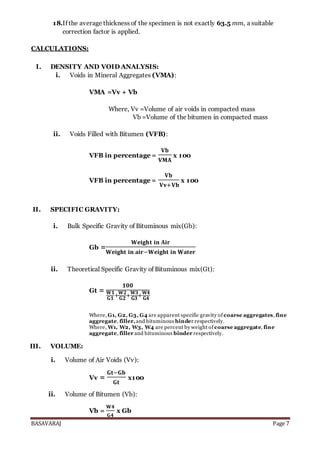
1) The document describes the process for Marshall stability test and mix design for bituminous concrete. Key steps include selecting aggregates based on strength and gradation, determining aggregate proportions, preparing specimens, and testing stability and flow.
2) Aggregate proportions are determined using an analytical method solving equations for the required gradation. Specimens are compacted and tested for stability (maximum load) and flow (deformation) at varying bitumen contents to determine the optimum mix.
3) Stability and flow values are measured using a Marshall test machine and calculations are done to determine density, voids, and other properties of the mix. The process is repeated to get the optimum bitumen content for the mix design.
A critical review of commonly used bituminous paving mixes has attempted based on
Mix selection based on function and location within flexible pavement.
Capabilities of present day hot mix asphalt plants
The Marshall stability and flow test provides the performance prediction measure for the Marshall mix design method. The stability portion of the test measures the maximum load supported by the test specimen at a loading rate of 50.8 mm/minute. Load is applied to the specimen till failure, and the maximum load is designated as stability. During the loading, an attached dial gauge measures the specimen's plastic flow (deformation) due to the loading. The flow value is recorded in 0.25 mm (0.01 inch) increments at the same time when the maximum load is recorded.
ppt on construction and design of flexible pavementSUSMITAMAITY4
types of pavement.\,failure of flexible pavement,cross section of flexible pavement,advantages and disadvantages of flexible pavement,load distribution etc
Aggregates blending, blending aggregates by graphical method, concrete mix design, concrete technology, what is aggregates blending, what is blending, methods of blending, how to blend aggregates, civil engineering
A sample lab report on Marshall method of mix design for bituminous mixtures with all calculations.
Please request with your mail ID if you want to download this document.
THE INFLUENCE OF MICROSTRUCTURE IN THE HOMOGENEITY OF HARDNESS STANDARD BLOCKSTito Livio M. Cardoso
The paper presents results of studies microhardness standard commercial blocks, indicating that a strict control of grain size is required in its manufacture punctual to avoid uncertainties in the measurements for calibration of durometers
descrição da publicação: Simposio Brasileiro de Estruturologia
data da publicação: 1998
PARAMETRIC DESIGN ANALYSIS AND FEA SIMULATION OF A CHISEL PLOW FOR AN AGRICUL...ijmech
CAD Software for the structural analysis is basically used for the application of CAD/CAM in design optimization of tillage tools, which is based on the simulation method and Finite Element Method. The various components of the tillage tools are simulated with help of actual field performance rating parameters which are prepared by solid models along with actual boundary conditions. The planned work outcomes of sufficient tolerance in varying the working parameters of Chisel Plow sections for ejecting the extra weight in a solid section and also to increase the weight of plow for a consistent potency. In this paper parametric study of two different kinds of Chisel Plow for an agriculture use in designing from stress, strain, deformation and fatigue analysis has done. One is Old Chisel Plow & another is New Generation Chisel Plow. The old working model of Chisel Plow is compared with new design parameters with change of its geometry for the maximum weed exclusion efficiency by showing its realistic results from the actual field performance.
PARAMETRIC DESIGN ANALYSIS AND FEA SIMULATION OF A CHISEL PLOW FOR AN AGRICUL...ijmech
CAD Software for the structural analysis is basically used for the application of CAD/CAM in design
optimization of tillage tools, which is based on the simulation method and Finite Element Method. The
various components of the tillage tools are simulated with help of actual field performance rating
parameters which are prepared by solid models along with actual boundary conditions. The planned work
outcomes of sufficient tolerance in varying the working parameters of Chisel Plow sections for ejecting the
extra weight in a solid section and also to increase the weight of plow for a consistent potency.
In this paper parametric study of two different kinds of Chisel Plow for an agriculture use in designing
from stress, strain, deformation and fatigue analysis has done. One is Old Chisel Plow & another is New
Generation Chisel Plow. The old working model of Chisel Plow is compared with new design parameters
with change of its geometry for the maximum weed exclusion efficiency by showing its realistic results from
the actual field performance.
COLLEGE BUS MANAGEMENT SYSTEM PROJECT REPORT.pdfKamal Acharya
The College Bus Management system is completely developed by Visual Basic .NET Version. The application is connect with most secured database language MS SQL Server. The application is develop by using best combination of front-end and back-end languages. The application is totally design like flat user interface. This flat user interface is more attractive user interface in 2017. The application is gives more important to the system functionality. The application is to manage the student’s details, driver’s details, bus details, bus route details, bus fees details and more. The application has only one unit for admin. The admin can manage the entire application. The admin can login into the application by using username and password of the admin. The application is develop for big and small colleges. It is more user friendly for non-computer person. Even they can easily learn how to manage the application within hours. The application is more secure by the admin. The system will give an effective output for the VB.Net and SQL Server given as input to the system. The compiled java program given as input to the system, after scanning the program will generate different reports. The application generates the report for users. The admin can view and download the report of the data. The application deliver the excel format reports. Because, excel formatted reports is very easy to understand the income and expense of the college bus. This application is mainly develop for windows operating system users. In 2017, 73% of people enterprises are using windows operating system. So the application will easily install for all the windows operating system users. The application-developed size is very low. The application consumes very low space in disk. Therefore, the user can allocate very minimum local disk space for this application.
Cosmetic shop management system project report.pdfKamal Acharya
Buying new cosmetic products is difficult. It can even be scary for those who have sensitive skin and are prone to skin trouble. The information needed to alleviate this problem is on the back of each product, but it's thought to interpret those ingredient lists unless you have a background in chemistry.
Instead of buying and hoping for the best, we can use data science to help us predict which products may be good fits for us. It includes various function programs to do the above mentioned tasks.
Data file handling has been effectively used in the program.
The automated cosmetic shop management system should deal with the automation of general workflow and administration process of the shop. The main processes of the system focus on customer's request where the system is able to search the most appropriate products and deliver it to the customers. It should help the employees to quickly identify the list of cosmetic product that have reached the minimum quantity and also keep a track of expired date for each cosmetic product. It should help the employees to find the rack number in which the product is placed.It is also Faster and more efficient way.
Courier management system project report.pdfKamal Acharya
It is now-a-days very important for the people to send or receive articles like imported furniture, electronic items, gifts, business goods and the like. People depend vastly on different transport systems which mostly use the manual way of receiving and delivering the articles. There is no way to track the articles till they are received and there is no way to let the customer know what happened in transit, once he booked some articles. In such a situation, we need a system which completely computerizes the cargo activities including time to time tracking of the articles sent. This need is fulfilled by Courier Management System software which is online software for the cargo management people that enables them to receive the goods from a source and send them to a required destination and track their status from time to time.
Event Management System Vb Net Project Report.pdfKamal Acharya
In present era, the scopes of information technology growing with a very fast .We do not see any are untouched from this industry. The scope of information technology has become wider includes: Business and industry. Household Business, Communication, Education, Entertainment, Science, Medicine, Engineering, Distance Learning, Weather Forecasting. Carrier Searching and so on.
My project named “Event Management System” is software that store and maintained all events coordinated in college. It also helpful to print related reports. My project will help to record the events coordinated by faculties with their Name, Event subject, date & details in an efficient & effective ways.
In my system we have to make a system by which a user can record all events coordinated by a particular faculty. In our proposed system some more featured are added which differs it from the existing system such as security.
TECHNICAL TRAINING MANUAL GENERAL FAMILIARIZATION COURSEDuvanRamosGarzon1
AIRCRAFT GENERAL
The Single Aisle is the most advanced family aircraft in service today, with fly-by-wire flight controls.
The A318, A319, A320 and A321 are twin-engine subsonic medium range aircraft.
The family offers a choice of engines
About
Indigenized remote control interface card suitable for MAFI system CCR equipment. Compatible for IDM8000 CCR. Backplane mounted serial and TCP/Ethernet communication module for CCR remote access. IDM 8000 CCR remote control on serial and TCP protocol.
• Remote control: Parallel or serial interface.
• Compatible with MAFI CCR system.
• Compatible with IDM8000 CCR.
• Compatible with Backplane mount serial communication.
• Compatible with commercial and Defence aviation CCR system.
• Remote control system for accessing CCR and allied system over serial or TCP.
• Indigenized local Support/presence in India.
• Easy in configuration using DIP switches.
Technical Specifications
Indigenized remote control interface card suitable for MAFI system CCR equipment. Compatible for IDM8000 CCR. Backplane mounted serial and TCP/Ethernet communication module for CCR remote access. IDM 8000 CCR remote control on serial and TCP protocol.
Key Features
Indigenized remote control interface card suitable for MAFI system CCR equipment. Compatible for IDM8000 CCR. Backplane mounted serial and TCP/Ethernet communication module for CCR remote access. IDM 8000 CCR remote control on serial and TCP protocol.
• Remote control: Parallel or serial interface
• Compatible with MAFI CCR system
• Copatiable with IDM8000 CCR
• Compatible with Backplane mount serial communication.
• Compatible with commercial and Defence aviation CCR system.
• Remote control system for accessing CCR and allied system over serial or TCP.
• Indigenized local Support/presence in India.
Application
• Remote control: Parallel or serial interface.
• Compatible with MAFI CCR system.
• Compatible with IDM8000 CCR.
• Compatible with Backplane mount serial communication.
• Compatible with commercial and Defence aviation CCR system.
• Remote control system for accessing CCR and allied system over serial or TCP.
• Indigenized local Support/presence in India.
• Easy in configuration using DIP switches.
Explore the innovative world of trenchless pipe repair with our comprehensive guide, "The Benefits and Techniques of Trenchless Pipe Repair." This document delves into the modern methods of repairing underground pipes without the need for extensive excavation, highlighting the numerous advantages and the latest techniques used in the industry.
Learn about the cost savings, reduced environmental impact, and minimal disruption associated with trenchless technology. Discover detailed explanations of popular techniques such as pipe bursting, cured-in-place pipe (CIPP) lining, and directional drilling. Understand how these methods can be applied to various types of infrastructure, from residential plumbing to large-scale municipal systems.
Ideal for homeowners, contractors, engineers, and anyone interested in modern plumbing solutions, this guide provides valuable insights into why trenchless pipe repair is becoming the preferred choice for pipe rehabilitation. Stay informed about the latest advancements and best practices in the field.
Hybrid optimization of pumped hydro system and solar- Engr. Abdul-Azeez.pdffxintegritypublishin
Advancements in technology unveil a myriad of electrical and electronic breakthroughs geared towards efficiently harnessing limited resources to meet human energy demands. The optimization of hybrid solar PV panels and pumped hydro energy supply systems plays a pivotal role in utilizing natural resources effectively. This initiative not only benefits humanity but also fosters environmental sustainability. The study investigated the design optimization of these hybrid systems, focusing on understanding solar radiation patterns, identifying geographical influences on solar radiation, formulating a mathematical model for system optimization, and determining the optimal configuration of PV panels and pumped hydro storage. Through a comparative analysis approach and eight weeks of data collection, the study addressed key research questions related to solar radiation patterns and optimal system design. The findings highlighted regions with heightened solar radiation levels, showcasing substantial potential for power generation and emphasizing the system's efficiency. Optimizing system design significantly boosted power generation, promoted renewable energy utilization, and enhanced energy storage capacity. The study underscored the benefits of optimizing hybrid solar PV panels and pumped hydro energy supply systems for sustainable energy usage. Optimizing the design of solar PV panels and pumped hydro energy supply systems as examined across diverse climatic conditions in a developing country, not only enhances power generation but also improves the integration of renewable energy sources and boosts energy storage capacities, particularly beneficial for less economically prosperous regions. Additionally, the study provides valuable insights for advancing energy research in economically viable areas. Recommendations included conducting site-specific assessments, utilizing advanced modeling tools, implementing regular maintenance protocols, and enhancing communication among system components.
Industrial Training at Shahjalal Fertilizer Company Limited (SFCL)MdTanvirMahtab2
This presentation is about the working procedure of Shahjalal Fertilizer Company Limited (SFCL). A Govt. owned Company of Bangladesh Chemical Industries Corporation under Ministry of Industries.
Quality defects in TMT Bars, Possible causes and Potential Solutions.PrashantGoswami42
Maintaining high-quality standards in the production of TMT bars is crucial for ensuring structural integrity in construction. Addressing common defects through careful monitoring, standardized processes, and advanced technology can significantly improve the quality of TMT bars. Continuous training and adherence to quality control measures will also play a pivotal role in minimizing these defects.
Water scarcity is the lack of fresh water resources to meet the standard water demand. There are two type of water scarcity. One is physical. The other is economic water scarcity.
1. BASAVARAJ Page 1
MARSHALL STABILITY TEST AND MIX
DESIGN
STEP: 1. SELECTION OF AGGREGATES:
Aggregates, which possess sufficient strength, hardness, toughness and
soundness are chosen keeping in view the availability and economic
considerations.
STEP: 2. SELECTION OF AGGREGATE GRADING:
Use dense graded mixes and not open graded mixes.
Higher size of aggregates gives higher stability, maximum size of 25 to 50 mm
are used in base course and 12.5 to 18.7 mm size are used in surface course.
Maximum size of aggregates varies from 1/3rd to2/3rd of the layer thickness.
Grade‐I or Grade‐II as per IRC Guidelines
TABLE: 1.SPECIFIC GRADING OF AGGREGATES AND BINDER FOR
BITUMINOUS CONCRETE
STEP: 3. DETERMINATION OF SPECIFIC GRAVITY:
Nominal aggregate size 19 mm 13 mm
Layer thickness 50-65 mm 30-45 mm
Sieve size in, mm Percentage passing by wt.
Grade-I Grade-II
26.5 100 -
19 79-100 100
13.2 59-79 79-100
9.5 52-72 70-88
4.75 35-55 53-71
2.36 28-44 42-58
1.18 20-34 34-48
0.6 15-27 26-38
0.3 10-20 18-28
0.15 5-13 12-20
0.075 2-8 4-10
Bitumen Content % by
weight of total mix
5.0 to 6.0 5.0 to 7.0
Bitumen Grade
VG 30
(Penetration 65)
VG 30
(Penetration 65)
2. BASAVARAJ Page 2
Determine the of Specific Gravity of Aggregates and Bituminous Material
STEP: 4. PROPORTIONING OF AGGREGATES: (ANALYTICAL METHOD)
After selecting the aggregates and their gradation, proportioning of aggregates has to
be done and following are the common methods of proportioning of aggregates:
1. Trial and error procedure: Vary the proportion of materials until the
required aggregate gradation is achieved.
2. Graphical Methods: Twographical methods in common use for
proportioning of aggregates are, Triangular chart method and Rothfutch’s
method. The former is used when only three materials are to be mixed.
3. Analytical Method: In this method a system of equations are developed
based on the gradation of each aggregates, required gradation, and solved by
numerical methods. With the advent of computer, this method is becoming
popular and is discussed below. The resulting solution gives the proportion of
each type of material required for the given aggregate gradation.
GRADATION BY ANALYTICAL METHOD USING EXCEL-SOLVER
A dense mixture may be obtained when this particle size distribution follows Fuller law
which is expressed as:
P=100 x (𝒅/𝑫) 𝒏
Where, P= is the percent by weightofthe total
mixture passing any given sieve sized,
d=is sieve size in mm
D=is the size of the largest particlein that
mixture in mm
n= parameter depending on the shape ofthe aggregate(0.5
for rounded aggregates).
Based on this law Fuller-Thompson gradation charts were developed by adjusting the
parameter n for fineness or coarseness of aggregates. Practical considerations like
construction, layer thickness, workability, etc. are also considered. For example Table: 1
provides a typical gradation for bituminous
Concrete for a thickness of 40 mm.
The gradation required for a typical mix is given in Table: 2.in column and 2. The
gradation of available for three types of aggregate A, B, and C is given in column 3, 4, and
5. Determine the proportions of A, B and C if mixed will get the required gradation in
column 2.
TABLE: 2.GRADATION
3. BASAVARAJ Page 3
Sieve
Size
in (mm)
(1)
Required
Gradation
Range
(2)
Filler
Material
(A)
(3)
Fine-
Aggregate
(B)
(4)
Coarse -
Aggregate
(C)
(5)
26.5 100 100 100 100
19 100 100 100 100
13.2 79-100 100 100 84
9.5 70-88 100 100 71
4.75 53-71 100 100 50
2.36 42-58 100 71 36
1.18 34-48 100 50 25
0.6 26-38 100 35 20
0.3 18-28 100 25 13
0.15 12--20 71 18 9
0.075 4--10 40 13 5
The solution is obtained by constructing a set of equations considering the lower
and upper limits of the required gradation as well as the percentage passing of each type of
aggregate. The decision need to take is the proportion of aggregate A, B, C need to be
blended to get the gradation of column 2. Let x, y, and z represent the proportion of A, B,
and C respectively. Equation of the form ax + by + cz >= pl or <= pu can be written for
each sieve size, where a, b, and c are the proportion of aggregates A, B, and C passing for
that sieve size and pl and pu are the required gradation for that sieve size. This will lead to
the following system of equations:
Subjected to: x+ y + z = 1
Constraints: x + y + 0.840z ≥ 0.790
x + y + 0.710z ≤ 1.000
x + y + 0.710z ≥ 0.700
x + y + 0.710z ≤ 0.880
x + y + 0.500z ≥ 0.530
x + y + 0.500z ≤ 0.710
x + 0.710y + 0.360z ≥ 0.420
x + 0.710y +0.360z ≤ 0.580
x + 0.500y + 0.250z ≥ 0.340
x + 0.500y + 0.250z ≤ 0.480
x + 0.350y + 0.200z ≥ 0.260
x + 0.350y + 0.200z ≤ 0.380
x + 0.250y + 0.130z ≥ 0.180
4. BASAVARAJ Page 4
x + 0.250y + 0.130z ≤ 0.280
x + 0.180y + 0.090z ≥ 0.120
0.710x + 0.180y+ 0.090z ≤ 0.200
0.400x + 0.130y + 0.050z ≥ 0.040
0.400x + 0.130y + 0.050z ≤ 0.100
Solving the above system of equations manually is extremely difficult. Good computer
programs are required to solve this. Software like solver in Excel can be used. Soving
this set of equations is outside the scope of this book. Suppose the solution to this problem
is x = 0.06, y = 0.36, and
z = 0.58. Then Table: 3.Shows how when these proportions of aggregates A, B, and C are
combined, produces the required gradation.
TABLE: 3.RESULT OF MIX DESIGN
Sieve
Size
in (mm)
(1)
Required
Gradation
Range
(2)
Filler
Material
(A)
(3)
Fine-
Aggregate
(B)
(4)
Coarse -
Aggregate
(C)
(5)
Combined
Gradation
Obtained
(6)
26.500 100.000 6.074 35.926 58.000 100.000
19.000 100.000 6.074 35.926 58.000 100.000
13.200 79-100 6.074 35.926 48.720 90.720
9.500 70-88 6.074 35.926 41.180 83.180
4.750 53-71 6.074 35.926 29.000 71.000
2.360 42-58 6.074 25.508 20.880 52.462
1.180 34-48 6.074 17.963 14.500 38.537
0.600 26-38 6.074 12.574 11.600 30.248
0.300 18-28 6.074 8.982 7.540 22.596
0.150 12-20 4.313 6.467 5.220 15.999
0.075 4-10 2.430 4.670 2.900 10.000
STEP: 5. PREPARATION OF SPECIMEN:
The preparation of specimen depends on the stability test method employed.
The stability test methods, which are in common use for the design mix, are,
Marshall, Hubbard‐ Field and Hveem.
Hence the size of specimen, compaction and other specifications should be
followed as specified in the stability test method.
5. BASAVARAJ Page 5
PREPARATION & STABILITY TEST BY MARSHALL METHOD:
Stability of the bituminous mix specimen is defined as a maximum load carried
in kg at the standard test temperature of 60 ̊C when load is applied under
specified test conditions.
Flow Value is the total deformation that the Marshall test specimen undergoes
at the maximum load expressed in mm units.
In this test an attempt is made to obtain optimum binder content for the
aggregate mix.
There are twomajor features of the Marshall method of designing mixes
namely,
1) Density – void analysis
2) Stability – flow test
THE SPECIFICATIONS OF APPARATUS:
Cylindrical mould, 101.6 mm diameter and 63.5 mm height.
Base plate and collar.
A compaction pedestal and hammer are used to compact.
Sample extractor is used to extrude the compacted specimen from the mould.
A breaking head is used to test the specimen by applying a load on its periphery
perpendicular to its axis in a loading machine at a rate of 50 mm per
minute.(50mm/min)
A dial gauge fixed to the guide rods of the testing machine serves as flow meter
to measure the deformation of the specimen during loading.
MARSHALL STABILITY TEST MACHINE
6. BASAVARAJ Page 6
Fig:BREKING HEAD Fig:MOULD WITH COLLAR
TEST PROCEDURE:
1. The coarse aggregates, fine aggregates and the filler material are proportioned
and mixed in a such way that final gradation of the mixture is within the range
specified for the type of bituminous mix.
2. Approximately 1200 gm. of the mixed aggregates and the filler are taken and
heated to a temperature of 175 to 190 ̊C.
3. The bitumen is heated to a temperature of 121 to145 ̊C.
4. The required quantity of the first trial percentage of bitumen (say, 3.5 or 4.0
percent by weight of aggregates) is added to the heated aggregates.
5. It is thoroughly mixed at the desired temperature of 154 to 160 ̊C.
6. The mix is placed in a pre‐heated mould and compacted by a rammer (4.54 kg)
with 75 blows on either side at temperature of 138to 149 ̊C
7. Three or four specimens may be prepared using each trial bitumen content.
8. The compacted specimens are cooled to room temperature in the mould and
then removed from the molds using a specimen extractor.
9. The diameter and mean height of the specimen are measured.
10. The weight of each specimen in air and suspended in water is determined.
11.The specimens are kept immersed in water in a thermostatically controlled
water bath at 60 ± 10 ̊C for 30 to 40 minutes.
12.The specimens are taken out one by one.
13.The specimen is placed in the Marshall Test head.
14.It is then tested to determine Marshall Stability Value which is the maximum
load before failure and the Flow value which is the deformation of the specimen
up to the maximum load.
15.The corrected Marshall Stability value of each specimen is determined by
multiplying the proving ring reading with its constant.
16.If the average thickness of the specimen is not exactly 63.5 mm, a suitable
correction factor is applied.
17.The above procedure is repeated on specimens prepared with other values of
bitumen contents in suitable increments; say 0.5 percent, up to about 7.5 or
8.0 percent.
7. BASAVARAJ Page 7
18.If the average thickness of the specimen is not exactly 63.5 mm, a suitable
correction factor is applied.
CALCULATIONS:
I. DENSITY AND VOID ANALYSIS:
i. Voids in Mineral Aggregates (VMA):
VMA =Vv + Vb
Where, Vv =Volume of air voids in compacted mass
Vb =Volume of the bitumen in compacted mass
ii. Voids Filled with Bitumen (VFB):
VFB in percentage =
𝐕𝐛
𝐕𝐌𝐀
x 100
VFB in percentage =
𝐕𝐛
𝐕𝐯+𝐕𝐛
x 100
II. SPECIFIC GRAVITY:
i. Bulk Specific Gravity of Bituminous mix(Gb):
Gb =
𝐖𝐞𝐢𝐠𝐡𝐭 𝐢𝐧 𝐀𝐢𝐫
𝐖𝐞𝐢𝐠𝐡𝐭 𝐢𝐧 𝐚𝐢𝐫−𝐖𝐞𝐢𝐠𝐡𝐭 𝐢𝐧 𝐖𝐚𝐭𝐞𝐫
ii. Theoretical Specific Gravity of Bituminous mix(Gt):
Gt =
𝟏𝟎𝟎
𝐖𝟏
𝐆𝟏
+
𝐖𝟐
𝐆𝟐
+
𝐖𝟑
𝐆𝟑
+
𝐖𝟒
𝐆𝟒
Where, G1, G2, G3, G4 are apparent specific gravity of coarse aggregates, fine
aggregate, filler,and bituminous binder respectively.
Where, W1, W2, W3, W4 are percent by weight of coarse aggregate, fine
aggregate, filler and bituminous binder respectively.
III. VOLUME:
i. Volume of Air Voids (Vv):
Vv =
𝐆𝐭−𝐆𝐛
𝐆𝐭
x100
ii. Volume of Bitumen (Vb):
Vb =
𝐖𝟒
𝐆𝟒
x Gb
8. BASAVARAJ Page 8
GRAPH:
The average value of each of the above properties are found for each mix with the
different bitumen content
Graphs are plotted with the bitumen content on the X-axis and the following values
on Y-axis.
1. Marshall Stability Value.
2. Flow Value.
3. Unit Weight.
4. Percentage Voids in total mix.(Vv)
5. Percentage Voids Filled with Bitumen(VFB)
OPTIMUM BITUMEN CONTENT (OBC)
The optimum bitumen content (OBC) for the mix design is found by taking the
average value of the following three bitumen contents found from the graphs of the rest
results.
1. Bitumen content corresponding to maximum stability.
2. Bitumen content corresponding to maximum unit weight.
3. Bitumen content corresponding to the median of designed limits of percent
air voids in total mix (5%)
The Marshall Stability value, Flow value and percent voids filled with Bitumen at
the average value of bitumen content are checked with the Marshall Stability design
criteria/specification.
DESIRED VALUES:
TABLE: REQUIREMENT FOR BITUMEN CONCRETE LAYERS
(TABLE 500-19,MoRTH,2001)
Minimum Stability (kN at 60 ̊C ) 9.0
Minimum Flow (mm) 2
Maximum Flow (mm) 4
Compaction level (No.of blows) 75 blows on each of two faces of the
specimen
Percent air voids 3-6
Percent voids in mineral
aggregate(VMA)
See Table No.
Percent voids filled with
bitumen(VFB)
65-75
Loss of stability on immersion in
water at 60 ̊C (ASTMD 1075)
Min.75 % retained strength
9. BASAVARAJ Page 9
TABLE: MINIMUM PERCENT OF VOIDS IN MINERAL AGGREGATE
(VMA)
BITUMINOUS CONCRETE (TABLE 500-12, MoRTH, 2001)
Nominal
Maximum
Particle size in
mm
Minimum VMA percent related to Design Air Voids, percent
3.0 4.0 5.0
9.5 14.0 15.0 16.0
12.5 13.0 14.0 15.0
19.0 12.0 13.0 14.0
25.0 11.0 12.0 13.0
37.5 10.0 11.0 12.0