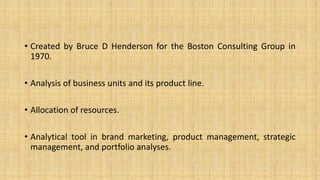
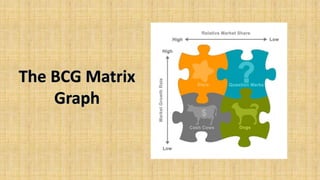
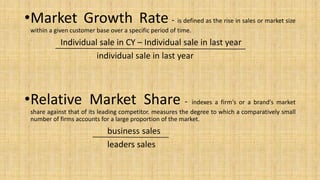
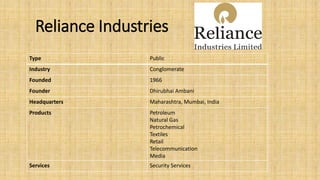
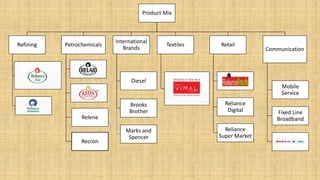
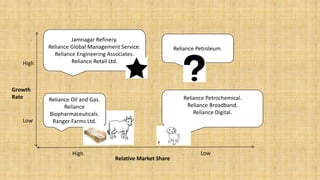
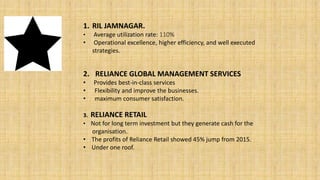
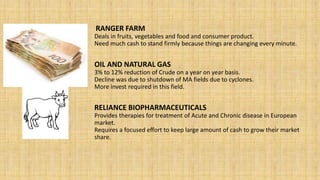
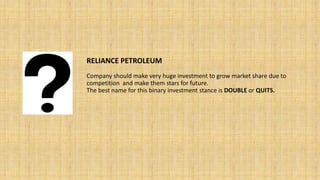
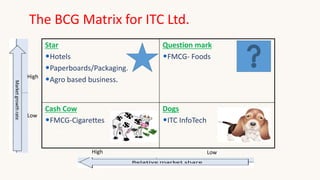
BCG Matrix
• Created by Bruce D Henderson for the Boston Consulting Group in
1970.
• Analysis of business units and its product line.
• Allocation of resources.
• Analytical tool in brand marketing, product management, strategic
management, and portfolio analyses.
•Market Growth Rate - is defined as the rise in sales or market size
within a given customer base over a specific period of time.
Individual sale in CY – Individual sale in last year
individual sale in last year
•Relative Market Share - indexes a firm's or a brand's market
share against that of its leading competitor. measures the degree to which a comparatively small
number of firms accounts for a large proportion of the market.
business sales
leaders sales
Star
• High market share in a fast-growing industry.
• They are graduated question marks.
• High funding to fight competitions and maintain a growth rate.
• When industry growth slows, if they remain a niche leader or are
amongst market leaders they have been able to maintain their
category leadership stars become cash cows, else they become dogs
due to low relative market share.
Cash Cow
• High market share in a slow-growing industry.
• Generate cash in excess of the amount of cash needed to maintain
the business.
• “Milked" continuously with as little investment as possible, since such
investment would be wasted in an industry with low growth.
Question marks
• Low market share in a high growth market.
• Starting point for most businesses.
• Potential to gain market share and become stars, and eventually cash
cows when market growth slows.
• If question marks do not succeed in becoming a market leader, they
degenerate into dogs when market growth declines.
• Analysed carefully in order to determine whether they are worth the
investment required to grow market share.
DOGS
• Low market share in a mature, slow-growing industry.
• They depress a profitable company's return on assets ratio, used by
many investors to judge how well a company is being managed.
• Dogs, it is thought, should be sold off.
Advantages
• BCG-Matrix is applicable to large companies that seek volume and
experience effects.
• The model is simple and easy to understand.
• It provides a base for management to decide and prepare for future
actions.
Limitations
• A high market share does not necessarily lead to profitability all the
time.
• The model uses only two dimensions – market share and growth rate.
• A business with a low market share can be profitable too.
• The model neglects small competitors that have fast growing market
shares.
• Sometimes Dogs can earn even more cash as cash cows.
• Market growth is not the only indicator for attractiveness of the
market.
Reliance Industries
Type Public
Industry Conglomerate
Founded 1966
Founder Dhirubhai Ambani
Headquarters Maharashtra, Mumbai, India
Products Petroleum
Natural Gas
Petrochemical
Textiles
Retail
Telecommunication
Media
Services Security Services
Product Mix
Refining Petrochemicals
Relene
Recron
International
Brands
Diesel
Brooks
Brother
Marks and
Spencer
Textiles Retail
Reliance
Digital
Reliance
Super Market
Communication
Mobile
Service
Fixed Line
Broadband
Jamnagar Refinery.
Reliance Global Management Service.
Reliance Engineering Associates.
Reliance Retail Ltd.
Reliance Oil and Gas.
Reliance
Biopharmaceuticals.
Ranger Farms Ltd.
Reliance Petroleum.
Reliance Petrochemical.
Reliance Broadband.
Reliance Digital.
Growth
Rate
Relative Market Share
Low
Low
High
High
1. RIL JAMNAGAR.
• Average utilization rate: 110%
• Operational excellence, higher efficiency, and well executed
strategies.
2. RELIANCE GLOBAL MANAGEMENT SERVICES
• Provides best-in-class services
• Flexibility and improve the businesses.
• maximum consumer satisfaction.
3. RELIANCE RETAIL
• Not for long term investment but they generate cash for the
organisation.
• The profits of Reliance Retail showed 45% jump from 2015.
• Under one roof.
RANGER FARM
Deals in fruits, vegetables and food and consumer product.
Need much cash to stand firmly because things are changing every minute.
OIL AND NATURAL GAS
3% to 12% reduction of Crude on a year on year basis.
Decline was due to shutdown of MA fields due to cyclones.
More invest required in this field.
RELIANCE BIOPHARMACEUTICALS
Provides therapies for treatment of Acute and Chronic disease in European
market.
Requires a focused effort to keep large amount of cash to grow their market
share.
RELIANCE PETROLEUM
Company should make very huge investment to grow market share due to
competition and make them stars for future.
The best name for this binary investment stance is DOUBLE or QUITS.
PETROCHEMICALS
• Revenue decreased marginally from Rs.53,000/- crore to Rs.32,767/- crore.
Reliance Broadband
• Least preferred.
• Competitors like BSNL, GTPL etc. are capturing a major market.
Reliance Digital TV
• Least market shares among its competitors.
Introduction
• ITC Limited, is an Indian conglomerate with a turnover of US $ 6 billion
and a market capitalization of over US $ 22 Billion
• The company is currently headed by YOGESH CHANDER DEVESHWAR.
ITC Product Mix and Product Line
FMCG
• Cigarettes
• Foods
• Personal care
• Lifestyle
Retailing
• Education and
Stationary
• Safety Matches
• Incense sticks
Hotels
• ITC welcome
group
• Welcome
Heritage
• Kaya Kalp
• Fortune hotels
Paper boards
and packaging
• Paper boards
• Packing
• Speciality paper
IT
Agriculture
Business
• Leaf tobacco
• Agriculture
commodities
• E-choupal
Cigarettes
• W. D. & H. O. Wills
• Gold Flake
• Navy Cut
• Insignia
• India Kings
• Classic (Verve, Regular, Mild & Ultra Mild)
Foods business:
• Kitchens of India
• Aashirvaad
• Minto
• Sunfeast
• Candyman
Hotels:
Market share of ITC Ltd.
Outstanding Market Leader
• Cigarettes
• Hotels
• Paperboards
• Packaging
• Agriculture Exports
 Gaining Market Share
• Nascent businesses of Packaged Foods & Confectionery
• Branded Apparel
• Greeting Cards
Segment Dominance
Cigarettes 78% market share
Paper & Packaging Packaging board – No. 1 in Asia
Agriculture business 1of the largest
exporters from India
Hotels ITC Group ranks No.2
FMCG
(Others)
20% share of greeting cards market,
'Aashirvaad' atta is No.1 in branded
segment
The BCG Matrix for ITC Ltd.
Star
•Hotels
•Paperboards/Packaging.
•Agro based business.
Question mark
•FMCG- Foods
Cash Cow
•FMCG-Cigarettes
Dogs
•ITC InfoTech
High
Low
LowHigh
 Leader expanding industry
 Generates large profits
 Requires substantial investments to sustain growth
 Farthest down on experience curve relative to
competition.
 Increase in market share.
 Cigarette sector – 78% Market share (Approx.)
 Leader in mature or declining industry.
 Maximize cash flow
 Maintain market share
Product Market share
Aashirvad 28%
Sunfeast 21.7%
Bingo 19.4%
Candyman 11.3%
 InfoTech sector – 15% Market share (Approx.)
 Low market share in a mature industry.
Star strategy
 By increasing the investments in hospitality sector
 By maintaining the service and product quality
 Expanding packaging services to more countries.
Question mark strategy
 Low market share in expanding industry.
 Needs substantial cash to improve its position
 Slow progress on experience curve.
 Pushing a question mark into STAR
Question mark Star
Cash cow strategy
 Reduce the amount of investment
 Try to take out maximum cash flow out of the product
 Profitability will be increased by doing so.
Dog Strategy
Either divest the product altogether
OR
Revamp the product.
 Concentrate on processes requiring limited effort.
 Kill the DOG.
BCG Matrix

BCG Matrix

  • 1.
  • 2.
    • Created byBruce D Henderson for the Boston Consulting Group in 1970. • Analysis of business units and its product line. • Allocation of resources. • Analytical tool in brand marketing, product management, strategic management, and portfolio analyses.
  • 4.
    •Market Growth Rate- is defined as the rise in sales or market size within a given customer base over a specific period of time. Individual sale in CY – Individual sale in last year individual sale in last year •Relative Market Share - indexes a firm's or a brand's market share against that of its leading competitor. measures the degree to which a comparatively small number of firms accounts for a large proportion of the market. business sales leaders sales
  • 5.
    Star • High marketshare in a fast-growing industry. • They are graduated question marks. • High funding to fight competitions and maintain a growth rate. • When industry growth slows, if they remain a niche leader or are amongst market leaders they have been able to maintain their category leadership stars become cash cows, else they become dogs due to low relative market share.
  • 6.
    Cash Cow • Highmarket share in a slow-growing industry. • Generate cash in excess of the amount of cash needed to maintain the business. • “Milked" continuously with as little investment as possible, since such investment would be wasted in an industry with low growth.
  • 7.
    Question marks • Lowmarket share in a high growth market. • Starting point for most businesses. • Potential to gain market share and become stars, and eventually cash cows when market growth slows. • If question marks do not succeed in becoming a market leader, they degenerate into dogs when market growth declines. • Analysed carefully in order to determine whether they are worth the investment required to grow market share.
  • 8.
    DOGS • Low marketshare in a mature, slow-growing industry. • They depress a profitable company's return on assets ratio, used by many investors to judge how well a company is being managed. • Dogs, it is thought, should be sold off.
  • 9.
    Advantages • BCG-Matrix isapplicable to large companies that seek volume and experience effects. • The model is simple and easy to understand. • It provides a base for management to decide and prepare for future actions.
  • 10.
    Limitations • A highmarket share does not necessarily lead to profitability all the time. • The model uses only two dimensions – market share and growth rate. • A business with a low market share can be profitable too. • The model neglects small competitors that have fast growing market shares. • Sometimes Dogs can earn even more cash as cash cows. • Market growth is not the only indicator for attractiveness of the market.
  • 11.
    Reliance Industries Type Public IndustryConglomerate Founded 1966 Founder Dhirubhai Ambani Headquarters Maharashtra, Mumbai, India Products Petroleum Natural Gas Petrochemical Textiles Retail Telecommunication Media Services Security Services
  • 12.
    Product Mix Refining Petrochemicals Relene Recron International Brands Diesel Brooks Brother Marksand Spencer Textiles Retail Reliance Digital Reliance Super Market Communication Mobile Service Fixed Line Broadband
  • 13.
    Jamnagar Refinery. Reliance GlobalManagement Service. Reliance Engineering Associates. Reliance Retail Ltd. Reliance Oil and Gas. Reliance Biopharmaceuticals. Ranger Farms Ltd. Reliance Petroleum. Reliance Petrochemical. Reliance Broadband. Reliance Digital. Growth Rate Relative Market Share Low Low High High
  • 14.
    1. RIL JAMNAGAR. •Average utilization rate: 110% • Operational excellence, higher efficiency, and well executed strategies. 2. RELIANCE GLOBAL MANAGEMENT SERVICES • Provides best-in-class services • Flexibility and improve the businesses. • maximum consumer satisfaction. 3. RELIANCE RETAIL • Not for long term investment but they generate cash for the organisation. • The profits of Reliance Retail showed 45% jump from 2015. • Under one roof.
  • 15.
    RANGER FARM Deals infruits, vegetables and food and consumer product. Need much cash to stand firmly because things are changing every minute. OIL AND NATURAL GAS 3% to 12% reduction of Crude on a year on year basis. Decline was due to shutdown of MA fields due to cyclones. More invest required in this field. RELIANCE BIOPHARMACEUTICALS Provides therapies for treatment of Acute and Chronic disease in European market. Requires a focused effort to keep large amount of cash to grow their market share.
  • 16.
    RELIANCE PETROLEUM Company shouldmake very huge investment to grow market share due to competition and make them stars for future. The best name for this binary investment stance is DOUBLE or QUITS.
  • 17.
    PETROCHEMICALS • Revenue decreasedmarginally from Rs.53,000/- crore to Rs.32,767/- crore. Reliance Broadband • Least preferred. • Competitors like BSNL, GTPL etc. are capturing a major market. Reliance Digital TV • Least market shares among its competitors.
  • 19.
    Introduction • ITC Limited,is an Indian conglomerate with a turnover of US $ 6 billion and a market capitalization of over US $ 22 Billion • The company is currently headed by YOGESH CHANDER DEVESHWAR.
  • 20.
    ITC Product Mixand Product Line FMCG • Cigarettes • Foods • Personal care • Lifestyle Retailing • Education and Stationary • Safety Matches • Incense sticks Hotels • ITC welcome group • Welcome Heritage • Kaya Kalp • Fortune hotels Paper boards and packaging • Paper boards • Packing • Speciality paper IT Agriculture Business • Leaf tobacco • Agriculture commodities • E-choupal
  • 21.
    Cigarettes • W. D.& H. O. Wills • Gold Flake • Navy Cut • Insignia • India Kings • Classic (Verve, Regular, Mild & Ultra Mild)
  • 22.
    Foods business: • Kitchensof India • Aashirvaad • Minto • Sunfeast • Candyman
  • 23.
  • 24.
    Market share ofITC Ltd. Outstanding Market Leader • Cigarettes • Hotels • Paperboards • Packaging • Agriculture Exports
  • 25.
     Gaining MarketShare • Nascent businesses of Packaged Foods & Confectionery • Branded Apparel • Greeting Cards
  • 26.
    Segment Dominance Cigarettes 78%market share Paper & Packaging Packaging board – No. 1 in Asia Agriculture business 1of the largest exporters from India Hotels ITC Group ranks No.2 FMCG (Others) 20% share of greeting cards market, 'Aashirvaad' atta is No.1 in branded segment
  • 27.
    The BCG Matrixfor ITC Ltd. Star •Hotels •Paperboards/Packaging. •Agro based business. Question mark •FMCG- Foods Cash Cow •FMCG-Cigarettes Dogs •ITC InfoTech High Low LowHigh
  • 28.
     Leader expandingindustry  Generates large profits  Requires substantial investments to sustain growth  Farthest down on experience curve relative to competition.  Increase in market share.
  • 29.
     Cigarette sector– 78% Market share (Approx.)  Leader in mature or declining industry.  Maximize cash flow  Maintain market share
  • 30.
    Product Market share Aashirvad28% Sunfeast 21.7% Bingo 19.4% Candyman 11.3%
  • 31.
     InfoTech sector– 15% Market share (Approx.)  Low market share in a mature industry.
  • 32.
    Star strategy  Byincreasing the investments in hospitality sector  By maintaining the service and product quality  Expanding packaging services to more countries.
  • 33.
    Question mark strategy Low market share in expanding industry.  Needs substantial cash to improve its position  Slow progress on experience curve.  Pushing a question mark into STAR Question mark Star
  • 34.
    Cash cow strategy Reduce the amount of investment  Try to take out maximum cash flow out of the product  Profitability will be increased by doing so.
  • 35.
    Dog Strategy Either divestthe product altogether OR Revamp the product.  Concentrate on processes requiring limited effort.  Kill the DOG.