Download as PDF, PPTX
- 1 / 35
- 2 / 35

- 3 / 35
- 4 / 35
- 5 / 35

- 6 / 35

- 7 / 35

- 8 / 35

- 9 / 35

- 10 / 35
- 11 / 35
- 12 / 35
- 13 / 35
- 14 / 35
- 15 / 35

- 16 / 35
- 17 / 35
- 18 / 35

- 19 / 35
- 20 / 35
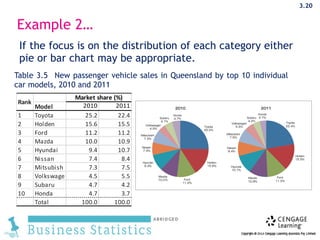
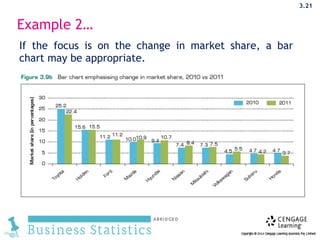
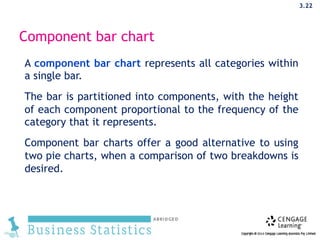
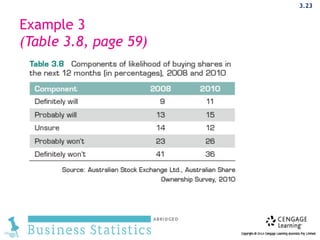
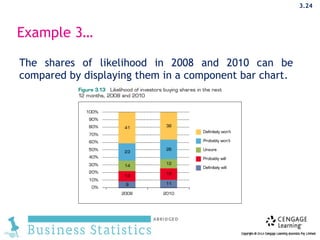
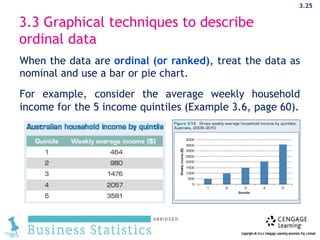




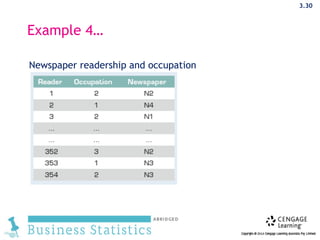
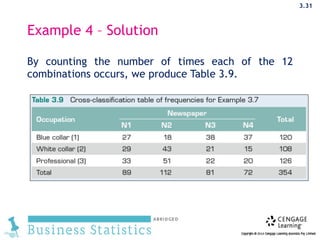
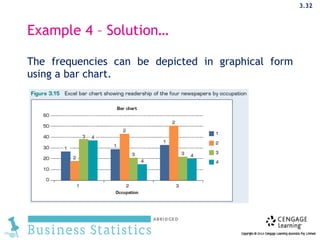

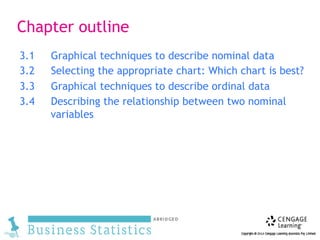
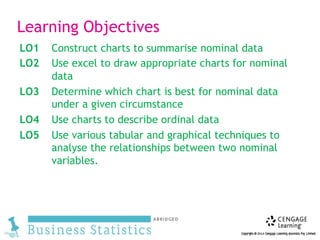
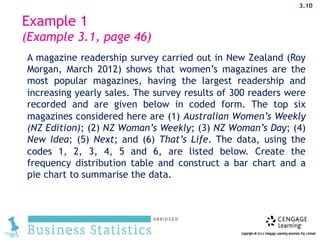
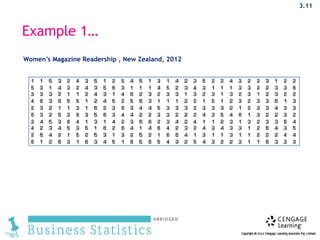
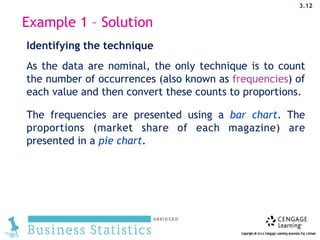
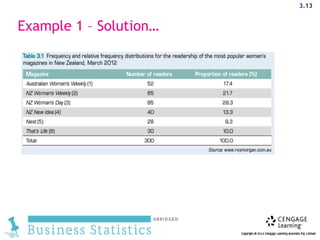
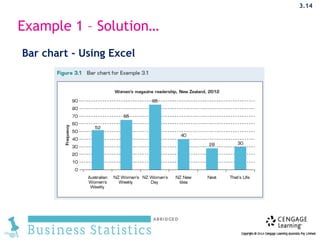
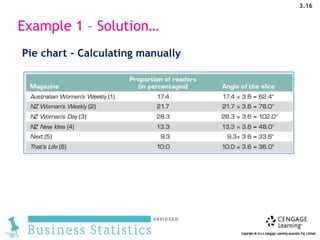
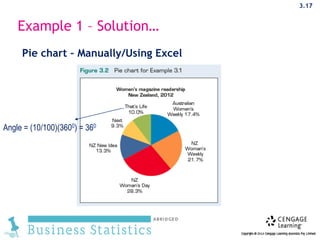
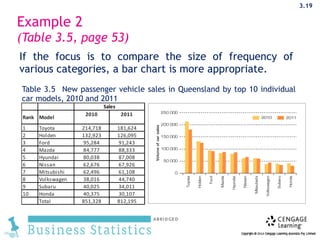
Chapter 3 discusses graphical and tabular techniques for summarizing nominal and ordinal data, focusing on selecting appropriate charts like bar charts and pie charts. It provides guidelines for representing data visually to enhance decision making and explains how to analyze relationships between two nominal variables using methods such as cross-classification tables. The chapter also includes examples and practical tips for constructing charts and interpreting results.


![business research method chp 7]](https://cdn.slidesharecdn.com/ss_thumbnails/brmchp7-160111102915-thumbnail.jpg?width=640&height=640&fit=bounds)


