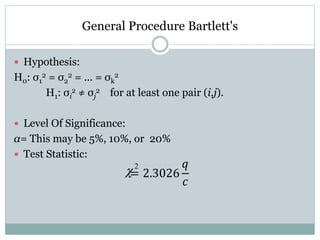
Introduction
 We use, observe and study different things in our
daily life. We want to chose best from different given
set of those things. Then we analyze them on the
basis of our own experience.
 We chose that thing which one is best from others on
the basis of variation.
 In statistics we say that the best sample data has
minimum variation. We have different statistical
tools to calculate or test the variation in data.
 For the testing of single variance, we use Chi-Squar
test.
Introduction
 To calculate, check the equality or test the variation
between two sample data, or two groups of data we
use F-test.
 When we want to test the equality of variances
between more than 2 variances, we use Bartlett’s
test.
Bartlett's Test for Equality of Variances
 Bartlett's test (introduced in 1937 by Maurice Barlett
(1910-2002)) is an inferential procedure used to
assess the equality of variance in different
populations.
 Bartlett's test is used to test if k samples have equal
variances. Equal variances across samples is called
homogeneity of variances. Some statistical tests, for
example the analysis of variance, assume that
variances are equal across groups or samples.
Bartlett's Test for Equality of Variances
 The Bartlett test can be used to verify that assumption.
Bartlett's test is sensitive to departures from normality.
That is, if your samples come from non-normal
distributions, then Bartlett's test may simply be testing
for non-normality. The Levene Test is an alternative to
the Bartlett test that is less sensitive to departures from
normality.
 Some common statistical methods assume that variances
of the populations from which different samples are
drawn are equal. Bartlett's test assesses this assumption.
It tests the null hypothesis that the population variances
are equal.
General Procedure Bartlett's
 Hypothesis:
H0: σ1
2 = σ2
2 = ... = σk
2
H1: σi
2 ≠ σj
2 for at least one pair (i,j).
 Level Of Significance:
α= This may be 5%, 10%, or 20%
 Test Statistic:
= 2.3026
𝑞
𝑐
2

 Critical Region:
The variances are judged to be unequal if,
𝑇 > 𝜒1−𝑎 ,𝑘−1
2
Where
𝜒1−𝑎 ,𝑘−1
2
is the critical value of the chi-square distribution
with k - 1 degrees of freedom and a significance level of α.
Model Assumptions
• Homogeneity (common group variances).
• Normality of responses (or of residuals).
• Independence of responses (or of residuals). (Hopefully
achieved through randomization…)
Uses Of Bartlett test
 This may be used in quality control in industry’s
products.
We use in it different fields of our life.
 In quality control we have an simple example: take 5
or 6 cold drinks. Observe the level of all of those
bottles, we can see that there is little difference in the
level of all of those bottles.
 Different companies make different electric
products. For example Pak fans, G.F.C fans, Asia fan
etc.. Every company complains that the average
Life time of their product is better than all of other.
 Many companies make fertilizers. Each of them
claims that their fertilizer’s performance is better
than other.

Bartlett's test

  • 3.
    Introduction  We use,observe and study different things in our daily life. We want to chose best from different given set of those things. Then we analyze them on the basis of our own experience.  We chose that thing which one is best from others on the basis of variation.  In statistics we say that the best sample data has minimum variation. We have different statistical tools to calculate or test the variation in data.  For the testing of single variance, we use Chi-Squar test.
  • 4.
    Introduction  To calculate,check the equality or test the variation between two sample data, or two groups of data we use F-test.  When we want to test the equality of variances between more than 2 variances, we use Bartlett’s test.
  • 5.
    Bartlett's Test forEquality of Variances  Bartlett's test (introduced in 1937 by Maurice Barlett (1910-2002)) is an inferential procedure used to assess the equality of variance in different populations.  Bartlett's test is used to test if k samples have equal variances. Equal variances across samples is called homogeneity of variances. Some statistical tests, for example the analysis of variance, assume that variances are equal across groups or samples.
  • 6.
    Bartlett's Test forEquality of Variances  The Bartlett test can be used to verify that assumption. Bartlett's test is sensitive to departures from normality. That is, if your samples come from non-normal distributions, then Bartlett's test may simply be testing for non-normality. The Levene Test is an alternative to the Bartlett test that is less sensitive to departures from normality.  Some common statistical methods assume that variances of the populations from which different samples are drawn are equal. Bartlett's test assesses this assumption. It tests the null hypothesis that the population variances are equal.
  • 7.
    General Procedure Bartlett's Hypothesis: H0: σ1 2 = σ2 2 = ... = σk 2 H1: σi 2 ≠ σj 2 for at least one pair (i,j).  Level Of Significance: α= This may be 5%, 10%, or 20%  Test Statistic: = 2.3026 𝑞 𝑐 2 
  • 8.
     Critical Region: Thevariances are judged to be unequal if, 𝑇 > 𝜒1−𝑎 ,𝑘−1 2 Where 𝜒1−𝑎 ,𝑘−1 2 is the critical value of the chi-square distribution with k - 1 degrees of freedom and a significance level of α.
  • 9.
    Model Assumptions • Homogeneity(common group variances). • Normality of responses (or of residuals). • Independence of responses (or of residuals). (Hopefully achieved through randomization…)
  • 10.
    Uses Of Bartletttest  This may be used in quality control in industry’s products. We use in it different fields of our life.  In quality control we have an simple example: take 5 or 6 cold drinks. Observe the level of all of those bottles, we can see that there is little difference in the level of all of those bottles.  Different companies make different electric products. For example Pak fans, G.F.C fans, Asia fan etc.. Every company complains that the average
  • 11.
    Life time oftheir product is better than all of other.  Many companies make fertilizers. Each of them claims that their fertilizer’s performance is better than other.