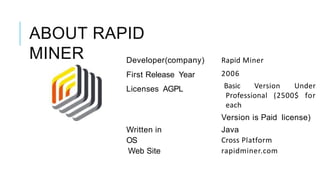
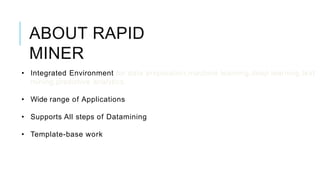
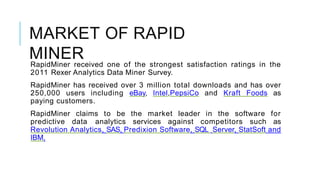
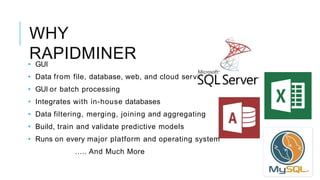
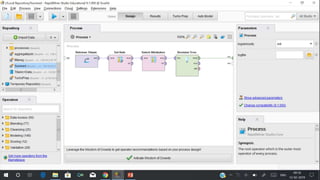
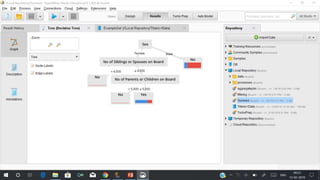
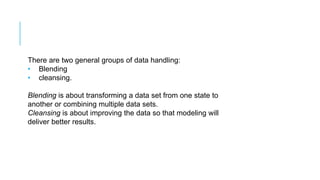
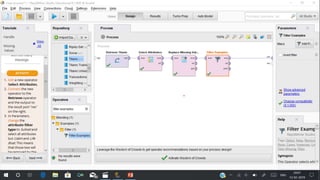
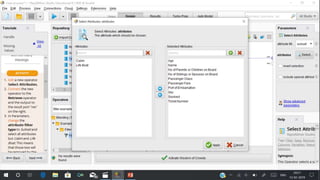
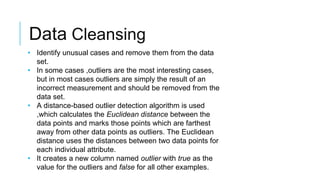
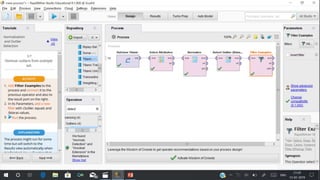
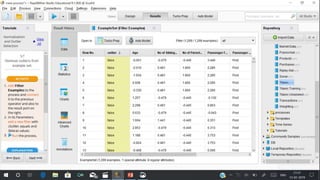
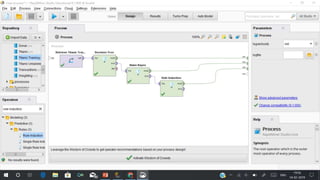
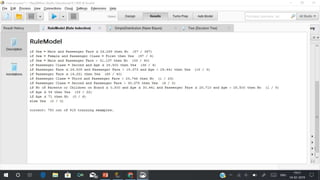
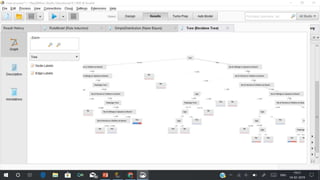
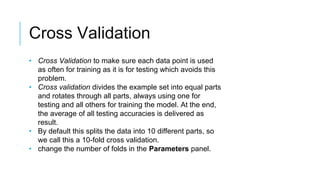
RAPID
MINER
An open source platform
for data mining
ABOUT RAPID
MINER Developer(company)
First Release Year
Licenses AGPL
Written in
OS
Web Site
Rapid Miner
2006
Basic Version Under
Professional (2500$ for
each
Version is Paid license)
Java
Cross Platform
rapidminer.com
ABOUT RAPID
MINER
• Integrated Environment for data preparation,machine learning,deep learning,text
mining,predictive analytics.
• Wide range of Applications
• Supports All steps of Datamining
• Template-base work
MARKET OF RAPID
MINERRapidMiner received one of the strongest satisfaction ratings in the
2011 Rexer Analytics Data Miner Survey.
RapidMiner has received over 3 million total downloads and has over
250,000 users including eBay, Intel,PepsiCo and Kraft Foods as
paying customers.
RapidMiner claims to be the market leader in the software for
predictive data analytics services against competitors such as
Revolution Analytics, SAS, Predixion Software, SQL Server, StatSoft and
IBM.
DIFFERENT
VERSIONS
• RapidMiner Studio
• RapidMiner Server
• RapidMiner radoop (Rapid miner version of hadoop)
• RapidMiner Cloud
• RapidMiner Extension
WHY
RAPIDMINER
vices
• GUI
• Data from file, database, web, and cloud ser
• GUI or batch processing
• Integrates with in-house databases
• Data filtering, merging, joining and aggregating
• Build, train and validate predictive models
• Runs on every major platform and operating system
….. And Much More
• The term attribute is RapidMiner for "column."
• In machine learning, each row of a data set is an example
for a specific situation and the attributes (columns) are the
properties that describe the situation.
• It is sometimes also known as target or class or predicted
label.
• Join, Aggregate, Filter, Sort, Generate Attributes, and
Select Attributes.
• The role of an attribute describes how the column is
used by machine learning operators.
• Attributes without any role (also called "regular"
attributes) are used as input for training while id
attributes are usually ignored by modeling algorithms
because they are only used as unique identifiers of
observations of data.
Attributes
There are two general groups of data handling:
• Blending
• cleansing.
Blending is about transforming a data set from one state to
another or combining multiple data sets.
Cleansing is about improving the data so that modeling will
deliver better results.
Handle Missing
values
Data Cleansing
• Identify unusual cases and remove them from the data
set.
• In some cases ,outliers are the most interesting cases,
but in most cases outliers are simply the result of an
incorrect measurement and should be removed from the
data set.
• A distance-based outlier detection algorithm is used
,which calculates the Euclidean distance between the
data points and marks those points which are farthest
away from other data points as outliers. The Euclidean
distance uses the distances between two data points for
each individual attribute.
• It creates a new column named outlier with true as the
value for the outliers and false for all other examples.
Predictive Modeling
• Predictive Modeling is a set of machine learning
techniques which search for patterns in big data sets and
use those patterns to create predictions for new
situations.
• Those predictions can be categorical (this is called
classification learning) or numerical (regression learning).
• In this, we need training data with known labels as input
for this kind of machine learning method. So this type of
method supervised learning.
Scoring
• Using a model to generate predictions for new data
points is called Scoring.
• Here,the Naïve Bayes method is used to predict the
"Survived" class (yes / no) of each passenger and find
their respective confidences
• Apply Model operator is used to create predictions for
a new, unlabeled data set.
Split labeled data into two partitions.
• Split Data takes an example set and divides it into the
partitions we have defined.
• In this case, we will get two partitions with 70% of the
data in one and 30% of the data in the other.
Cross Validation
• Cross Validation to make sure each data point is used
as often for training as it is for testing which avoids this
problem.
• Cross validation divides the example set into equal parts
and rotates through all parts, always using one for
testing and all others for training the model. At the end,
the average of all testing accuracies is delivered as
result.
• By default this splits the data into 10 different parts, so
we call this a 10-fold cross validation.
• change the number of folds in the Parameters panel.
Prepared by :
Srushti Suvarna

Rapid Miner

  • 1.
    RAPID MINER An open sourceplatform for data mining
  • 2.
    ABOUT RAPID MINER Developer(company) FirstRelease Year Licenses AGPL Written in OS Web Site Rapid Miner 2006 Basic Version Under Professional (2500$ for each Version is Paid license) Java Cross Platform rapidminer.com
  • 3.
    ABOUT RAPID MINER • IntegratedEnvironment for data preparation,machine learning,deep learning,text mining,predictive analytics. • Wide range of Applications • Supports All steps of Datamining • Template-base work
  • 4.
    MARKET OF RAPID MINERRapidMinerreceived one of the strongest satisfaction ratings in the 2011 Rexer Analytics Data Miner Survey. RapidMiner has received over 3 million total downloads and has over 250,000 users including eBay, Intel,PepsiCo and Kraft Foods as paying customers. RapidMiner claims to be the market leader in the software for predictive data analytics services against competitors such as Revolution Analytics, SAS, Predixion Software, SQL Server, StatSoft and IBM.
  • 5.
    DIFFERENT VERSIONS • RapidMiner Studio •RapidMiner Server • RapidMiner radoop (Rapid miner version of hadoop) • RapidMiner Cloud • RapidMiner Extension
  • 6.
    WHY RAPIDMINER vices • GUI • Datafrom file, database, web, and cloud ser • GUI or batch processing • Integrates with in-house databases • Data filtering, merging, joining and aggregating • Build, train and validate predictive models • Runs on every major platform and operating system ….. And Much More
  • 7.
    • The termattribute is RapidMiner for "column." • In machine learning, each row of a data set is an example for a specific situation and the attributes (columns) are the properties that describe the situation. • It is sometimes also known as target or class or predicted label.
  • 8.
    • Join, Aggregate,Filter, Sort, Generate Attributes, and Select Attributes. • The role of an attribute describes how the column is used by machine learning operators. • Attributes without any role (also called "regular" attributes) are used as input for training while id attributes are usually ignored by modeling algorithms because they are only used as unique identifiers of observations of data. Attributes
  • 11.
    There are twogeneral groups of data handling: • Blending • cleansing. Blending is about transforming a data set from one state to another or combining multiple data sets. Cleansing is about improving the data so that modeling will deliver better results.
  • 12.
  • 14.
    Data Cleansing • Identifyunusual cases and remove them from the data set. • In some cases ,outliers are the most interesting cases, but in most cases outliers are simply the result of an incorrect measurement and should be removed from the data set. • A distance-based outlier detection algorithm is used ,which calculates the Euclidean distance between the data points and marks those points which are farthest away from other data points as outliers. The Euclidean distance uses the distances between two data points for each individual attribute. • It creates a new column named outlier with true as the value for the outliers and false for all other examples.
  • 17.
    Predictive Modeling • PredictiveModeling is a set of machine learning techniques which search for patterns in big data sets and use those patterns to create predictions for new situations. • Those predictions can be categorical (this is called classification learning) or numerical (regression learning). • In this, we need training data with known labels as input for this kind of machine learning method. So this type of method supervised learning.
  • 21.
    Scoring • Using amodel to generate predictions for new data points is called Scoring. • Here,the Naïve Bayes method is used to predict the "Survived" class (yes / no) of each passenger and find their respective confidences • Apply Model operator is used to create predictions for a new, unlabeled data set.
  • 23.
    Split labeled datainto two partitions. • Split Data takes an example set and divides it into the partitions we have defined. • In this case, we will get two partitions with 70% of the data in one and 30% of the data in the other.
  • 25.
    Cross Validation • CrossValidation to make sure each data point is used as often for training as it is for testing which avoids this problem. • Cross validation divides the example set into equal parts and rotates through all parts, always using one for testing and all others for training the model. At the end, the average of all testing accuracies is delivered as result. • By default this splits the data into 10 different parts, so we call this a 10-fold cross validation. • change the number of folds in the Parameters panel.
  • 27.

Editor's Notes

  • #28 Other interesting features are continued in another presenation.