The study evaluated the quality of drinking water supplied by vendors to households in the Sabon-Gari area of Kano, Nigeria, analyzing 90 water samples for physico-chemical and bacteriological parameters. Results revealed that many samples did not meet WHO and Nigerian standards, with high levels of contaminants, including coliform organisms, indicating compromised water quality at various distribution points. The study highlights the need for regulation and monitoring of water vendors to safeguard public health.
![Assessment Of The Quality Of Water Supplied By Water …
www.theijes.com The IJES Page 17
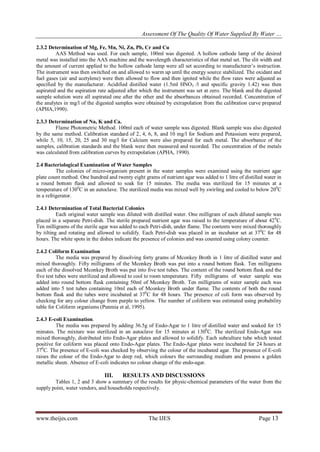
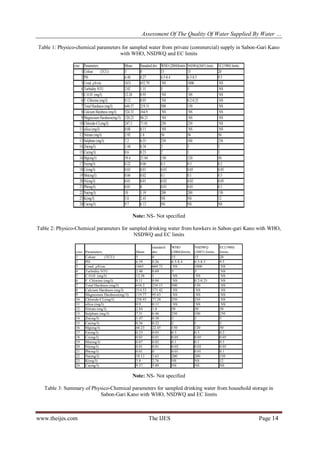
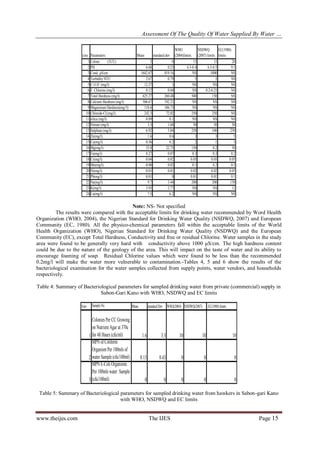
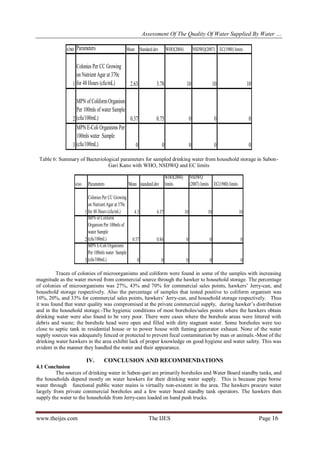
Traces of colonies of microorganisms and coliform were found in some of the samples with increasing
magnitude as water moved from commercial source through the hawker to household storage. Thus it was found
that water quality was compromised at the private commercial supply, during hawker’s distribution and in the
household storage.
4.2 Recommendations
The importance of safe drinking water to the wellbeing of every individual cannot be over-emphasized.
Unclean or unprotected water can be a veritable source of infection and propagation of diseases.
In view of the overall findings in the study area the following recommendations are deemed appropriate.
[1] The health and water regulatory agencies should ensure that all commercial drinking water suppliers are
not only licensed but are also trained regularly on water safety and personal hygiene.
[2] The agencies should carry out regular inspection to ensure that water supply areas are tidy and are
adequately protected to prevent contamination of drinking water by human or animal fecal wastes.
[3] Water sales operators should be discouraged from citing boreholes/water sales points near septic tanks or
close to generator exhaust. They should be required to dose Chlorine to a level of 0.2mg/l in drinking
water sold to the public.
[4] There is a need for public enlightenment for water hawkers and households in the study area on personal
hygiene, handling and storage of drinking water. Households should boil their water before drinking
especially water from outside public mains.
[5] The water supply agency should endeavour to restore or build adequate and functional public water
infrastructure such that portable water could be supplied to all households in the area through water pipes.
[6] Further research on water quality in the area could look into drinking water quality under household
storage conditions.
REFERENCES
[1] Anan, K. (2001): Message of UN Secretary-General Kofi Anan on World Water Day.
[2] UNICEF/WHO (2004): Meeting the MDG drinking water and sanitation target: a mid-term assessment of progress. United Nations
Children's Fund/World Health Organization, New York.
[3] UNDP (2006): Human development report: beyond scarcity: power, poverty and the global water crisis. United Nations
Development Programme. New York: Palgrave Macmillan
[4] Busari, O. (2006): Rural water quality guidelines and rationale: case study from Swaziland. Available
at:http://www.dbsa.org/Research/Documents/RURAL%20Water%20Quality%20Guidelines%20and%20Rationale.doc [Assessed 5
April 2008].
[5] UNEP (2004): Challenges of water scarcity. United Nations Environmental Programme. Washington.
[6] USAID (2005): Investments in drinking water supply projects and related activities in 2005. The United States Agency for
International Development Washington D, C.
[7] WWDR (2003): Mitigating risks and coping with uncertainty. United Nations World Water Development Report, Paris:
[8] Population Report (1998): Solutions for a water-short world. Population Information Program, Center for Communication
Programs, USA. The Johns Hopkins School of Public Health, Vol. 26, Number 1.
[9] UNICEF/WHO (2000): Global water supply and sanitation assessment 2000 report. United Nations Children Fund and World
Health Organization.
[10] NationMaster.com (2008): Drinking water availability ( % most recent) by country. Available at:
http://www.who.int/ipcs/publications/newsletters/en/04.pdf [Assessed 10 July 2008].
[11] UNICEF/WHO (2005): Joint report on drinking water quality in Nigeria. United Nations Children Fund and World Health
Organization.
[12] Matsuura, K. (2003): while demand is growing dramatically at an unsustainable rate, water supplies are falling…. An address
delivered at the opening session of the intergovernmental ministerial conference at the Third World Water Forum, Kyoto, Japan.
[13] Ibiam, A. (2008): Watch what water you’re drinking. Thisday Newspapers Lagos. May 20.
[14] FMWR (2000);“National Water Supply and Sanitation Policy”, Department of Water Supply and Quality Control, FMWR, Abuja.
[15] Kazuare, U. (2005) : Kano State Water Board present situation problems and the way out. Seminar paper; Technical Session,
Nigerian Society of Engineers, Kano Branch.
[16] APHA (1990); Standard Method for the Examination of Water and Waste Water, 18th ed., American Public Health Association.
[17] Punmia, B., Ashok, J., and Arun, J., (1995): Water supply engineering. New Delhi: Laxmi Publications ltd.
[18] WHO (2004): Guidelines for drinking-water quality. World Health Organization Geneva Vol.1: 3 ed. ISBN 92 4 154638 7
[19] NSDWQ (2007): Nigerian standard for drinking water quality. Standard Organization of Nigeria. Wuse, Abuja.](https://image.slidesharecdn.com/b027309017-130813052753-phpapp02/85/The-International-Journal-of-Engineering-and-Science-The-IJES-9-320.jpg)


