The International Journal of Engineering & Science is aimed at providing a platform for researchers, engineers, scientists, or educators to publish their original research results, to exchange new ideas, to disseminate information in innovative designs, engineering experiences and technological skills. It is also the Journal's objective to promote engineering and technology education. All papers submitted to the Journal will be blind peer-reviewed. Only original articles will be published.
The document discusses real-time IoT stream processing and large-scale data analytics for smart city applications. It describes activities related to data aggregation and abstraction through data fusion, event detection in urban data streams, and real-time adaptive urban reasoning. The activities aim to bridge the gap between raw sensor data and higher-level knowledge through semantic techniques.
Open source health gis presentation finalJISC GECO
This document discusses using open source GIS tools to help address gaps in primary health care (PHC) services. It outlines current trends in PHC geography and use of GIS, including more localized information needs and the development of GP consortia. Existing GIS applications and tools are presented, along with some of their limitations. The document proposes a theoretical open source GIS toolkit using PHC, patient, and socio-demographic data to help inform PHC planning and services. Developing such a toolkit could help make GIS and geographic information more cost-effective and customizable for PHC organizations.
Spatial representation of data in Urban Planning and DesignRoberto Rocco
This a lecture of data, statistics and spatial representation and understanding of data. This is important for planners and designers who need to understand social trends in space and how to communicate them to an audience. I typically teach this lecture in 50 minutes (I skip some slides). Feel free to use material here, but do the right thing: acknowledge the source.
Analysis Of Influence Of Spatial Planning On Performance Of Regional Developm...Suwandi, Dr. SE.,MSi
The various problems in regional spatial planning in Waropen District, Papua, shows that the Spatial Planning (RTRW) of Waropen District, Papua, drafted in 2010 has not had a positive contribution to the settlement of spatial planning problems. This is most likely caused by the inconsistency in the spatial planning. This study tried to observe the consistency of spatial planning as well as its relation to the regional development performance. The method used to observe the consistency of the preparation of guided Spatial Planning (RTRW) is the analysis of comparative table followed by analysis of verbal logic. In order to determine if the preparation of Spatial Planning (RTRW) has already paid attention on the synergy with the surrounding regions (Inter-Regional Context), a map overlay was conducted, followed by analysis of verbal logic. To determine the performance of the regional development, a Principal Components Analysis (PCA) was done. The analysis results showed that inconsistencies in the spatial planning had caused a variety of problems that resulted in decreased performance of the regional development. The main problems that should receive more attention are: infrastructure, development growth, economic growth, transportation aspect and new properties.
This document discusses different aspects of surveys for urban and regional planning. It covers the necessity of surveys, data collection techniques, types of surveys including regional, town, functional, social, territorial and vital surveys. It also describes surveying techniques like self-surveys, interviews and direct inspections. The document discusses sample selection, types of samples including simple random, systematic, stratified and clustered. Finally, it notes potential errors in surveying like bias, measurement errors and missing answers.
Application of remote sensing,population identificationSATISH KUMAR
GIS
Remote Sensing
POPULATION IDENTIFICATION-REMOTE SENSING
Application of remote sensing
Statistical Modelling of Population
Dasymetric Mapping of Population
Cape cod example
Consideration of adjustments to density
GIS based electoral system provides efficient database and also be useful to enhance officials to conduct and manage elections. This research is aimed at using Geographic Information System based approach to monitoring election in Awka South L.G.A of Anambra State. The methodology employed in this research involves conversion of analogue map into digital map (through the process of scanning), georeferencing and digitizing, updating the study road map using Google Earth image. Other processes includes: Plotting of coordinate points, Geo-database creation and queries generations. GIS based mapping is one of the best techniques of depicting spatial data, the location the polling unit was depicted and it was noticed that there are no polling units located at around/within Ngozika and Udoka Housing units.
Interoperable and Distributed Processing in GIS to Sustain the Development of...Forokoro Kone
Since 1992, implement decentralization reformin Mali has made it possible to empower the populations in their own development planning. Resources distribution to local authorities requires detailed information of the constraints and the assets linked to their development. Data collected on the rural area are often poorly defined, redundant or incomplete and inefficiencies for sharing due to a lack of applied standard tools. The information is too descriptive and it is difficult to extract useful one for decision making process. There is inadequate information upon which to base resource allocation decisions. The purpose of this paper is to define data, that can be collected on rural municipalities or localities and handled by GIS to make information available to decision-makers, planners and beneficiaries. The data used from Malian poverty survey performed in 2001-2002 focused on the satisfaction of basic household needs. This concept is based on meeting those who lack access to basic living needs, which generally include clean water, sanitation, nutrition, primary health services, and basic education.The method used the platform of "MapGIS IGS, IIS6, Windows Server 2003, ASP.NET and MS SQL Server 2000" to develop an application GIS Web Service. Data areintegrated to the platform and published as services. The product outputhave been tested successfully on the intranet of Wuhan Zondy Cyber in the term of interoperability and extraction of the information needed.With this tool, each local authority can be a potential collector of his own data and participates to update the database. The Web Services model of the GIS systems described provides users with the services and data they need, without having to install, learn, or pay for any unused functionalities. The extension of this standardization in all ECOWAS countries would be a great advantage regarding the sharing of geographic information between countries.
Towards 'Resilient Cities' - Harmonisation of Spatial Planning Information as...Beniamino Murgante
Towards 'Resilient Cities' - Harmonisation of Spatial Planning Information as One Step Along the Way
Manfred Schrenk, Julia Neuschmid, Daniela Patti - Department for Urbanism, Transport, Environment and Information Society, Central European Institute of Technology, Austria
Smart City and Spatial Big Data -Studies and cases in Japan-Yuki Akiyama
1. The document discusses the use of micro geodata (MGD) for smart city applications in Japan. It provides examples of available MGD in Japan including building data, population census data, and mobile phone data.
2. Case studies presented utilize MGD for monitoring population distribution through micro population census, estimating disaster damage, and understanding traffic patterns by analyzing mobile phone GPS data.
3. The author argues that widespread use of digital maps and availability of detailed spatial data is increasing demand for more granular data. MGD is gaining attention for how it can be developed, shared and applied to realize smart cities.
This presentation uses the spatial analysis completed over the past year on 20 villages in Andhra Paradesh to demonstrate the effectiveness of mapping as a way of analysing and understanding factors that influence life-cycle costs and WASH service levels.
The document discusses maps and geographic information systems. It defines maps as any geographic image of the environment, including mental maps held solely in our minds. Traditionally, cartography focused on producing maps through scaling, generalization, symbolization and transformation. However, geographic information systems now provide capabilities for more sophisticated mapping and analysis by combining automated mapping with linkages that allow complex queries, overlays and spatial modeling. The document argues future systems should address more complex geographic problems and better communicate results using various methods.
Cyril Connolly, Lecturer, IADT, Dun Laoghaire: Visualising Road Accident Data Dublinked .
This document discusses the history and importance of data visualization. It provides examples of how the software DataDesk can be used to interactively explore and analyze Irish road accident data. Key points include: (1) DataDesk allows slicing and dicing of data through linked views, revealing patterns like regional differences in accident distributions. (2) Rotating plots can show relationships that emerge from entire datasets, like distinguishing clusters in accident profiles. (3) Interactive visualization brings statistics to life and aids decision making.
The International Journal of Engineering and Science (The IJES)theijes
The International Journal of Engineering & Science is aimed at providing a platform for researchers, engineers, scientists, or educators to publish their original research results, to exchange new ideas, to disseminate information in innovative designs, engineering experiences and technological skills. It is also the Journal's objective to promote engineering and technology education. All papers submitted to the Journal will be blind peer-reviewed. Only original articles will be published.
This document summarizes a study on controlling post-harvest bacterial diseases of tomatoes in Abia State, Nigeria. The study assessed the effects of pre-heat treatments and plant extracts on bacterial soft rot caused by Erwinia carotovora and fruit spot caused by Xanthomonas vesicatoria. Subjecting tomato fruits to 50°C for 10 minutes provided the longest shelf life and was most effective at controlling the diseases. Plant extracts from neem, bitter kola, ginger, black pepper, and nutmeg were also effective at inhibiting bacterial growth in vitro compared to untreated controls. Cold water extracts of neem, ginger, and black pepper inhibited bacterial growth the most.
The International Journal of Engineering and Science (The IJES)theijes
This document presents a study that uses time series analysis and ARIMA modeling to analyze historical data on the rate of influx of refugees into Kenya from 1993 to 2010 and forecast future refugee numbers. The study collected annual refugee influx data, analyzed it using autocorrelation and partial autocorrelation, fitted an appropriate ARIMA model, and used the model to forecast refugee numbers in Kenya. The goal was to help authorities plan responses to the increasing refugee burden.
The International Journal of Engineering and Science (The IJES)theijes
The International Journal of Engineering & Science is aimed at providing a platform for researchers, engineers, scientists, or educators to publish their original research results, to exchange new ideas, to disseminate information in innovative designs, engineering experiences and technological skills. It is also the Journal's objective to promote engineering and technology education. All papers submitted to the Journal will be blind peer-reviewed. Only original articles will be published.
The International Journal of Engineering and Science (The IJES)theijes
This document summarizes a study on the suitability of soils for irrigation under the command area of the Gomal Zam Dam Multipurpose Project in Pakistan. Soil samples from 85 locations were analyzed for their physical and chemical properties. It was found that 8.23% of the study area had highly suitable soils, 61.17% had moderately suitable soils, and 25.88% had marginally suitable soils. Some areas totaling 4.7% were unsuitable due to physical limitations like steep slopes or stones. The chemical factors of salinity and lime content were generally not limiting. Maps were produced showing the classification of different soil parameters and overall land suitability classes. Ridge planting and salt-tolerant crops were recommended
The International Journal of Engineering and Science (The IJES)theijes
The study analyzed 80 milk samples from cows, buffaloes, goats and sheep to evaluate factors affecting milk composition. The average fat, protein and lactose contents varied between species. Values differed from standards due to season, nutrition, lactation stage. Early lactation saw lower fat and protein but higher lactose. Late lactation had higher fat and protein but lower lactose. Winter milk had lower lactose but higher protein than summer. Feeding and lactation stage also impacted composition but disease reduced all constituents. Season and breed influenced composition the most.
The International Journal of Engineering and Science (The IJES)theijes
This document summarizes the effects of scaling on the operation of a low voltage operational transconductance amplifier (OTA) in different CMOS process technologies. It describes the design of a single output OTA topology that uses a minimal number of transistors between the supply voltage and ground to operate at low voltages. Simulation results show that scaling to smaller feature sizes (90nm vs 180nm vs 350nm) increases the OTA's bandwidth, transconductance, and stability while reducing total harmonic distortion and power dissipation. Scaling allows higher frequency operation and lower power consumption in analog circuits like OTAs.
The International Journal of Engineering and Science (The IJES)theijes
The International Journal of Engineering & Science is aimed at providing a platform for researchers, engineers, scientists, or educators to publish their original research results, to exchange new ideas, to disseminate information in innovative designs, engineering experiences and technological skills. It is also the Journal's objective to promote engineering and technology education. All papers submitted to the Journal will be blind peer-reviewed. Only original articles will be published.
The International Journal of Engineering and Science (The IJES)theijes
The International Journal of Engineering & Science is aimed at providing a platform for researchers, engineers, scientists, or educators to publish their original research results, to exchange new ideas, to disseminate information in innovative designs, engineering experiences and technological skills. It is also the Journal's objective to promote engineering and technology education. All papers submitted to the Journal will be blind peer-reviewed. Only original articles will be published.
The papers for publication in The International Journal of Engineering& Science are selected through rigorous peer reviews to ensure originality, timeliness, relevance, and readability
The International Journal of Engineering and Science (The IJES)theijes
The International Journal of Engineering & Science is aimed at providing a platform for researchers, engineers, scientists, or educators to publish their original research results, to exchange new ideas, to disseminate information in innovative designs, engineering experiences and technological skills. It is also the Journal's objective to promote engineering and technology education. All papers submitted to the Journal will be blind peer-reviewed. Only original articles will be published.
This document summarizes a study on using spinach plants to remove copper and iron from polluted water through rhizofilteration and phytoextraction. The study involved planting spinach in pots with synthetic wastewater containing different concentrations of copper and iron over various time periods. The results showed that spinach was highly effective at accumulating metals, removing 86.5% of copper and 85.9% of iron from the water through rhizofilteration. The highest accumulation of metals occurred in the spinach leaves rather than the roots or stems. In conclusion, the study demonstrates that spinach is a good candidate for phytoremediation of copper and iron pollution from water.
Lightning Talk #9: How UX and Data Storytelling Can Shape Policy by Mika Aldabaux singapore
How can we take UX and Data Storytelling out of the tech context and use them to change the way government behaves?
Showcasing the truth is the highest goal of data storytelling. Because the design of a chart can affect the interpretation of data in a major way, one must wield visual tools with care and deliberation. Using quantitative facts to evoke an emotional response is best achieved with the combination of UX and data storytelling.
This report summarizes a survey of the Taluka Sports Complex in Paithan using Google Earth and GPS. The sports complex was established in 2007 and contains facilities for tennis, football, gymnastics, boxing, squash, and cricket. The total land area is 1.48 acres. GPS was used to obtain latitude and longitude coordinates at 4 points around the complex. When compared to the Google Earth coordinates, small differences of up to 3 meters were found at some points, likely due to GPS or Google Earth inaccuracies. The report concludes that there can be slight differences between coordinates from online maps versus physical measurements.
The Mapping Revolution: Incorporating Geographic Information Systems in Gover...GovLoop
Since the beginning of civilization, humans have used images as a means to tell stories. We have used images to educate, entertain or to build a just and moral society. Our ancient ancestors would use images to remember stories and archive information for future generations. Similar to our ancient ancestors, we use images today to convey meaning, understand complex relationships and improve communication.
The use of mapping and geospatial technology is at the heart of story telling and improved communications. As the challenges of the public sector continue to grow in complexity, efficient and effective communication tools are essential. Today, government is more interconnected than ever before, and the complexity has led to increased integration between state, local and federal officials. At all levels of government, agencies are looking for solutions to find value and improve public sector decision-making through data. http://www.govloop.com/profiles/blogs/govloop-guide-the-mapping-revolution-incorporating-geographic-inf
An Empirical Study of the Geospatial Availability of Hospitals in Imo East us...ijtsrd
The accessibility of hospital facilities contributes to social stability and the protection of the fundamental human right to health care. This study aimed to examine the geographical distribution of hospital care facilities and their attribute information in the nine Local Government Areas LGA of the Imo East District by developing a database and producing a visual map of these facilities. The facilities investigated were divided into different groups by type, ownership, and operational state. The attribute data that makes up the database was obtained through questionnaires distributed to facility management. Geospatial data was collected using a handheld Global Positioning System GPS . The maps received from the government agencies integrated with the ArcGIS environment were used for the visual mapping of the facilities. Statistical Package for the Social Sciences SPSS was used to analyze the data. The results suggest that there are 837 health facilities, with Ahiazu and Ezinihitte having the fewest 8.1 and 8.5 , respectively , and Ngor Okpala having the most sparsely distributed. The areas with the most facilities are Aboh and Ikeduru, with 13.3 and 13.0 , respectively. The ownership of private and public facilities was 59.3 and 40.7 , respectively. The facilities are not evenly dispersed, and their standards vary substantially. The database created would surely aid in management, planning, and encouraging new avenues in health administration. The visual map produced illustrates the locations of health institutions, and road connectivity by type, and is an essential source of health information. The visual map available to the public can increase the number of patients who travel to the proper hospitals and prevent patients from seeking health treatment in the wrong place. As a result, the findings of this study may aid in the administration of health facilities and future planning. Umunnakwe George E. | Obasi Ibe B. "An Empirical Study of the Geospatial Availability of Hospitals in Imo East using GPS Mapping" Published in International Journal of Trend in Scientific Research and Development (ijtsrd), ISSN: 2456-6470, Volume-7 | Issue-3 , June 2023, URL: https://www.ijtsrd.com.com/papers/ijtsrd56325.pdf Paper URL: https://www.ijtsrd.com.com/other-scientific-research-area/other/56325/an-empirical-study-of-the-geospatial-availability-of-hospitals-in-imo-east-using-gps-mapping/umunnakwe-george-e
Building spatial database for cuttack municipal corporation a geospatial tech...eSAT Journals
1) The document describes a study that aimed to build a spatial database for Cuttack Municipal Corporation in Odisha, India using geospatial technologies.
2) Spatial and non-spatial data from multiple sources was acquired and integrated to create the database, addressing errors in existing data.
3) Geospatial tools including remote sensing, GIS and GPS were used to generate an accurate, common geo-database for planning and implementing social welfare schemes. Ground control points and satellite imagery helped improve spatial accuracy.
3. A SPATIAL ANALYSIS OF RESIDENTIAL LAND VALUES IN KAITHALDr. Ravinder Jangra
This document analyzes residential land values in Kaithal City, India from 1971-2014. It compares the collector rate (set by authorities) to actual market rates collected through surveys. GIS tools like inverse distance weighting and buffer analysis were used to map land values spatially. Higher values were found in newer planned sectors developed by government agencies in the northeast, as well as a private development, due to their location, amenities, and access. The study aims to understand urban expansion and identify gaps between official and real residential land rates. Remotely sensed imagery from 1971-2010 was used to map the city's growth over time.
There have been two main categories of research on mining moving object data: moving object cluster discovery and trajectory clustering. Moving object clustering identifies groups of objects that travel together without defined locations, while trajectory clustering groups locations based on similar object movements but ignores traveling time. Recent studies have proposed concepts like temporal moving object swarms that capture objects moving within non-consecutive time-based clusters, and probabilistic modeling of trajectory sets to identify common paths between trajectories. Future work could focus on clustering algorithms that integrate both location and time dimensions to better characterize moving object behaviors.
This document provides an overview of geographic information systems (GIS) and how GIS is used across many industries and fields. It begins with an introduction to GIS and how GIS links geographic data to other information. The document then describes how GIS is used in business, defense, government, natural resources, transportation, utilities and more. It provides examples of how GIS helps with tasks like facilities management, marketing, emergency response and more. The document aims to demonstrate how location matters to decision making and that GIS is a tool that can help organizations in many sectors.
The series of presentations contains the information about "Management Information System" subject of SEIT for University of Pune.
Subject Teacher: Tushar B Kute (Sandip Institute of Technology and Research Centre, Nashik)
http://www.tusharkute.com
Geographic Information Systems PowerPoint Summer 2014 SemesterNicholas Tancredi
A geographic information system (GIS) is a computer system for managing geographic data and attribute data. GIS uses two types of data: raster data which uses cells to create images like satellite photos, and vector data which uses points, lines, and polygons to create maps of things like roads and city boundaries. While creating spatial data for GIS can be expensive, organizations make some data freely available online. GIS allows examination of data at different geographic areas and is useful for tasks like property analysis and program planning and evaluation.
Using Data-Mining Technique for Census Analysis to Give Geo-Spatial Distribut...IOSR Journals
This document discusses using data mining techniques to analyze census data and provide geographic distributions of populations in Nigeria. It specifically uses a decision tree algorithm to predict attributes of populations like number of males/females, employment status, etc. from census databases. It then integrates these predictions with a geographic information system to display the geo-spatial distributions on maps. The results showed this approach was able to successfully extract predictive attributes from census data and provide geographic distributions to help inform business and government decisions. It recommends future work address overfitting issues and better handling of continuous attributes.
This document discusses population projection methods for Surat city and surrounding areas in India. It analyzed population data from the past several censuses at the constituency level, which includes 102 wards in Surat Municipal Corporation and 95 surrounding villages. Five different mathematical methods were used to project the population for 2021, 2031, and 2041. The Ratio and Correlation Method (RCM) was found to provide projections that were centered among the other methods. This method grouped constituencies based on growth rates and densities and applied restrictions. The document recommends using the RCM to project Surat's future population given its consideration of local development factors influencing population changes.
The document discusses how GIS is used across multiple disciplines including archaeology, economics, biology/ecology, political science, public administration, nursing/health, geology, history, environmental studies, engineering, and geography. GIS provides spatial analysis and mapping capabilities that help researchers, policymakers, and organizations understand patterns and make informed decisions in their respective fields.
The document discusses how Honolulu, Hawaii is using 3D modeling and GIS to plan for an elevated rail system and transit-oriented development (TOD). Three core models were created - walkability, urban growth, and densification. Esri CityEngine was used to develop 3D geometry and textures of the proposed rail corridor and TOD. Holograms were also created from the 3D models to provide unique views for stakeholders and the public to communicate how the changes could positively impact the community by controlling urban sprawl and reducing traffic. The goal was to build support for the rail project and TOD approach through collaborative planning and visualization tools.
Creation of Cadastral Information System for Staff Quarters in Covenant Unive...AI Publications
This document describes the creation of a digital cadastral information system for staff quarters at Covenant University in Ota, Ogun State, Nigeria. Spatial and attribute data were collected through field surveys using GPS and from university records. The spatial data was plotted in AutoCAD and exported to ArcGIS to create feature classes. An attribute database was built by linking parcel information to the spatial features. Queries were run on the spatial and attribute data to analyze patterns in parcel area, building type, occupancy, and more. The results were maps and a composite map showing the existing allocation of plots and parcels. The digital cadastre provides detailed parcel characteristics, buildings, and owners to improve land administration and planning at the university.
An Overview of the Functions of Abuja Geographic Information System (AGIS) As...iosrjce
IOSR Journal of Environmental Science, Toxicology and Food Technology (IOSR-JESTFT) multidisciplinary peer-reviewed Journal with reputable academics and experts as board member. IOSR-JESTFT is designed for the prompt publication of peer-reviewed articles in all areas of subject. The journal articles will be accessed freely online
The document discusses Community Analyst, a web application that provides detailed demographic, economic, consumer behavior, and business data for analyzing small geographic areas like census blocks and tracts. It can be used to understand consumer preferences and spending patterns, identify areas of need or opportunity, and access current and forecasted data. The application includes maps, imagery, reports, and analytics to help users make better decisions regarding business development and community impact in McDonough, Georgia.
This document provides an overview of geographic information systems (GIS) and their applications in civil engineering, the environment, and natural resource management. It discusses how GIS integrates data from various sources and disciplines to store, manipulate, analyze, and display spatial information. GIS has become an important tool for tasks like infrastructure and urban planning, natural resource management, and disaster mitigation by allowing users to query data, find optimal routes, and better understand spatial relationships. The document also covers GIS components like maps, coordinate systems, software, and how various fields contributed to the development of GIS technology.
Authoritative and Volunteered Geographical Information in a Developing Countr...rsmahabir
This document compares authoritative and volunteered (VGI) road datasets in Nairobi, Kenya. It finds that the authoritative dataset from RCMRD provided the most complete coverage of the entire study area, though it was less current. OSM had higher coverage in large slums, surpassing authoritative datasets, while Google Map Maker showed better coverage in rural housing areas. Population density was found to correlate with higher road coverage by VGI sources. Overall, VGI shows potential to supplement gaps in authoritative data in developing countries.
Introduction to GIS and its Applications.pptxalphamale15
This document provides an introduction to geographic information systems (GIS). It defines GIS as a computer system for collecting, storing, manipulating, analyzing, displaying, and querying geographically related information. The document outlines the key components of a GIS, including its data, software, hardware, people and procedures. It also discusses GIS capabilities like spatial analysis and applications in areas such as natural resource management, facilities management, and land use planning.
Similar to The International Journal of Engineering and Science (The IJES) (20)
AI-Powered Food Delivery Transforming App Development in Saudi Arabia.pdfTechgropse Pvt.Ltd.
In this blog post, we'll delve into the intersection of AI and app development in Saudi Arabia, focusing on the food delivery sector. We'll explore how AI is revolutionizing the way Saudi consumers order food, how restaurants manage their operations, and how delivery partners navigate the bustling streets of cities like Riyadh, Jeddah, and Dammam. Through real-world case studies, we'll showcase how leading Saudi food delivery apps are leveraging AI to redefine convenience, personalization, and efficiency.
AI 101: An Introduction to the Basics and Impact of Artificial IntelligenceIndexBug
Imagine a world where machines not only perform tasks but also learn, adapt, and make decisions. This is the promise of Artificial Intelligence (AI), a technology that's not just enhancing our lives but revolutionizing entire industries.
Driving Business Innovation: Latest Generative AI Advancements & Success StorySafe Software
Are you ready to revolutionize how you handle data? Join us for a webinar where we’ll bring you up to speed with the latest advancements in Generative AI technology and discover how leveraging FME with tools from giants like Google Gemini, Amazon, and Microsoft OpenAI can supercharge your workflow efficiency.
During the hour, we’ll take you through:
Guest Speaker Segment with Hannah Barrington: Dive into the world of dynamic real estate marketing with Hannah, the Marketing Manager at Workspace Group. Hear firsthand how their team generates engaging descriptions for thousands of office units by integrating diverse data sources—from PDF floorplans to web pages—using FME transformers, like OpenAIVisionConnector and AnthropicVisionConnector. This use case will show you how GenAI can streamline content creation for marketing across the board.
Ollama Use Case: Learn how Scenario Specialist Dmitri Bagh has utilized Ollama within FME to input data, create custom models, and enhance security protocols. This segment will include demos to illustrate the full capabilities of FME in AI-driven processes.
Custom AI Models: Discover how to leverage FME to build personalized AI models using your data. Whether it’s populating a model with local data for added security or integrating public AI tools, find out how FME facilitates a versatile and secure approach to AI.
We’ll wrap up with a live Q&A session where you can engage with our experts on your specific use cases, and learn more about optimizing your data workflows with AI.
This webinar is ideal for professionals seeking to harness the power of AI within their data management systems while ensuring high levels of customization and security. Whether you're a novice or an expert, gain actionable insights and strategies to elevate your data processes. Join us to see how FME and AI can revolutionize how you work with data!
Building Production Ready Search Pipelines with Spark and MilvusZilliz
Spark is the widely used ETL tool for processing, indexing and ingesting data to serving stack for search. Milvus is the production-ready open-source vector database. In this talk we will show how to use Spark to process unstructured data to extract vector representations, and push the vectors to Milvus vector database for search serving.
Unlock the Future of Search with MongoDB Atlas_ Vector Search Unleashed.pdfMalak Abu Hammad
Discover how MongoDB Atlas and vector search technology can revolutionize your application's search capabilities. This comprehensive presentation covers:
* What is Vector Search?
* Importance and benefits of vector search
* Practical use cases across various industries
* Step-by-step implementation guide
* Live demos with code snippets
* Enhancing LLM capabilities with vector search
* Best practices and optimization strategies
Perfect for developers, AI enthusiasts, and tech leaders. Learn how to leverage MongoDB Atlas to deliver highly relevant, context-aware search results, transforming your data retrieval process. Stay ahead in tech innovation and maximize the potential of your applications.
#MongoDB #VectorSearch #AI #SemanticSearch #TechInnovation #DataScience #LLM #MachineLearning #SearchTechnology
Things to Consider When Choosing a Website Developer for your Website | FODUUFODUU
Choosing the right website developer is crucial for your business. This article covers essential factors to consider, including experience, portfolio, technical skills, communication, pricing, reputation & reviews, cost and budget considerations and post-launch support. Make an informed decision to ensure your website meets your business goals.
GraphRAG for Life Science to increase LLM accuracyTomaz Bratanic
GraphRAG for life science domain, where you retriever information from biomedical knowledge graphs using LLMs to increase the accuracy and performance of generated answers
CAKE: Sharing Slices of Confidential Data on BlockchainClaudio Di Ciccio
Presented at the CAiSE 2024 Forum, Intelligent Information Systems, June 6th, Limassol, Cyprus.
Synopsis: Cooperative information systems typically involve various entities in a collaborative process within a distributed environment. Blockchain technology offers a mechanism for automating such processes, even when only partial trust exists among participants. The data stored on the blockchain is replicated across all nodes in the network, ensuring accessibility to all participants. While this aspect facilitates traceability, integrity, and persistence, it poses challenges for adopting public blockchains in enterprise settings due to confidentiality issues. In this paper, we present a software tool named Control Access via Key Encryption (CAKE), designed to ensure data confidentiality in scenarios involving public blockchains. After outlining its core components and functionalities, we showcase the application of CAKE in the context of a real-world cyber-security project within the logistics domain.
Paper: https://doi.org/10.1007/978-3-031-61000-4_16
Cosa hanno in comune un mattoncino Lego e la backdoor XZ?Speck&Tech
ABSTRACT: A prima vista, un mattoncino Lego e la backdoor XZ potrebbero avere in comune il fatto di essere entrambi blocchi di costruzione, o dipendenze di progetti creativi e software. La realtà è che un mattoncino Lego e il caso della backdoor XZ hanno molto di più di tutto ciò in comune.
Partecipate alla presentazione per immergervi in una storia di interoperabilità, standard e formati aperti, per poi discutere del ruolo importante che i contributori hanno in una comunità open source sostenibile.
BIO: Sostenitrice del software libero e dei formati standard e aperti. È stata un membro attivo dei progetti Fedora e openSUSE e ha co-fondato l'Associazione LibreItalia dove è stata coinvolta in diversi eventi, migrazioni e formazione relativi a LibreOffice. In precedenza ha lavorato a migrazioni e corsi di formazione su LibreOffice per diverse amministrazioni pubbliche e privati. Da gennaio 2020 lavora in SUSE come Software Release Engineer per Uyuni e SUSE Manager e quando non segue la sua passione per i computer e per Geeko coltiva la sua curiosità per l'astronomia (da cui deriva il suo nickname deneb_alpha).
OpenID AuthZEN Interop Read Out - AuthorizationDavid Brossard
During Identiverse 2024 and EIC 2024, members of the OpenID AuthZEN WG got together and demoed their authorization endpoints conforming to the AuthZEN API
TrustArc Webinar - 2024 Global Privacy SurveyTrustArc
How does your privacy program stack up against your peers? What challenges are privacy teams tackling and prioritizing in 2024?
In the fifth annual Global Privacy Benchmarks Survey, we asked over 1,800 global privacy professionals and business executives to share their perspectives on the current state of privacy inside and outside of their organizations. This year’s report focused on emerging areas of importance for privacy and compliance professionals, including considerations and implications of Artificial Intelligence (AI) technologies, building brand trust, and different approaches for achieving higher privacy competence scores.
See how organizational priorities and strategic approaches to data security and privacy are evolving around the globe.
This webinar will review:
- The top 10 privacy insights from the fifth annual Global Privacy Benchmarks Survey
- The top challenges for privacy leaders, practitioners, and organizations in 2024
- Key themes to consider in developing and maintaining your privacy program
Best 20 SEO Techniques To Improve Website Visibility In SERPPixlogix Infotech
Boost your website's visibility with proven SEO techniques! Our latest blog dives into essential strategies to enhance your online presence, increase traffic, and rank higher on search engines. From keyword optimization to quality content creation, learn how to make your site stand out in the crowded digital landscape. Discover actionable tips and expert insights to elevate your SEO game.
How to Get CNIC Information System with Paksim Ga.pptxdanishmna97
Pakdata Cf is a groundbreaking system designed to streamline and facilitate access to CNIC information. This innovative platform leverages advanced technology to provide users with efficient and secure access to their CNIC details.
Ocean lotus Threat actors project by John Sitima 2024 (1).pptxSitimaJohn
Ocean Lotus cyber threat actors represent a sophisticated, persistent, and politically motivated group that poses a significant risk to organizations and individuals in the Southeast Asian region. Their continuous evolution and adaptability underscore the need for robust cybersecurity measures and international cooperation to identify and mitigate the threats posed by such advanced persistent threat groups.
Taking AI to the Next Level in Manufacturing.pdfssuserfac0301
Read Taking AI to the Next Level in Manufacturing to gain insights on AI adoption in the manufacturing industry, such as:
1. How quickly AI is being implemented in manufacturing.
2. Which barriers stand in the way of AI adoption.
3. How data quality and governance form the backbone of AI.
4. Organizational processes and structures that may inhibit effective AI adoption.
6. Ideas and approaches to help build your organization's AI strategy.
Removing Uninteresting Bytes in Software FuzzingAftab Hussain
Imagine a world where software fuzzing, the process of mutating bytes in test seeds to uncover hidden and erroneous program behaviors, becomes faster and more effective. A lot depends on the initial seeds, which can significantly dictate the trajectory of a fuzzing campaign, particularly in terms of how long it takes to uncover interesting behaviour in your code. We introduce DIAR, a technique designed to speedup fuzzing campaigns by pinpointing and eliminating those uninteresting bytes in the seeds. Picture this: instead of wasting valuable resources on meaningless mutations in large, bloated seeds, DIAR removes the unnecessary bytes, streamlining the entire process.
In this work, we equipped AFL, a popular fuzzer, with DIAR and examined two critical Linux libraries -- Libxml's xmllint, a tool for parsing xml documents, and Binutil's readelf, an essential debugging and security analysis command-line tool used to display detailed information about ELF (Executable and Linkable Format). Our preliminary results show that AFL+DIAR does not only discover new paths more quickly but also achieves higher coverage overall. This work thus showcases how starting with lean and optimized seeds can lead to faster, more comprehensive fuzzing campaigns -- and DIAR helps you find such seeds.
- These are slides of the talk given at IEEE International Conference on Software Testing Verification and Validation Workshop, ICSTW 2022.
The International Journal of Engineering and Science (The IJES)
1. The International Journal Of Engineering And Science (IJES)
||Volume||2 ||Issue|| 7||Pages|| 25-29||2013||
ISSN(e): 2319 – 1813 ISSN(p): 2319 – 1805
www.theijes.com The IJES Page 25
Utilization of Geographic Information System (Gis) In
Demographic Analysis Of Census Data In Awka Metropolis In
Anambra State, Nigeria
BY
*Ogochukwu C. Okeke and **Prof.H,C Inyiama
*Anambra State University Uli, Nigeria
**Nnamdi Azikiwe University Awka Anambra State, Nigeria
-------------------------------------------------------ABSTRACT---------------------------------------------------
When inference is desired regarding some attribute of a particular geographic region, it often happens that data
are not directly available for that region. However, it may be that data are available over the same general
area, but reported according to a different set of regional boundaries. Recently, powerful computer programs
called geographic information systems (GIS’s) have enabled the simultaneous display of such “misaligned”
data sets. Today, there is a huge amount of data gathered about census and its analysis is not critically done
well to bring out some basic and important attributes of the census data. This is usually due to non-availability
of the required tools in carrying out that and doing that manually is very cumbersome and tedious. In order to
take care of these lapses have necessitated this research work on the utilization of GIS in demographic analysis
of census data in Awka metropolis in Anambra state, Nigeria This work focuses on census data from two most
recent consecutive censuses conducted between 1991 and 2006. In Anambra state Nigeria, there is always a
problem of census enumeration because tools that would help to get actual figures which will help government
and individuals in tactful and strategic planning .This software geographic information system (GIS) would help
to solve the disturbing problem. The population density map was developed using dot density where each dot
represents a population. The output of this is a functional geo-spatial distribution of a population in Awka
metropolis.
KEYWORDS: Demography, GIS ,Census
-------------------------------------------------------------------------------------------------------------------------------------
Date of Submission:18 July 2013 Date of Publication:7 ,Aug ,2013
-------------------------------------------------------------------------------------------------------------------------------------
I. INTRODUCTION
Census analysis is often not critically analyzed to bring out some of the basic and important attributes
of census data information (Okeke, 2013). This is usually due to non-availability of the required tools for
carrying out such analysis. This research work suggests the use of geographical information system (GIS) as an
integrating technology that gives geo-spatial distribution of the population. Information on population growth
and landscape change are critical among decision makers, planners, and local land users who rely on such
information to assess the physical extent, characteristics, and consequences of past and future population
development.
The geographical information system (GIS) is very important for sustainability and economic growth in
consideration of population distribution of an area. It is a computer-based tool for mapping and analyzing
features and events on earth. GIS technology integrates common database operations, such as query and
statistical analysis with maps (Shahab, 2008). GIS manages location-based information and provides tools for
display and analysis of various statistics, including population characteristics, economic development
opportunities and vegetation types ((Rushton, Elmes and McMaster, 2000)). GIS allows someone to link
databases and maps to create dynamic displays (Shahab, 2008). Additionally, it provides tools to visualize,
query, and overlay those databases relating to census enumeration in many ways not possible with traditional
spreadsheets (Shahab, 2008). Geographic information research and technologies have experienced over four
decades of development, from the mainframe to the workstation to the desktop, and to today’s laptop and mobile
devices. Every important GIS development is driven by a significant breakthrough of mainstream information
technology.
2. Utilization Of Geographic Information System…
www.theijes.com The IJES Page 26
For example, the 1980s was characterized by the popularity of personal computers that were
increasingly becoming affordable to university departments, governmental agencies and private sectors The ever
increasingly urbanized world has created various problems of environment, climate, consumption of resources,
and public health, which are closely linked to the side-effects of urbanization such as sprawl, congestion,
housing affordability and loss of open space. These problems need to be addressed at various levels of spatial
planning and decision making. For instance, in urbanization management, special and specific consideration
should be given to the relationships between land use, transportation, and the environment. GIS offers the power
to integrate biophysical and socio-economic data, which can help to understand the forces driving urban growth
and development .GIS is highly dependent upon other existing sources of data, particularly the census datasets.
A GIS leverages the flexibility of geographic data. Raw data are static (non- changing) and offer only a limited
amount of flexibility on real-world applications. When raw data are transformed to geographic data through a
GIS, the capability for enhanced data use and analysis (i.e., data flexibility) significantly increases. At a
minimum, overlaying two geographic data sources provides sufficient new information, better analytical means,
and additional flexibility to not only helps someone visualize the real world but also helps them make an
informed decision (Galati, 2006).Geographic information system is defined as a system for capturing, storing,
checking, integrating, manipulating, analyzing, and displaying data which are spatially referenced to the
earth.(Shahab,2008).Geographic information system needs spatial data, this makes it unique. Here spatial means
–related to the real world location. That is why GIS is based on geographic concepts Moreover census figures
are not always accurate in Nigeria, and some people in the towns will be counted while others would not, some
people would be employed while others would not and some states are more marginalized than others, why is it
that you must vote where you register only, all these questions will be answered only when accurate and
standard census process is being taken using geographic information system (GIS) (Okeke, 2013).
A population and housing census is of great relevance to the economics, political and socio-cultural
planning of a country. Reliable and detailed data on the size, structure, distribution and socio-economic and
demographic characteristics of a country’s population is required for planning, policy intervention and
monitoring of development goals (Census Enumerator’s Manual, 2006). A population census is the major source
of data. The housing condition of the population provides a reliable indicator of citizen’s well being.
Information on housing is dispensable to planers and policy makers in evaluating housing conditions, estimating
housing needs and formulating housing policies. Most countries of the world conduct population and economic
censuses at regular intervals. Population census information is of great value in planning public services for
governments at all levels, such as cities, counties, provinces, and states. Both population and economic census
data are also used by private companies or community organizations for various purposes, such as marketing
studies, situating new factories or shopping malls, developing social service programs.
The United Nation (UN) defines census as total as total process of collecting compiling, analyzing,
evaluating, publishing and disseminating demographic economic, social and housing data pertaining at a
specified time to all persons and all building in a country or in a well delineated part (Census Enumerator’s
Manual, 2006). By definition therefore, the essential features of a population and housing census require that
each individual person and each building is enumerated separately and only once and that the census operation
is confined to a well defined territory and reference period.Arnett (2005) defines census as a periodic count of
the population. It is the process of obtaining information about every member for a population (not necessarily a
human population). It can be contrasted with sampling in which information is only obtained from a subset of a
population. As such it is a method used for accumulating statistical data, and also it is also it is vital
democratically. The counting or listing of a certain region is done by a census enumerator commonly on a
federal or state basis.
Nigeria has had a long history of census talking. The first census was in 1866. The censuses of censuses of 1866,
1871, 1896, were restricted to Lagos Island and parts of Lagos Mainland. The censuses of 1901, 1911 and 1921
covered, in addition to Lagos a few more urban towns in the colony. Most of these censuses were actually
population estimates. Although the census of 1952/53 was elaborate in organization, its non-simultaneity, which
has implications for possible double counting is considered its weak points.The first post independence census
in Nigeria was carried out in 1962. This was out rightly cancelled and another conducted in 1963. The 1963
census results became the official figured and was used until the 1991 census was accepted. There was a census
in 1973 but the results were declared unacceptable on account of massive inaccuracies. The 1991 census broke
the myth of failed censuses in Nigeria. Also 2006 Nigeria had their last census, though many several uses to a
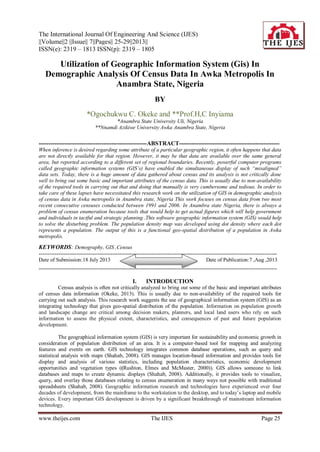
3. Utilization Of Geographic Information System…
www.theijes.com The IJES Page 27
nation. It provides the total characteristics in every town, village or /and locality. This information
provides data for planning programmers in education, health, housing and other social services at all levels of
governance. In addition to its use by government, information derived from census helps business/private sector
to plan their activities. Then it is the objectives of this research work to develop a census density map of Awka
metropolis in Anambra state Nigeria using dot density and to develop different geographic information system
of different maps showing different attributes of population like map of 2006 population, map 1991 population,
map of age distribution of Awka metropolis, map of roads in Awka metropolis and population density of each ,
all these attributes of population appears in layers which helps government in planning and good decision
making (Okeke,2013).Demography is the statistical study of human population
(https://en.wikipedia.org/wiki/Demography). It can be a very general science that can be applied to any kind of
dynamic living population. It is also study of human population on their size, composition and migration are the
big three of demography jointly producing population stability,Development of Awka metropolis map in
Anambra state Nigeria was done by transforming digitized map into geographic information system software,
the map features were measured starting from left hand side of the map, and horizontal and vertical axis were
taken (Okeke, 2013).The output from scanned map is often used to generate vector data. This involves
automatic or user controlled raster to vector conversion. The resolution of scanned map is very important
because it affects the generalization of features in the map (Shahab, 2008).
II. RESULTS
In comparison to the present system, the new system will be less time consuming and is more efficient
since map of Awka metropolis (Awka north and Awka south) will be shown in layers indicating population
density (population density is the population per unit area) of a particular area like that of Nise, Mgbaukwu,
Okpuno, Oba-efemili, Mbaukwu, Amawbia, Awka, Nibo, Umuawulu, Urum, Amanuke, Isiagu, Amansea,
Ebenebe, Isuanaocha, Ugbenu, Ugbene, Achalla, age distributions of certain age limit like 0-9years to be
children, 10-20 years to be adolescent,21-35 years to be early adults, 36-70 years to be late adults ,71- 99years
to be old adult and 100 and above to be aged, Towns in Awka south and north local government are Nise,
Mgbaukwu, Okpuno, Oba-efemili, Mbaukwu, Amawbia, Awka, Nibo, Umuawulu, Urum, Amanuke, Isiagu,
Amansea, Ebenebe, Isuanaocha, Ugbenu, Ugbene, Achalla,, Buildings, number of males, number of females,
Roads and total number of population. Census analysis will be very easy in the new system as it is automated
which will help government to be proactive in planning and in decision making.
The output of this paper is functional geo-spatial distribution of population in Awka metropolis in Anambra state,
Nigeria. As shown below
Figure 1.1 Awka metropolis map showing 1991 Census figures using dot density.
4. Utilization Of Geographic Information System…
www.theijes.com The IJES Page 28
Figure 1.2 Awka metropolis map showing 2006 Census figures using dot density.
Figure 1.3 Awka metropolis map showing all the eighteen towns in it.
Figure 1.4 Awka metropolis map showing 2006 population density of each town.
5. Utilization Of Geographic Information System…
www.theijes.com The IJES Page 29
Figure 1.5 Awka metropolis map showing 1991 population density of each town.
III. SUMMARY
This research deals with the challenge of using geographic information system to capture census results
in Awka metropolis .Census density map of Awka metropolis was developed using dot density, since many
attributes are shown. The map of Awka metropolis together with their legend was displayed. Dot density was
used to represent distribution of population and buildings in the area. The old system was analyzed and its draw
backs were critically pointed out and new system dealt with problems in old system, which helps government to
be proactive in decision making.
IV. CONCLUSION
Overcount and undercount will be less likely to occur if people participatory in GIS are incorporated
into to the census and geospatial model. A correlation between census results and other data sources are more
likely to reduce data corruption and keep falsification to a minimum. Availability of census data assets in the
public domain available to everyone at any one time will put greater scrutiny on the data there by mounting
pressure on national population staff to do what is right by taking care that the data collected and released is
accurate.The field of GIS had a critical role to play in the use of geo-spatial data and information in national
developmental issues, like population and demography, resource management, environmental monitoring and
control, regional integration and international cooperation. However, when integrating GIS technology in the
development stage in any country , positive steps have to be taken by government and other stakeholders
involved in the development and promotion of GIS use for research, training and production of empirical data
for policy formulation at the local ,regional and national towards environmental monitoring and management,
resource management and developmental planning. With GIS as a tool for spatial data collation, processing,
storage, indexing, retrieval, analysis and communication, good demographic information about Awka
metropolis in Anambra state, Nigeria would be prepared.
REFERENCES
[1] Arnett, E,J (2005).Introduction to Humanities. Equity Ventures: Owerri.
[2] Census Enumerator’s Manual (2006).National Population Commission, Abuja, Nigeria.
[3] Ekechukwu,B.C ,Okeke,O.C.& Ekwonwunne, E (2012).GIS for Population and
[4] Demography in Nnewi Local Government Area of Anambra State, Nigeria.
[5] Proceedings Of international Conference on Research, Innovation and Sustainable.
[6] Development V0l1(14).
[7] Galati, S, R (2006).GIS Demystified Artech House, Inc, Norwood.
[8] Okeke O, C (2013).A dissertation on “Data-mining Model for Census Analysis with GIS.
[9] Shahab, F (2008). GIS Basics. New Age International Limited, Publishers: New Delhi.