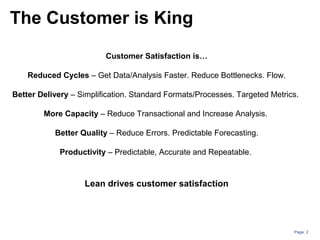
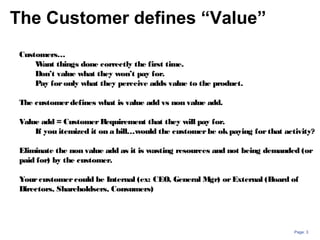
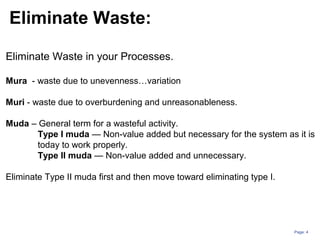
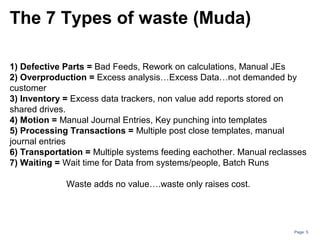
Lean Manufacturing:
A finance perspective
Fabio Malagisi
Page: 2
The Customer is King
Customer Satisfaction is…
Reduced Cycles – Get Data/Analysis Faster. Reduce Bottlenecks. Flow.
Better Delivery – Simplification. Standard Formats/Processes. Targeted Metrics.
More Capacity – Reduce Transactional and Increase Analysis.
Better Quality – Reduce Errors. Predictable Forecasting.
Productivity – Predictable, Accurate and Repeatable.
Lean drives customer satisfaction
Page: 3
Customers…
Want things done correctly the first time.
Don’t value what they won’t pay for.
Pay foronly what they perceive adds value to the product.
The customerdefines what is value add vs non value add.
Value add = CustomerRequirement that they will pay for.
If you itemized it on a bill…would the customerbe okpaying forthat activity?
Eliminate the non value add as it is wasting resources and not being demanded (or
paid for) by the customer.
Yourcustomercould be Internal (ex: CEO, General Mgr) orExternal (Board of
Directors, Shareholdsers, Consumers)
The Customer defines “Value”
Page: 4
Eliminate Waste in your Processes.
Mura - waste due to unevenness…variation
Muri - waste due to overburdening and unreasonableness.
Muda – General term for a wasteful activity.
Type I muda — Non-value added but necessary for the system as it is
today to work properly.
Type II muda — Non-value added and unnecessary.
Eliminate Type II muda first and then move toward eliminating type I.
Eliminate Waste:
Page: 5
1) Defective Parts = Bad Feeds, Rework on calculations, Manual JEs
2) Overproduction = Excess analysis…Excess Data…not demanded by
customer
3) Inventory = Excess data trackers, non value add reports stored on
shared drives.
4) Motion = Manual Journal Entries, Key punching into templates
5) Processing Transactions = Multiple post close templates, manual
journal entries
6) Transportation = Multiple systems feeding eachother. Manual reclasses
7) Waiting = Wait time for Data from systems/people, Batch Runs
Waste adds no value….waste only raises cost.
The 7 Types of waste (Muda)
Page: 6
Examples in finance:
An incorrect system feed
A manual journal entry to correct a booking
A PO mapped to the incorrect account
A report filled out with incorrect data
An incorrect version of a report taken off a shared drive
An excel formula error
A sub-ledger not tying out to a ledger
Outdated lookup tables or databases
Question every time a human needs to intervene!
Defective Parts
Page: 7
Examples in finance:
Extracting excess data that isn’t demanded by the customer
Producing reports “Just in case” someone asks
Downloading excess data into spreadsheets or databases
Measuring performance of factors that aren’t “demanded”
Excess reports/templates to support internal department meetings
Auditing/tracking without regard to materiality
Focus on the ability to react and produce Just in time
Overproduction
Page: 8
Examples in finance:
Multiple databases stored in excel/access
Everyone having their own personal “stocking” of data reports
Reports maintained that aren’t used...“Obsolete”/”Slow Moving”
Data produced at the wrong time…too early or too late
Unneeded offsite storage of records
Multiple people producing the same data reporting
Excess formats articulating the same data
Incomplete analysis
Data held in multiple locations requiring excess reconciliations
Inventory is a tool to hide problems…don’t allow problems to be hidden
Inventory
Examples in finance:
Unnecessary key punching
Running wasteful reports
Manual journal entries
Manual categorization of data for analysis
Reconciliations that aren’t material
Manual cross references
Unnecessary filing / printing
Unnecessary phone calls
Unnecessary update meetings/emails
Unnecessary manual reconciliations of systems
Eliminate unneeded physical activity that is wasteful and time consuming
Motion
Page: 10
Examples in finance:
Systems that don’t talk to each other
Errors due to lack of training/understanding
Rework due to changing of scope (lack of standardization)
System errors that need to be manually corrected
Multiple systems processing the same data in separate processes
Duplicate processing of data due to lack of coordination
Data integrity checks due to unreliable systems
Uncoordinated activities that need to be tracked
Approvals at the end of a process vs during the process.
Automation is critical to eliminating this waste.
Processing Transactions
Page: 11
Examples in finance:
Data that passes through multiple sub-ledgers and ledgers.
Transactions that get re-classed manually in a ledger
Data categorized multiple ways through multiple, separate lookup tables
Multiple templates pulling the same data
Unconnected databases that get updated separately
Reports that travel to multiple people for input
Excess systems that have to “talk” to one another
Unnecessary approval chains
Emailing files back and forth
Every step adds complexity and is an opportunity for a defect.
Transportation
Page: 12
Examples in finance:
Waiting for turn at shared resources (system log ins, spreadsheets etc)
Unbalanced flow…waiting for data from someone/something.
Waiting for a decisions
Waiting for review/approvals
Waiting for batch feeds to run
Waiting for feedback on a process
Idle time due to uncoordinated time zones and flow of data
Idle time due to uncoordinated timelines and due dates/expectations
Waiting takes away from our ability to add value through analysis.
Waiting
Page: 13
Waste = Any activity which absorbs resources but does not create value
(defined by customer…not you!)
Understanding waste helps us train ourselves to “see” waste when it
occurs
Relentlessly drive pursuit of perfect process to eliminate waste
Waste adds cost but does not add value as the customer is not willing
to pay for it
Waste summary
Page: 14
Common Muda Examples in Finance:
Uneven stress levels/Closing Crunch.
Too many manual journal entries. Equivalent to Rework.
Batch feeds. Wait time in closing process.
Uncoordinated functional inputs during forecasting efforts.
Redundant templates for analysis. How far is the data traveling?
Excess analysis due to lack of standard work.
Complicated spreadsheets. Not apparent what the message is.
Formula errors.
Page: 15
Lean is visual
Lean uses visual indicators to communicate simply and effectively.
The goal is to know what’s going on at any time, simply by seeing.
Visual Indicators can….
Prevent an error – Ex: Black out cells that shouldn’t be touched in a
spreadsheet.
Flag a defect or abnormality – Ex: cell turns red when a balance sheet doesn’t
balance
Communicates status – Ex: Output on track to plan and shows a green status.
Share information – Ex: Trend chart on order rates.
Examples
Conditional formatting in spreadsheets
Daily meeting boards
Status dashboards
Simplify spreadsheet and graphs
Error proof…add checks in formulas
Standard views and indicators
Color coding
Video vs written training/standard operating procedures
Page: 16
5S is critical to creating a visual system.
Sort – Easy access to data. Eliminate unneeded reports/data.
Set in Order – Organize data. Set Metrics and Control Limits.
Create the “Critical Few” and manage the outliers.
Shine – Continuously eliminate waste….Attack Data feed
issues, excess data, wait time etc.
Standardize – Std work, Std analysis, Std format, Std
schedule. Repeatable and accurate processes.
Sustain – Continuous flow of data analysis with process
controls (Visual Mgmt). Std work and repeatable processes.
Develop a “takt time” with daily routines.
5S – Starting a visual system
Page: 17
Define what is needed and get rid of what is unneeded.
• Pay attention to “aged WIP”. Half done analysis that is
driving clutter.
• Old/excess equipment.
• Outdated processes.
• Unneeded documents and email.
• Eliminate storage. Don’t allow things to build up again.
• Purge shared drives.
• Documents from former employees that are never looked at.
• How can people tag things that aren’t needed? What is
going to be your “red tag” method on data?
• Pay attention to document retention policies for compliance.
Sort
Page: 18
Organize what is needed. Put it in a logical place and make it
stand out when its not in its place.
• Location needs to be self explanatory
• Re-Label
• Color code common items
• Rename and Reorder
• Put files where they are functional…how will they be used and
when?
• Needs to be self evident…to all.
A place for everything and everything in its place.
Set in Order
Page: 19
Set controls and audit routines. Ensure you are sticking with the
program.
• Have a routine
• Check color coding, labeling etc
• Find abnormalities and clean them up
• Make it visual
• Make it mistake proof
• Fix deviations on the spot
Shine
Page: 20
Make 5S part of your standard work. Embrace it as how you
operate.
• You can’t fix anything until its stable.
• Communicate errors and defects so all can learn from it.
• Everyone should know what is normal and abnormal and
what the thresholds are.
• Define the routines. In a routine, abnormality sticks out more.
• Focus on scheduling and sequencing.
• Drive documentation. Document procedures and standards.
• Train everyone. Interchangeable processes not reliant on
specific people
• Anyone should be able to notice what the abnormality is.
Standardize
Page: 21
Keep sustainable processes in place. Don’t let things regress.
• Requires a discipline toward the process.
• Checklists to monitor compliance
• Rely on visual management to know what is going on.
• Reward positive momentum.
• Make it fun. Celebrate success
• Need a 360 degree feedback loop.
• Everyone must commit and reinforce. Mgmt at all levels.
• Accountability
• Continuous improvements…constantly challenge the status
quo
Sustain
Page: 22
TPS (Toyota Production System)
Considered the best practice and guide for a set of lean tools.
Page: 23
Establish stability despite erratic demand
Need to Level and Sequence our financial processes.
• Daily/Weekly/Hourly Standard Analysis vs Month/Qtr end Crunch.
• Continuous metrics vs ad hoc analysis.
• Forecasting built into your process vs qtrly. Assumptions tied out.
• Functional sequencing…Procurement, Commercial, Mktg, Mfg.
• No all nighters…..Daily routines.
Heijunka
Wk3 Wk4
Page: 24
Strive for Standard Work
Determine your quality standards and control limits
Standardize your processes. Do things consistently.
Document your work instructions and procedures.
Allow for flexibility across people. Process drives effectiveness.
Standardization allows abnormalities to be more noticeable.
Page: 25
• Kai – Change / Zen - continuous improvement
• Kaizen allows you to Implement and control processes….and
continuously improve them.
• Kaizen engages people in the lean effort
• Kaizen is essential to drive lean
• A kaizen event (1-5 days) is a focused dedicated event with the
goal to drive lean process improvements in a specified area.
1.Plan
2.Create a plan
3.Do
4.Try it out
5.Check
6.Examine
7.Act
8.Implement changes
Kaizen
Page: 26
• A Daily Rhythm of analysis
• No wait time on data.
• No Excess analysis…Simplification.
• Automation…feed templates. Reduce Key Punching and manual.
• Re-active analysis = Quality defect/rework.
• “Instant indicators”/ Performance Metrics create “flow”.
• Pull system – Customer triggers the activity vs pushing the activity onto
the customer.
Just In Time (JIT)
Provide customers what is needed, when its needed and the amount that is
needed.
Develop a Takt time and strive for continuous flow in your data.
Page: 27
Detect abnormality and stopping when abnormality is detected.
Jidoka
Process controls that allow for detection of abnormalities:
•Built in checks
•Control Limits on your data.
•Manage the outliers, not every piece of data.
•Process Controls drive compliance vs reactive audits.
•Build all critical activities into process…eliminate post analysis.
•Instant Indicators = Visual Management
•Quality on the front line – Don’t rely on approvals.
When it gets to a “quality inspector”…its too late.
Page: 28
From the Japanese, yokeru – to prevent, and poka – inadvertent errors
Simple visual methods which prevent mistakes from being made.
It’s visual…manage with your eyes.
Poka-Yoke the process to mistake proof your process.
Some Examples of Poka-Yoke
Conditional formatting in spreadsheets
Error proof…add checks in formulas
Color coding to relay sequencing information.
Audit checks that are visual.
Blacking out cells that shouldn’t be input into.
Protecting cells.
Trend charts with control limits
Poka-Yoke
Page: 29
Quality at the source
A “mistake” is caught at the source….a “defect” is a mistake that
moves on to the next step in the process
Mistake proof your processes and don’t allow a mistake to become
a defect.
Strive for quality at the source vs relying on auditors, manager
approvals,
Audit as you go. SOX test as you go.
Page: 30
Ask why 5 times in order to train your mind to get to the real root cause
of an issue.
Problem: Sales are decreasing year over year on prod line x.
Why 1: All regions are showing growth except for region X.
Why 2: In October, customer A, decreased their order rate by 10%,
causing the short fall in the region.
Why 3: Customer A, decided to dual source and is moving there orders
to a competitor.
Why 4: Customer A thinks our prices are too high for what they need.
Why 5: Customer A only needs the mid range version of product A for
their application and we only offer the advanced range, forcing them to
pay more for features they don’t need.
The 5 Whys
Page: 31
Process map – details out each step in the process
A Value Stream Map….
Maps out each step in the process
Assigns a value add vs non value add distinction to each step.
Assigns a time value to each step.
Focuses on all inputs (vs just a few) to the activities
•Man
•Machine
•Information
•Materials
•Method
•Environment
Is often more far reaching/all encompassing than a process map.
Value stream map is a powerful tool to identify where there is waste in a
process.
Value Stream Mapping
Page: 32
Lean is continuous
The goal is a perfect process
There will always be more ways to improve
Constantly challenge the status quo
Be relentless against waste….it will always exist
Engage people. Lean is bottoms up, supported by the top
Page: 33
The future for accounting/finance
Page: 34
•We will see more separation between managerial accounting
methods (internally how we manage) from financial
accounting methods (how we report; legal and regulatory
compliance).
•Currently many companies view them as the same in order to
drive consistency.
•Lean is embedded in the managerial side and must separate
from financial accounting to work.
•Conversion processes from internal rptg to external rptg will
be a key challenge to overcome.
Managerial Accounting
vs
Financial Accounting
Page: 35
Focus on value metrics
Focus on metrics and accountability
Determine what activities are adding value to the bottom line
Create metrics that are continuous, standard and visible
Measurement frequency should be part of the process vs a report put out
after closing.
Focus on activities vs departments
Use the 5 whys to get to the root of the activity. Ex: Don’t measure sales….
measure leads generated today, the conversion rate of the leads and the
sales value of each leads.
Page: 36
• Standard Costs
• Actual cost vs. Budget
• (by functional
departments)
• Records Results
•Gross Margin (absorption)
method
•Complex metrics and
calculations
• Average Costs
• (Total Value Stream Cost/#units shipped to
customer)
• Actual cost vs Budget
• (by Value Stream)
• Understand Causes
•Contribution method
•Simplified operational metrics
that anyone can interpet
•Lean & Accounting
•Basedupon
Principles of Mass
Production
•Basedupon
Principles of Mass
Production
•Traditional Approach… •Lean Approach…
•Promotes
Continuous
Improvement
•Promotes
Continuous
Improvement
Page: 37
A change in perspective
The past….
Absorption Costing
Overhead allocations
Standard cost focus
Functional/Department budgets
Present results
Audit for compliance
Tactical focus. Deliver the numbers
Focus on numbers, bottom line.
P&L and balance sheet focus
Know competitors
Quality control/Assurance (Internal Audit, Approval Sign offs)
The future…
Contribution margin
Don’t allocate overhead
Actual cost focus..standards are just a point in time
Value stream/Integrated focus vs department splits
Present root causes and solutions
Audit for compliance AND waste
Strategic focus…deliver value, understand the customer
Focus on metrics. Drive value of parts to deliver the whole
Cash flow focus. Integrated focus. Drive value and income will come.
Know customers
Quality at the source through Poke-Yoke
Page: 38
ThankYou
Contact Me Anytime! Would love to chat!
Fabio Malagisi
FabioMalagisi@Yahoo.com
Linkedin Profile:
www.linkedin.com/pub/fabio-
malagisi/4/122/ba0/ Edit
Twitter
@FabioMalagisi

Lean afinanceperspectivefabiomalagisi-130224084952-phpapp01

  • 1.
    Lean Manufacturing: A financeperspective Fabio Malagisi
  • 2.
    Page: 2 The Customeris King Customer Satisfaction is… Reduced Cycles – Get Data/Analysis Faster. Reduce Bottlenecks. Flow. Better Delivery – Simplification. Standard Formats/Processes. Targeted Metrics. More Capacity – Reduce Transactional and Increase Analysis. Better Quality – Reduce Errors. Predictable Forecasting. Productivity – Predictable, Accurate and Repeatable. Lean drives customer satisfaction
  • 3.
    Page: 3 Customers… Want thingsdone correctly the first time. Don’t value what they won’t pay for. Pay foronly what they perceive adds value to the product. The customerdefines what is value add vs non value add. Value add = CustomerRequirement that they will pay for. If you itemized it on a bill…would the customerbe okpaying forthat activity? Eliminate the non value add as it is wasting resources and not being demanded (or paid for) by the customer. Yourcustomercould be Internal (ex: CEO, General Mgr) orExternal (Board of Directors, Shareholdsers, Consumers) The Customer defines “Value”
  • 4.
    Page: 4 Eliminate Wastein your Processes. Mura - waste due to unevenness…variation Muri - waste due to overburdening and unreasonableness. Muda – General term for a wasteful activity. Type I muda — Non-value added but necessary for the system as it is today to work properly. Type II muda — Non-value added and unnecessary. Eliminate Type II muda first and then move toward eliminating type I. Eliminate Waste:
  • 5.
    Page: 5 1) DefectiveParts = Bad Feeds, Rework on calculations, Manual JEs 2) Overproduction = Excess analysis…Excess Data…not demanded by customer 3) Inventory = Excess data trackers, non value add reports stored on shared drives. 4) Motion = Manual Journal Entries, Key punching into templates 5) Processing Transactions = Multiple post close templates, manual journal entries 6) Transportation = Multiple systems feeding eachother. Manual reclasses 7) Waiting = Wait time for Data from systems/people, Batch Runs Waste adds no value….waste only raises cost. The 7 Types of waste (Muda)
  • 6.
    Page: 6 Examples infinance: An incorrect system feed A manual journal entry to correct a booking A PO mapped to the incorrect account A report filled out with incorrect data An incorrect version of a report taken off a shared drive An excel formula error A sub-ledger not tying out to a ledger Outdated lookup tables or databases Question every time a human needs to intervene! Defective Parts
  • 7.
    Page: 7 Examples infinance: Extracting excess data that isn’t demanded by the customer Producing reports “Just in case” someone asks Downloading excess data into spreadsheets or databases Measuring performance of factors that aren’t “demanded” Excess reports/templates to support internal department meetings Auditing/tracking without regard to materiality Focus on the ability to react and produce Just in time Overproduction
  • 8.
    Page: 8 Examples infinance: Multiple databases stored in excel/access Everyone having their own personal “stocking” of data reports Reports maintained that aren’t used...“Obsolete”/”Slow Moving” Data produced at the wrong time…too early or too late Unneeded offsite storage of records Multiple people producing the same data reporting Excess formats articulating the same data Incomplete analysis Data held in multiple locations requiring excess reconciliations Inventory is a tool to hide problems…don’t allow problems to be hidden Inventory
  • 9.
    Examples in finance: Unnecessarykey punching Running wasteful reports Manual journal entries Manual categorization of data for analysis Reconciliations that aren’t material Manual cross references Unnecessary filing / printing Unnecessary phone calls Unnecessary update meetings/emails Unnecessary manual reconciliations of systems Eliminate unneeded physical activity that is wasteful and time consuming Motion
  • 10.
    Page: 10 Examples infinance: Systems that don’t talk to each other Errors due to lack of training/understanding Rework due to changing of scope (lack of standardization) System errors that need to be manually corrected Multiple systems processing the same data in separate processes Duplicate processing of data due to lack of coordination Data integrity checks due to unreliable systems Uncoordinated activities that need to be tracked Approvals at the end of a process vs during the process. Automation is critical to eliminating this waste. Processing Transactions
  • 11.
    Page: 11 Examples infinance: Data that passes through multiple sub-ledgers and ledgers. Transactions that get re-classed manually in a ledger Data categorized multiple ways through multiple, separate lookup tables Multiple templates pulling the same data Unconnected databases that get updated separately Reports that travel to multiple people for input Excess systems that have to “talk” to one another Unnecessary approval chains Emailing files back and forth Every step adds complexity and is an opportunity for a defect. Transportation
  • 12.
    Page: 12 Examples infinance: Waiting for turn at shared resources (system log ins, spreadsheets etc) Unbalanced flow…waiting for data from someone/something. Waiting for a decisions Waiting for review/approvals Waiting for batch feeds to run Waiting for feedback on a process Idle time due to uncoordinated time zones and flow of data Idle time due to uncoordinated timelines and due dates/expectations Waiting takes away from our ability to add value through analysis. Waiting
  • 13.
    Page: 13 Waste =Any activity which absorbs resources but does not create value (defined by customer…not you!) Understanding waste helps us train ourselves to “see” waste when it occurs Relentlessly drive pursuit of perfect process to eliminate waste Waste adds cost but does not add value as the customer is not willing to pay for it Waste summary
  • 14.
    Page: 14 Common MudaExamples in Finance: Uneven stress levels/Closing Crunch. Too many manual journal entries. Equivalent to Rework. Batch feeds. Wait time in closing process. Uncoordinated functional inputs during forecasting efforts. Redundant templates for analysis. How far is the data traveling? Excess analysis due to lack of standard work. Complicated spreadsheets. Not apparent what the message is. Formula errors.
  • 15.
    Page: 15 Lean isvisual Lean uses visual indicators to communicate simply and effectively. The goal is to know what’s going on at any time, simply by seeing. Visual Indicators can…. Prevent an error – Ex: Black out cells that shouldn’t be touched in a spreadsheet. Flag a defect or abnormality – Ex: cell turns red when a balance sheet doesn’t balance Communicates status – Ex: Output on track to plan and shows a green status. Share information – Ex: Trend chart on order rates. Examples Conditional formatting in spreadsheets Daily meeting boards Status dashboards Simplify spreadsheet and graphs Error proof…add checks in formulas Standard views and indicators Color coding Video vs written training/standard operating procedures
  • 16.
    Page: 16 5S iscritical to creating a visual system. Sort – Easy access to data. Eliminate unneeded reports/data. Set in Order – Organize data. Set Metrics and Control Limits. Create the “Critical Few” and manage the outliers. Shine – Continuously eliminate waste….Attack Data feed issues, excess data, wait time etc. Standardize – Std work, Std analysis, Std format, Std schedule. Repeatable and accurate processes. Sustain – Continuous flow of data analysis with process controls (Visual Mgmt). Std work and repeatable processes. Develop a “takt time” with daily routines. 5S – Starting a visual system
  • 17.
    Page: 17 Define whatis needed and get rid of what is unneeded. • Pay attention to “aged WIP”. Half done analysis that is driving clutter. • Old/excess equipment. • Outdated processes. • Unneeded documents and email. • Eliminate storage. Don’t allow things to build up again. • Purge shared drives. • Documents from former employees that are never looked at. • How can people tag things that aren’t needed? What is going to be your “red tag” method on data? • Pay attention to document retention policies for compliance. Sort
  • 18.
    Page: 18 Organize whatis needed. Put it in a logical place and make it stand out when its not in its place. • Location needs to be self explanatory • Re-Label • Color code common items • Rename and Reorder • Put files where they are functional…how will they be used and when? • Needs to be self evident…to all. A place for everything and everything in its place. Set in Order
  • 19.
    Page: 19 Set controlsand audit routines. Ensure you are sticking with the program. • Have a routine • Check color coding, labeling etc • Find abnormalities and clean them up • Make it visual • Make it mistake proof • Fix deviations on the spot Shine
  • 20.
    Page: 20 Make 5Spart of your standard work. Embrace it as how you operate. • You can’t fix anything until its stable. • Communicate errors and defects so all can learn from it. • Everyone should know what is normal and abnormal and what the thresholds are. • Define the routines. In a routine, abnormality sticks out more. • Focus on scheduling and sequencing. • Drive documentation. Document procedures and standards. • Train everyone. Interchangeable processes not reliant on specific people • Anyone should be able to notice what the abnormality is. Standardize
  • 21.
    Page: 21 Keep sustainableprocesses in place. Don’t let things regress. • Requires a discipline toward the process. • Checklists to monitor compliance • Rely on visual management to know what is going on. • Reward positive momentum. • Make it fun. Celebrate success • Need a 360 degree feedback loop. • Everyone must commit and reinforce. Mgmt at all levels. • Accountability • Continuous improvements…constantly challenge the status quo Sustain
  • 22.
    Page: 22 TPS (ToyotaProduction System) Considered the best practice and guide for a set of lean tools.
  • 23.
    Page: 23 Establish stabilitydespite erratic demand Need to Level and Sequence our financial processes. • Daily/Weekly/Hourly Standard Analysis vs Month/Qtr end Crunch. • Continuous metrics vs ad hoc analysis. • Forecasting built into your process vs qtrly. Assumptions tied out. • Functional sequencing…Procurement, Commercial, Mktg, Mfg. • No all nighters…..Daily routines. Heijunka Wk3 Wk4
  • 24.
    Page: 24 Strive forStandard Work Determine your quality standards and control limits Standardize your processes. Do things consistently. Document your work instructions and procedures. Allow for flexibility across people. Process drives effectiveness. Standardization allows abnormalities to be more noticeable.
  • 25.
    Page: 25 • Kai– Change / Zen - continuous improvement • Kaizen allows you to Implement and control processes….and continuously improve them. • Kaizen engages people in the lean effort • Kaizen is essential to drive lean • A kaizen event (1-5 days) is a focused dedicated event with the goal to drive lean process improvements in a specified area. 1.Plan 2.Create a plan 3.Do 4.Try it out 5.Check 6.Examine 7.Act 8.Implement changes Kaizen
  • 26.
    Page: 26 • ADaily Rhythm of analysis • No wait time on data. • No Excess analysis…Simplification. • Automation…feed templates. Reduce Key Punching and manual. • Re-active analysis = Quality defect/rework. • “Instant indicators”/ Performance Metrics create “flow”. • Pull system – Customer triggers the activity vs pushing the activity onto the customer. Just In Time (JIT) Provide customers what is needed, when its needed and the amount that is needed. Develop a Takt time and strive for continuous flow in your data.
  • 27.
    Page: 27 Detect abnormalityand stopping when abnormality is detected. Jidoka Process controls that allow for detection of abnormalities: •Built in checks •Control Limits on your data. •Manage the outliers, not every piece of data. •Process Controls drive compliance vs reactive audits. •Build all critical activities into process…eliminate post analysis. •Instant Indicators = Visual Management •Quality on the front line – Don’t rely on approvals. When it gets to a “quality inspector”…its too late.
  • 28.
    Page: 28 From theJapanese, yokeru – to prevent, and poka – inadvertent errors Simple visual methods which prevent mistakes from being made. It’s visual…manage with your eyes. Poka-Yoke the process to mistake proof your process. Some Examples of Poka-Yoke Conditional formatting in spreadsheets Error proof…add checks in formulas Color coding to relay sequencing information. Audit checks that are visual. Blacking out cells that shouldn’t be input into. Protecting cells. Trend charts with control limits Poka-Yoke
  • 29.
    Page: 29 Quality atthe source A “mistake” is caught at the source….a “defect” is a mistake that moves on to the next step in the process Mistake proof your processes and don’t allow a mistake to become a defect. Strive for quality at the source vs relying on auditors, manager approvals, Audit as you go. SOX test as you go.
  • 30.
    Page: 30 Ask why5 times in order to train your mind to get to the real root cause of an issue. Problem: Sales are decreasing year over year on prod line x. Why 1: All regions are showing growth except for region X. Why 2: In October, customer A, decreased their order rate by 10%, causing the short fall in the region. Why 3: Customer A, decided to dual source and is moving there orders to a competitor. Why 4: Customer A thinks our prices are too high for what they need. Why 5: Customer A only needs the mid range version of product A for their application and we only offer the advanced range, forcing them to pay more for features they don’t need. The 5 Whys
  • 31.
    Page: 31 Process map– details out each step in the process A Value Stream Map…. Maps out each step in the process Assigns a value add vs non value add distinction to each step. Assigns a time value to each step. Focuses on all inputs (vs just a few) to the activities •Man •Machine •Information •Materials •Method •Environment Is often more far reaching/all encompassing than a process map. Value stream map is a powerful tool to identify where there is waste in a process. Value Stream Mapping
  • 32.
    Page: 32 Lean iscontinuous The goal is a perfect process There will always be more ways to improve Constantly challenge the status quo Be relentless against waste….it will always exist Engage people. Lean is bottoms up, supported by the top
  • 33.
    Page: 33 The futurefor accounting/finance
  • 34.
    Page: 34 •We willsee more separation between managerial accounting methods (internally how we manage) from financial accounting methods (how we report; legal and regulatory compliance). •Currently many companies view them as the same in order to drive consistency. •Lean is embedded in the managerial side and must separate from financial accounting to work. •Conversion processes from internal rptg to external rptg will be a key challenge to overcome. Managerial Accounting vs Financial Accounting
  • 35.
    Page: 35 Focus onvalue metrics Focus on metrics and accountability Determine what activities are adding value to the bottom line Create metrics that are continuous, standard and visible Measurement frequency should be part of the process vs a report put out after closing. Focus on activities vs departments Use the 5 whys to get to the root of the activity. Ex: Don’t measure sales…. measure leads generated today, the conversion rate of the leads and the sales value of each leads.
  • 36.
    Page: 36 • StandardCosts • Actual cost vs. Budget • (by functional departments) • Records Results •Gross Margin (absorption) method •Complex metrics and calculations • Average Costs • (Total Value Stream Cost/#units shipped to customer) • Actual cost vs Budget • (by Value Stream) • Understand Causes •Contribution method •Simplified operational metrics that anyone can interpet •Lean & Accounting •Basedupon Principles of Mass Production •Basedupon Principles of Mass Production •Traditional Approach… •Lean Approach… •Promotes Continuous Improvement •Promotes Continuous Improvement
  • 37.
    Page: 37 A changein perspective The past…. Absorption Costing Overhead allocations Standard cost focus Functional/Department budgets Present results Audit for compliance Tactical focus. Deliver the numbers Focus on numbers, bottom line. P&L and balance sheet focus Know competitors Quality control/Assurance (Internal Audit, Approval Sign offs) The future… Contribution margin Don’t allocate overhead Actual cost focus..standards are just a point in time Value stream/Integrated focus vs department splits Present root causes and solutions Audit for compliance AND waste Strategic focus…deliver value, understand the customer Focus on metrics. Drive value of parts to deliver the whole Cash flow focus. Integrated focus. Drive value and income will come. Know customers Quality at the source through Poke-Yoke
  • 38.
    Page: 38 ThankYou Contact MeAnytime! Would love to chat! Fabio Malagisi FabioMalagisi@Yahoo.com Linkedin Profile: www.linkedin.com/pub/fabio- malagisi/4/122/ba0/ Edit Twitter @FabioMalagisi