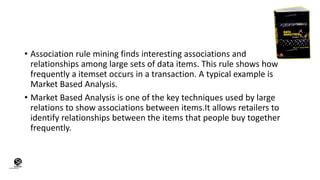
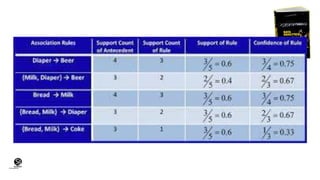
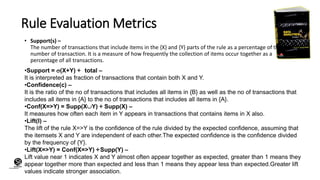
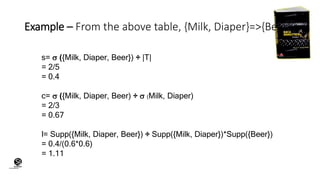
Association rule mining is used to find relationships between items in transaction data. It identifies rules that can predict the occurrence of an item based on other items purchased together frequently. Some key metrics used to evaluate rules include support, which measures how frequently an itemset occurs; confidence, which measures how often items in the predicted set occur given items in the predictor set; and lift, which compares the confidence to expected confidence if items were independent. An example association rule evaluated is {Milk, Diaper} -> {Beer} with support of 0.4, confidence of 0.67, and lift of 1.11.
Data preprocessing techniques
See my Paris applied psychology conference paper here
https://www.slideshare.net/jasonrodrigues/paris-conference-on-applied-psychology
or
https://prezi.com/view/KBP8JnekVH9LkLOiKY3w/
Linear Regression Analysis | Linear Regression in Python | Machine Learning A...Simplilearn
This Linear Regression in Machine Learning Presentation will help you understand the basics of Linear Regression algorithm - what is Linear Regression, why is it needed and how Simple Linear Regression works with solved examples, Linear regression analysis, applications of Linear Regression and Multiple Linear Regression model. At the end, we will implement a use case on profit estimation of companies using Linear Regression in Python. This Machine Learning presentation is ideal for beginners who want to understand Data Science algorithms as well as Machine Learning algorithms.
Below topics are covered in this Linear Regression Machine Learning Tutorial:
1. Introduction to Machine Learning
2. Machine Learning Algorithms
3. Applications of Linear Regression
4. Understanding Linear Regression
5. Multiple Linear Regression
6. Use case - Profit estimation of companies
What is Machine Learning: Machine Learning is an application of Artificial Intelligence (AI) that provides systems the ability to automatically learn and improve from experience without being explicitly programmed.
- - - - - - - -
About Simplilearn Machine Learning course:
A form of artificial intelligence, Machine Learning is revolutionizing the world of computing as well as all people’s digital interactions. Machine Learning powers such innovative automated technologies as recommendation engines, facial recognition, fraud protection and even self-driving cars.This Machine Learning course prepares engineers, data scientists and other professionals with knowledge and hands-on skills required for certification and job competency in Machine Learning.
- - - - - - -
Why learn Machine Learning?
Machine Learning is taking over the world- and with that, there is a growing need among companies for professionals to know the ins and outs of Machine Learning
The Machine Learning market size is expected to grow from USD 1.03 Billion in 2016 to USD 8.81 Billion by 2022, at a Compound Annual Growth Rate (CAGR) of 44.1% during the forecast period.
- - - - - - -
Who should take this Machine Learning Training Course?
We recommend this Machine Learning training course for the following professionals in particular:
1. Developers aspiring to be a data scientist or Machine Learning engineer
2. Information architects who want to gain expertise in Machine Learning algorithms
3. Analytics professionals who want to work in Machine Learning or artificial intelligence
4. Graduates looking to build a career in data science and Machine Learning
- - - - - -
This Logistic Regression Presentation will help you understand how a Logistic Regression algorithm works in Machine Learning. In this tutorial video, you will learn what is Supervised Learning, what is Classification problem and some associated algorithms, what is Logistic Regression, how it works with simple examples, the maths behind Logistic Regression, how it is different from Linear Regression and Logistic Regression applications. At the end, you will also see an interesting demo in Python on how to predict the number present in an image using Logistic Regression.
Below topics are covered in this Machine Learning Algorithms Presentation:
1. What is supervised learning?
2. What is classification? what are some of its solutions?
3. What is logistic regression?
4. Comparing linear and logistic regression
5. Logistic regression applications
6. Use case - Predicting the number in an image
What is Machine Learning: Machine Learning is an application of Artificial Intelligence (AI) that provides systems the ability to automatically learn and improve from experience without being explicitly programmed.
- - - - - - - -
About Simplilearn Machine Learning course:
A form of artificial intelligence, Machine Learning is revolutionizing the world of computing as well as all people’s digital interactions. Machine Learning powers such innovative automated technologies as recommendation engines, facial recognition, fraud protection and even self-driving cars.This Machine Learning course prepares engineers, data scientists and other professionals with knowledge and hands-on skills required for certification and job competency in Machine Learning.
- - - - - - -
Why learn Machine Learning?
Machine Learning is taking over the world- and with that, there is a growing need among companies for professionals to know the ins and outs of Machine Learning
The Machine Learning market size is expected to grow from USD 1.03 Billion in 2016 to USD 8.81 Billion by 2022, at a Compound Annual Growth Rate (CAGR) of 44.1% during the forecast period.
- - - - - -
What skills will you learn from this Machine Learning course?
By the end of this Machine Learning course, you will be able to:
1. Master the concepts of supervised, unsupervised and reinforcement learning concepts and modeling.
2. Gain practical mastery over principles, algorithms, and applications of Machine Learning through a hands-on approach which includes working on 28 projects and one capstone project.
3. Acquire thorough knowledge of the mathematical and heuristic aspects of Machine Learning.
4. Understand the concepts and operation of support vector machines, kernel SVM, naive bayes, decision tree classifier, random forest classifier, logistic regression, K-nearest neighbors, K-means clustering and more.
5. Be able to model a wide variety of robust Machine Learning algorithms including deep learning, clustering, and recommendation systems
- - - - - - -
Naive Bayes is a kind of classifier which uses the Bayes Theorem. It predicts membership probabilities for each class such as the probability that given record or data point belongs to a particular class.
Decision tree induction \ Decision Tree Algorithm with Example| Data scienceMaryamRehman6
This Decision Tree Algorithm in Machine Learning Presentation will help you understand all the basics of Decision Tree along with what Machine Learning is, what Machine Learning is, what Decision Tree is, the advantages and disadvantages of Decision Tree, how Decision Tree algorithm works with resolved examples, and at the end of the decision Tree use case/demo in Python for loan payment. For both beginners and experts who want to learn Machine Learning Algorithms, this Decision Tree tutorial is perfect.
This course is all about the data mining that how we get the optimized results. it included with all types and how we use these techniques.This course is all about the data mining that how we get the optimized results. it included with all types and how we use these techniques.This course is all about the data mining that how we get the optimized results. it included with all types and how we use these techniques.This course is all about the data mining that how we get the optimized results. it included with all types and how we use these techniques.This course is all about the data mining that how we get the optimized results. it included with all types and how we use these techniques
Decision tree is a type of supervised learning algorithm (having a pre-defined target variable) that is mostly used in classification problems. It is a tree in which each branch node represents a choice between a number of alternatives, and each leaf node represents a decision.
Ensemble Learning is a technique that creates multiple models and then combines them to produce improved results.
Ensemble learning usually produces more accurate solutions than a single model would.
Linear Regression Algorithm | Linear Regression in R | Data Science Training ...Edureka!
This Edureka Linear Regression tutorial will help you understand all the basics of linear regression machine learning algorithm along with examples. This tutorial is ideal for both beginners as well as professionals who want to learn or brush up their Data Science concepts. Below are the topics covered in this tutorial:
1) Introduction to Machine Learning
2) What is Regression?
3) Types of Regression
4) Linear Regression Examples
5) Linear Regression Use Cases
6) Demo in R: Real Estate Use Case
You can also take a complete structured training, check out the details here: https://goo.gl/AfxwBc
Slide helps in generating an understand about the intuition and mathematics / stats behind association rule mining. This presentation starts by highlighting the difference between causal and correlation. This is followed Apriori algorithm and the metrics which are used with it. Each metric is discussed in detail. Then a formulation has been generated in classification setting which can be used to generate rules i.e. rule mining.
Other Reference: https://www.slideshare.net/JustinCletus/mining-frequent-patterns-association-and-correlations
Data Science - Part VI - Market Basket and Product Recommendation EnginesDerek Kane
This lecture provides an overview of association analysis, which includes topics such as market basket analysis and product recommendation engines. The first practical example centers around analyzing supermarket retailer product receipts and the second example touches upon the use of the association rules in the political arena.
Top Down Approach to find Maximal Frequent Item Sets using Subset Creationcscpconf
Association rule has been an area of active research in the field of knowledge discovery. Data
mining researchers had improved upon the quality of association rule mining for business
development by incorporating influential factors like value (utility), quantity of items sold
(weight) and more for the mining of association patterns. In this paper, we propose an efficient
approach to find maximal frequent item set first. Most of the algorithms in literature used to find
minimal frequent item first, then with the help of minimal frequent item sets derive the maximal
frequent item sets. These methods consume more time to find maximal frequent item sets. To
overcome this problem, we propose a navel approach to find maximal frequent item set directly using the concepts of subsets. The proposed method is found to be efficient in finding maximal frequent item sets.
�
� �
�
5
Association Analysis:
Basic Concepts and
Algorithms
Many business enterprises accumulate large quantities of data from their day-
to-day operations. For example, huge amounts of customer purchase data are
collected daily at the checkout counters of grocery stores. Table 5.1 gives an
example of such data, commonly known as market basket transactions.
Each row in this table corresponds to a transaction, which contains a unique
identifier labeled TID and a set of items bought by a given customer. Retailers
are interested in analyzing the data to learn about the purchasing behavior
of their customers. Such valuable information can be used to support a vari-
ety of business-related applications such as marketing promotions, inventory
management, and customer relationship management.
This chapter presents a methodology known as association analysis,
which is useful for discovering interesting relationships hidden in large data
sets. The uncovered relationships can be represented in the form of sets of
items present in many transactions, which are known as frequent itemsets,
Table 5.1. An example of market basket transactions.
TID Items
1 {Bread, Milk}
2 {Bread, Diapers, Beer, Eggs}
3 {Milk, Diapers, Beer, Cola}
4 {Bread, Milk, Diapers, Beer}
5 {Bread, Milk, Diapers, Cola}
�
� �
�
358 Chapter 5 Association Analysis
or association rules, that represent relationships between two itemsets. For
example, the following rule can be extracted from the data set shown in
Table 5.1:
{Diapers} −→ {Beer}.
The rule suggests a relationship between the sale of diapers and beer because
many customers who buy diapers also buy beer. Retailers can use these types
of rules to help them identify new opportunities for cross-selling their products
to the customers.
Besides market basket data, association analysis is also applicable to data
from other application domains such as bioinformatics, medical diagnosis, web
mining, and scientific data analysis. In the analysis of Earth science data, for
example, association patterns may reveal interesting connections among the
ocean, land, and atmospheric processes. Such information may help Earth
scientists develop a better understanding of how the different elements of the
Earth system interact with each other. Even though the techniques presented
here are generally applicable to a wider variety of data sets, for illustrative
purposes, our discussion will focus mainly on market basket data.
There are two key issues that need to be addressed when applying associ-
ation analysis to market basket data. First, discovering patterns from a large
transaction data set can be computationally expensive. Second, some of the
discovered patterns may be spurious (happen simply by chance) and even for
non-spurious patterns, some are more interesting than others. The remainder
of this chapter is organized around these two issues. The first part of the
chapter is devoted to explaining the basic concepts of association ...
This presentation discusses the following topics:
Basic features of R
Exploring R GUI
Data Frames & Lists
Handling Data in R Workspace
Reading Data Sets & Exporting Data from R
Manipulating & Processing Data in R
A study on “Diagnosis Test of Diabetics and Hypertension by AI”, Presentation slides for International Conference on "Life Sciences: Acceptance of the New Normal", St. Aloysius' College, Jabalpur, Madhya Pradesh, India, 27-28 August, 2021
A study on “impact of artificial intelligence in covid19 diagnosis”Dr. C.V. Suresh Babu
A study on “Impact of Artificial Intelligence in COVID-19 Diagnosis”, Presentation slides for International Conference on "Life Sciences: Acceptance of the New Normal", St. Aloysius' College, Jabalpur, Madhya Pradesh, India, 27-28 August, 2021
A study on “impact of artificial intelligence in covid19 diagnosis”Dr. C.V. Suresh Babu
Although the lungs are one of the most vital organs in the body, they are vulnerable to infection and injury. COVID-19 has put the entire world in an unprecedented difficult situation, bringing life to a halt and claiming thousands of lives all across the world. Medical imaging, such as X-rays and computed tomography (CT), is essential in the global fight against COVID-19, and newly emerging artificial intelligence (AI) technologies are boosting the power of imaging tools and assisting medical specialists. AI can improve job efficiency by precisely identifying infections in X-ray and CT images and allowing further measurement. We focus on the integration of AI with X-ray and CT, both of which are routinely used in frontline hospitals, to reflect the most recent progress in medical imaging and radiology combating COVID-19.
A study on “the impact of data analytics in covid 19 health care system”Dr. C.V. Suresh Babu
A Study on “The Impact of Data Analytics in COVID-19 Health Care System”, Presentation slides for International Conference on "Life Sciences: Acceptance of the New Normal", St. Aloysius' College, Jabalpur, Madhya Pradesh, India, 27-28 August, 2021
Opendatabay - Open Data Marketplace.pptxOpendatabay
Opendatabay.com unlocks the power of data for everyone. Open Data Marketplace fosters a collaborative hub for data enthusiasts to explore, share, and contribute to a vast collection of datasets.
First ever open hub for data enthusiasts to collaborate and innovate. A platform to explore, share, and contribute to a vast collection of datasets. Through robust quality control and innovative technologies like blockchain verification, opendatabay ensures the authenticity and reliability of datasets, empowering users to make data-driven decisions with confidence. Leverage cutting-edge AI technologies to enhance the data exploration, analysis, and discovery experience.
From intelligent search and recommendations to automated data productisation and quotation, Opendatabay AI-driven features streamline the data workflow. Finding the data you need shouldn't be a complex. Opendatabay simplifies the data acquisition process with an intuitive interface and robust search tools. Effortlessly explore, discover, and access the data you need, allowing you to focus on extracting valuable insights. Opendatabay breaks new ground with a dedicated, AI-generated, synthetic datasets.
Leverage these privacy-preserving datasets for training and testing AI models without compromising sensitive information. Opendatabay prioritizes transparency by providing detailed metadata, provenance information, and usage guidelines for each dataset, ensuring users have a comprehensive understanding of the data they're working with. By leveraging a powerful combination of distributed ledger technology and rigorous third-party audits Opendatabay ensures the authenticity and reliability of every dataset. Security is at the core of Opendatabay. Marketplace implements stringent security measures, including encryption, access controls, and regular vulnerability assessments, to safeguard your data and protect your privacy.
Techniques to optimize the pagerank algorithm usually fall in two categories. One is to try reducing the work per iteration, and the other is to try reducing the number of iterations. These goals are often at odds with one another. Skipping computation on vertices which have already converged has the potential to save iteration time. Skipping in-identical vertices, with the same in-links, helps reduce duplicate computations and thus could help reduce iteration time. Road networks often have chains which can be short-circuited before pagerank computation to improve performance. Final ranks of chain nodes can be easily calculated. This could reduce both the iteration time, and the number of iterations. If a graph has no dangling nodes, pagerank of each strongly connected component can be computed in topological order. This could help reduce the iteration time, no. of iterations, and also enable multi-iteration concurrency in pagerank computation. The combination of all of the above methods is the STICD algorithm. [sticd] For dynamic graphs, unchanged components whose ranks are unaffected can be skipped altogether.
StarCompliance is a leading firm specializing in the recovery of stolen cryptocurrency. Our comprehensive services are designed to assist individuals and organizations in navigating the complex process of fraud reporting, investigation, and fund recovery. We combine cutting-edge technology with expert legal support to provide a robust solution for victims of crypto theft.
Our Services Include:
Reporting to Tracking Authorities:
We immediately notify all relevant centralized exchanges (CEX), decentralized exchanges (DEX), and wallet providers about the stolen cryptocurrency. This ensures that the stolen assets are flagged as scam transactions, making it impossible for the thief to use them.
Assistance with Filing Police Reports:
We guide you through the process of filing a valid police report. Our support team provides detailed instructions on which police department to contact and helps you complete the necessary paperwork within the critical 72-hour window.
Launching the Refund Process:
Our team of experienced lawyers can initiate lawsuits on your behalf and represent you in various jurisdictions around the world. They work diligently to recover your stolen funds and ensure that justice is served.
At StarCompliance, we understand the urgency and stress involved in dealing with cryptocurrency theft. Our dedicated team works quickly and efficiently to provide you with the support and expertise needed to recover your assets. Trust us to be your partner in navigating the complexities of the crypto world and safeguarding your investments.
Chatty Kathy - UNC Bootcamp Final Project Presentation - Final Version - 5.23...John Andrews
SlideShare Description for "Chatty Kathy - UNC Bootcamp Final Project Presentation"
Title: Chatty Kathy: Enhancing Physical Activity Among Older Adults
Description:
Discover how Chatty Kathy, an innovative project developed at the UNC Bootcamp, aims to tackle the challenge of low physical activity among older adults. Our AI-driven solution uses peer interaction to boost and sustain exercise levels, significantly improving health outcomes. This presentation covers our problem statement, the rationale behind Chatty Kathy, synthetic data and persona creation, model performance metrics, a visual demonstration of the project, and potential future developments. Join us for an insightful Q&A session to explore the potential of this groundbreaking project.
Project Team: Jay Requarth, Jana Avery, John Andrews, Dr. Dick Davis II, Nee Buntoum, Nam Yeongjin & Mat Nicholas
2. (CentreforKnowledgeTransfer)
institute
• Association rule mining finds interesting associations and
relationships among large sets of data items. This rule shows how
frequently a itemset occurs in a transaction. A typical example is
Market Based Analysis.
• Market Based Analysis is one of the key techniques used by large
relations to show associations between items.It allows retailers to
identify relationships between the items that people buy together
frequently.
3. (CentreforKnowledgeTransfer)
institute
• Given a set of transactions, we can find rules that will predict the
occurrence of an item based on the occurrences of other items in the
transaction.
TID Items
1 Bread, Milk
2 Bread, Diaper, Beer, Eggs
3 Milk, Diaper, Beer, Coke
4 Bread, Milk, Diaper, Beer
5 Bread, Milk, Diaper, Coke
Before we start defining the rule, let us first see the basic
definitions.
Support Count() ) – Frequency of occurrence of a itemset.
Here ({Milk, Bread, Diaper})=2
Frequent Itemset – An itemset whose support is greater than or equal to minsup threshold.
Association Rule – An implication expression of the form X -> Y, where X and Y are any 2 itemsets.
Example: {Milk, Diaper}->{Beer}
5. (CentreforKnowledgeTransfer)
institute
Rule Evaluation Metrics
• Support(s) –
The number of transactions that include items in the {X} and {Y} parts of the rule as a percentage of the total
number of transaction. It is a measure of how frequently the collection of items occur together as a
percentage of all transactions.
•Support = (X+Y) ÷ total –
It is interpreted as fraction of transactions that contain both X and Y.
•Confidence(c) –
It is the ratio of the no of transactions that includes all items in {B} as well as the no of transactions that
includes all items in {A} to the no of transactions that includes all items in {A}.
•Conf(X=>Y) = Supp(XY) ÷ Supp(X) –
It measures how often each item in Y appears in transactions that contains items in X also.
•Lift(l) –
The lift of the rule X=>Y is the confidence of the rule divided by the expected confidence, assuming that
the itemsets X and Y are independent of each other.The expected confidence is the confidence divided
by the frequency of {Y}.
•Lift(X=>Y) = Conf(X=>Y) ÷Supp(Y) –
Lift value near 1 indicates X and Y almost often appear together as expected, greater than 1 means they
appear together more than expected and less than 1 means they appear less than expected.Greater lift
values indicate stronger association.