Downloaded 204 times
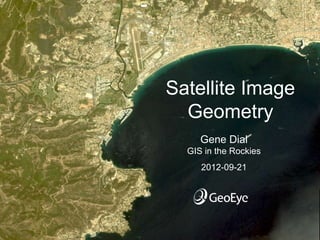


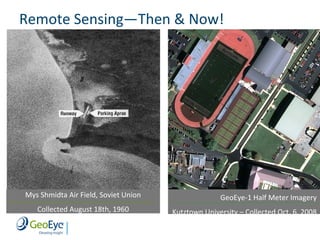


The document discusses satellite image geometry and specifications of various satellites like GeoEye-1 and GeoEye-2, detailing their capabilities in capturing and processing high-resolution imagery. It covers technical aspects such as ground sample distance, azimuth, and elevation angles, and explains different image products including orthophotos and stereo images. Additionally, it highlights applications of satellite imagery in mapping, environmental monitoring, and photogrammetry.


![[모두의연구소] 쫄지말자딥러닝](https://cdn.slidesharecdn.com/ss_thumbnails/20160528-160529034614-thumbnail.jpg?width=640&height=640&fit=bounds)


![[Pycon 2015] 오늘 당장 딥러닝 실험하기 제출용](https://cdn.slidesharecdn.com/ss_thumbnails/pycon2015-150913033231-lva1-app6892-thumbnail.jpg?width=640&height=640&fit=bounds)