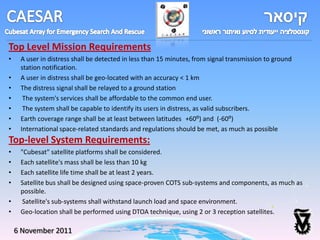
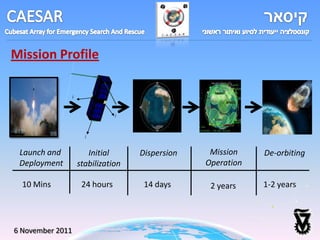
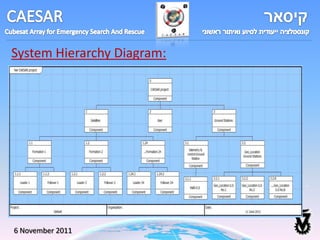
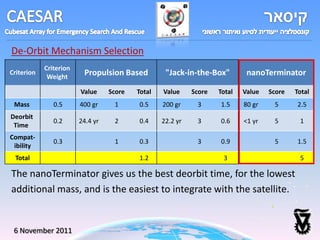
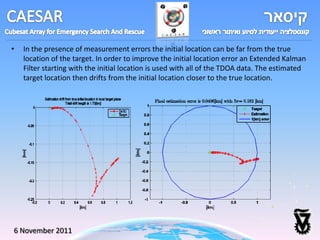
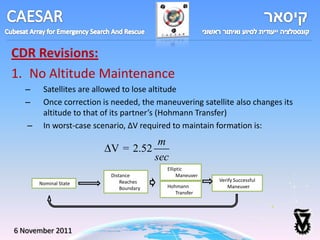
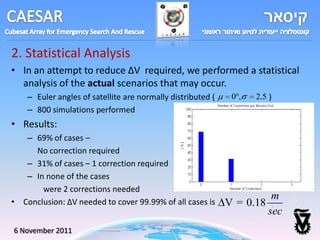
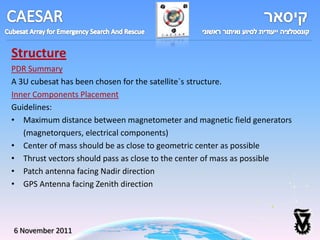
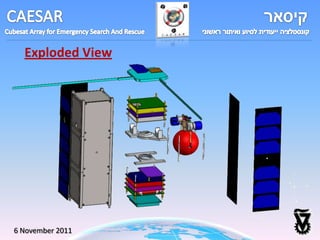
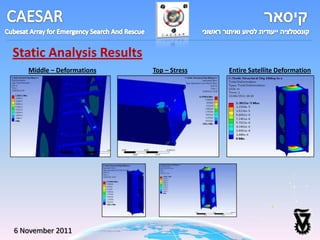
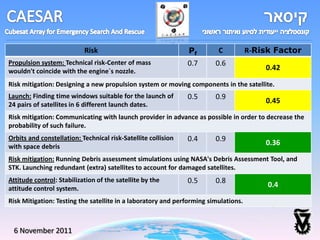
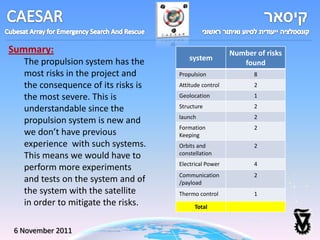
The document summarizes a preliminary design review for a search and rescue satellite constellation. Key points:
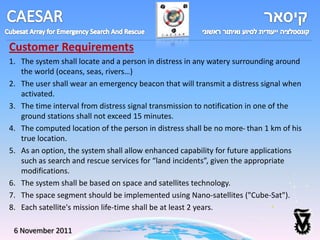
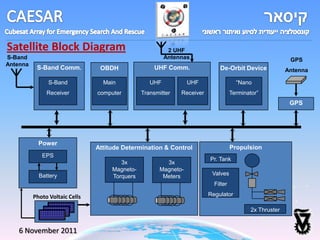
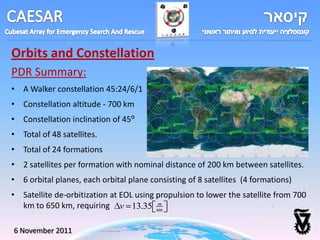
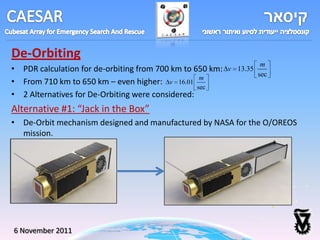
1) The constellation would consist of 48 nano-satellites in 6 orbital planes to locate persons in distress within 15 minutes with 1 km accuracy.
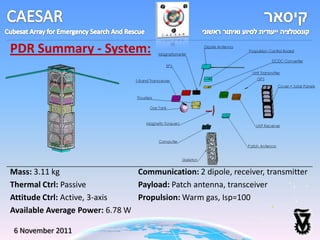
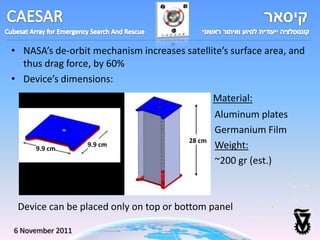
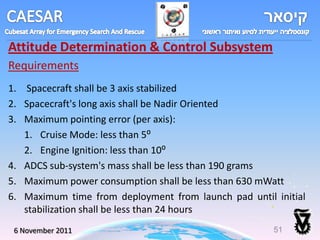
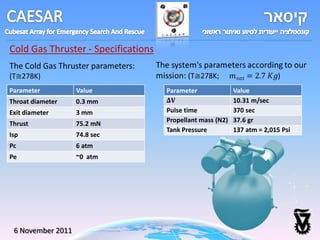
2) Each satellite would have a mass of 3.11 kg, use passive thermal control, active 3-axis attitude control, a warm gas propulsion system, and communicate via two dipole antennas.
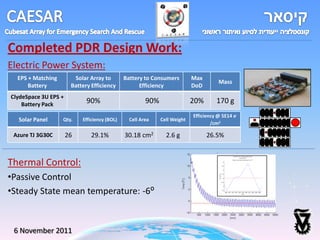
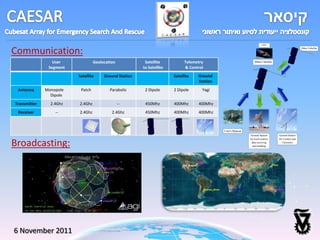
3) The design was updated since the preliminary design review, with the total satellite mass reduced to 2.3 kg and the delta-V budget reduced from 10.31 m/s to 7.94 m/s.
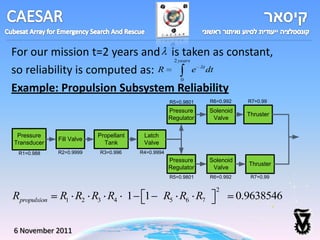
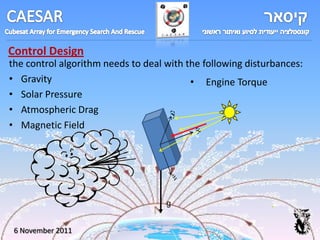
![Launch Segment:
1. Poly-PicoSatellite Orbital Deployer “P-Pod MKIII”:
• mass 1.5 kg
• can carry 3 (1U) cubesats or 1 (3U) cubesats
• number of deployers can be mounted together on a L.V
2. Launch Vehicle: SpaceX - Falcon 1e
Payload
Inclination Mass capability Est.
Altitude space Accuracy Reliability
[deg] [kg] Cost
[m]
Any above D1.55 x i = 0.1 [deg]
LEO 800 to 700[km] Med $10.9M
9⁰ H1.7 Apogee = 15[km]
6 November 2011](https://image.slidesharecdn.com/20110617-111106152011-phpapp02/85/2011-06-17-8-320.jpg)
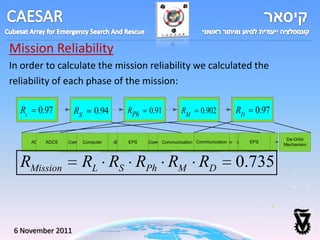
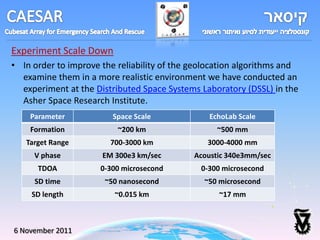
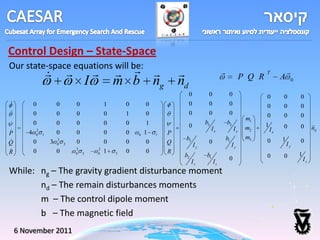
![Budgets
ΔV Budget Mass Budget Power Budget
PDR CDR Power consumption [mW]
PDR CDR Sub System Consumers
Usage System Total System Total
ΔV[m/s] ΔV[m/s] Cruise Detection Maneuver
Mass [Kg] Mass [Kg]
Positioning OBDH 0.08 0.08 OBDH 200 600 600
Keeping ADCS 0.209 0.09 ADCS 430 630 630
Formation Propulsion 1.209 0.458 Propulsion 0 0 2000
Deorbiting 0
Thermal 0 0
Spare Thermal Control 0 0 0
0.94 Control
(20%) Communication 200 450 450
Communication 0.23 0.23
Total 10.31 Payload 0.105 0.105 Payload 200 450 450
GPS 0.003 0.003 GPS 200 200 200
Power 0.297 0.237 EPS 200 200 200
Structure 0.958 1.02 Structure 0 0 0
De-Orbit - 0.08 De-Orbit 0 0 0
Total 3.111 2.3 Total 1430 1880 4530
6 November 2011](https://image.slidesharecdn.com/20110617-111106152011-phpapp02/85/2011-06-17-13-320.jpg)
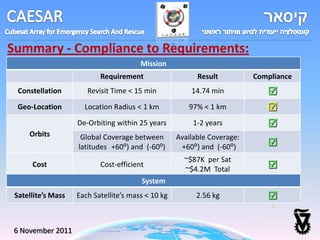
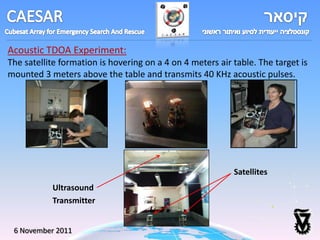
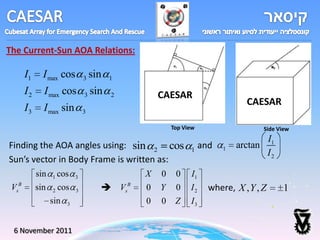
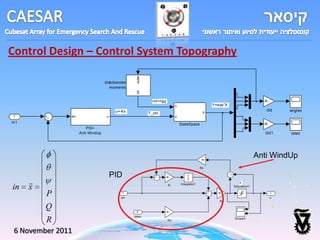
![Design Iteration:
Subsystem’s Mass: Satellite’s Mass:
Allocation for Mass [Kg] Comments
Sub-System
Sub-System Sub-System Dry Mass 2.3
Total Mass [Kg]
[Kg] 10% Margin 2.53 X+10%
Power 0.31 0.2376 Includes 10% Margin for
Fuel 0.031
ADCS 0.22 0.09 Fuel
Thermal Control 0 0 Includes:
Communication 0.265 0.23 Total 2.56 10% margin for Fuel and
Payload 0.11 0.105 10% margin for Dry Mass
GPS 0.004 0.003
OBDH 0.1 0.08
Propulsion 0.7 0.458
Structure 1.05 1.02
De-Orbit 0.2 0.08
Total 2.955 2.3
6 November 2011](https://image.slidesharecdn.com/20110617-111106152011-phpapp02/85/2011-06-17-14-320.jpg)

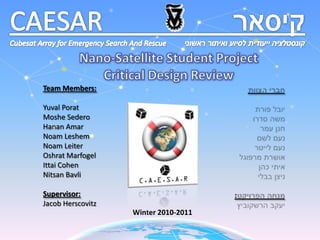
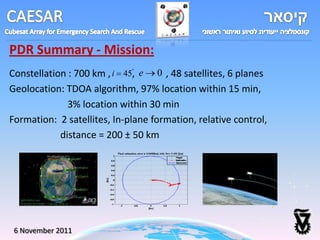
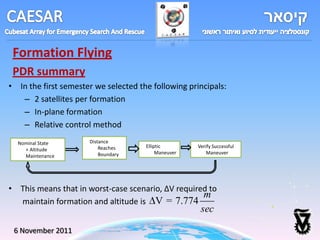
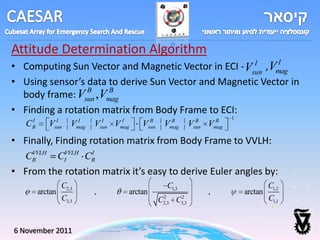
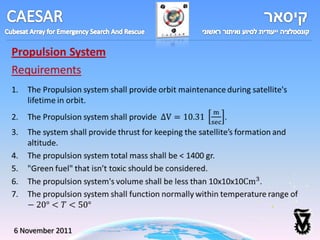
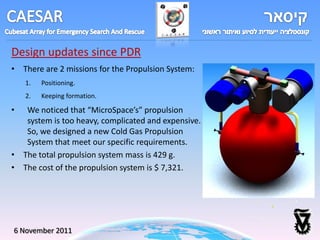
![Design Updates Since PDR:
• Altitude had been changed from 700 km to 710 km.
• At 710 km ionization dose is about 6 krad for 0.6 mm shielding thickness.
still well within the 10 krad restriction of the sensitive EPS system.
• In 2 years (mission life time) satellites decline approximately 10 km.
at EOL, altitude is around 700 - higher than the minimum of 697 km
• No altitude correction maneuvers are required throughout the entire mission.
Constellation Revisit Time Vs Altitude
Revisit Time [min]
Altitude [km]
6 November 2011](https://image.slidesharecdn.com/20110617-111106152011-phpapp02/85/2011-06-17-20-320.jpg)
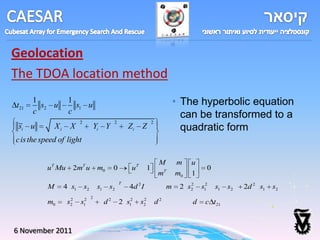
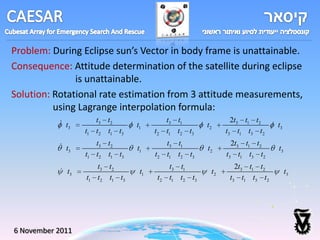
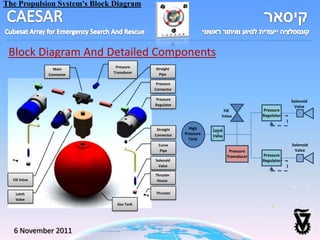
![Satellite Formation Flight and Target Location on Table Plane
Nominal target range is 3.089[m]
Nominal distance in formation is 0.617[m]
0.2
0.1
0
-0.1
-0.2 Target
Y [m]
SAT1
-0.3 SAT2
-0.4
-0.5
-0.6
-0.7
-0.6 -0.4 -0.2 0 0.2 0.4 0.6
X [m]
6 November 2011](https://image.slidesharecdn.com/20110617-111106152011-phpapp02/85/2011-06-17-33-320.jpg)
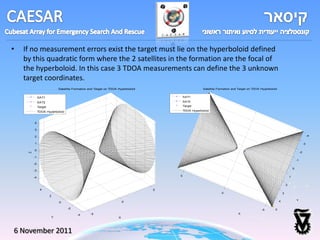
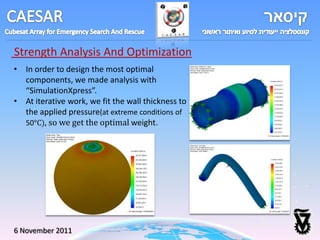
![Evolution of Location Error
Time SD is 15[ sec] Sv's Location SD is 1[cm]
0.2
3 0
Z [m]
2.95
-0.2
0.1
0 -0.4
-0.1 -0.6
-0.2 X [m] Estimation
-0.8
Y [m] Initial
Target
6 November 2011](https://image.slidesharecdn.com/20110617-111106152011-phpapp02/85/2011-06-17-34-320.jpg)
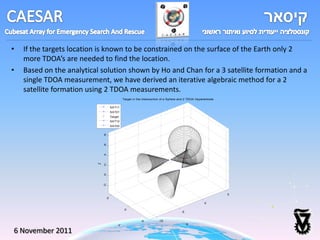
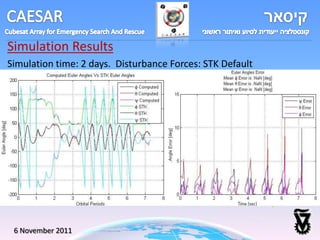
![Final Estimation Error is 8.32[cm] with 3 = 20.9 [cm]
120
100
80
[cm]
60
40
20
0
2 4 6 8 10 12 14 16 18 20 22
[Estimation Steps]
6 November 2011](https://image.slidesharecdn.com/20110617-111106152011-phpapp02/85/2011-06-17-35-320.jpg)
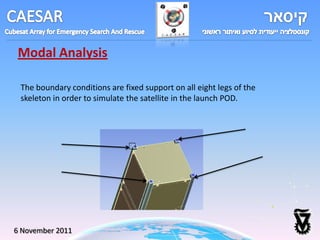
![Modal Analysis
1st mode 2nd mode 3rd mode
The first 6 modes are:
Mode Frequency [Hz]
1 695
2 708.11
3 755.18 4th mode 5th mode 6th mode
4 756.94
5 769.25
6 769.6
6 November 2011](https://image.slidesharecdn.com/20110617-111106152011-phpapp02/85/2011-06-17-48-320.jpg)
![Hardware Updates:
PDR CDR
Honeywell
Billingsley
HMC 5843
Magneto TFM65-VQS
(Integrated to OBC)
-meter
117 gr 50 milligram
3.51x3.23x8.26 [cm³] 4x4x1.3 mm
Satellite Services LTD Visio Torquer
Torquer rod (x3) PCB
Magneto
-Torquer m = 30 gr
m = 100 gr
L=7 cm
Size: 10 x 9 cm
D=0.9 cm
Dipole = 0.5 Am²
Dipole=0.2 Am²
6 November 2011](https://image.slidesharecdn.com/20110617-111106152011-phpapp02/85/2011-06-17-53-320.jpg)
![Control Design – Results
Steady State Eclipse Response
3 100
2
Angle [deg]
50
Angle [deg]
1
0 0
-1
0 1000 2000 3000 4000 5000 6000 7000 8000
time [sec] -50
0 1000 2000 3000 4000 5000 6000 7000 8000
time [sec]
180o command:
Controller
ST=4652.8566sec
250
200
150
Angle [deg]
100
50
0
-50
0 1000 2000 3000 4000 5000 6000 7000 8000
time [sec]
6 November 2011](https://image.slidesharecdn.com/20110617-111106152011-phpapp02/85/2011-06-17-62-320.jpg)
![ΔV Budget
ΔV[m/s]
Usage
PDR CDR
Positioning
Keeping
Formation
Deorbiting
Spare (10%)
Total
6 November 2011](https://image.slidesharecdn.com/20110617-111106152011-phpapp02/85/2011-06-17-64-320.jpg)
![Design Parameters Optimization
In order to choose the most suitable design parameters we made graphs and at
iterative way we gathered to the best solution.
Thrust Vs. Pc Thrust Vs. Area Ratio
0.8 tpulse Vs. Area Ratio 0.08
Thrust Vs. Pc
Thrust Vs. Throat Diameter
Thrust Vs. Area Ratio
0.6
0.08 0.8
420
1.5 0.075
F [N]
F [N]
0.4
0.6 0.07
0.2
t pulse [sec]
0.0751
400
F [N]
F [N]
0 0.065
0.4
F [N]
5 10 15 20 25 30 35 40 45 50 55 60 20 40 60 80 100 120 140 160 180
Pc [atm] Area Ratio Ae/At
t pulse Vs. Pc Isp Vs. Area Ratio
0.5
380 80
3000
0.07 0.2
75
tpulse [sec]
Isp [sec]
2000
0 0
1000 360
0.065 0.1 5
0.2 10
0.3 15
0.4 20
0.5 25 0.6 30 0.7 350.8 40 0.9 45 1 50 1.155
70 60
20
20 40
40 60
60 80 100[atm]120 140 160 180
Throat Diameter [mm] 140
80 100
Pc 120 160 180
Area Ratio Ae/At
tpulse Vs.tRatio Vs. Pc
60 Area Ae/At
0 65
pulse Diameter
Throat
5 10 15 20 25 30 35 40 45 50 55 20 40 60 80 100 120 140 160 180
Pc [atm]
mIsp Vs. Area Ratio
prop
Vs. Area Ratio Area Ratio Ae/At
3000
3000
80
44 Thrust Vs. Throat Diameter tpulse Vs. Area Ratio
1.5
420
tpulse [sec]
2000
[sec]
1 2000
42
75 t pulse [sec]
mtprop [gr]
400
Isp [sec]
F [N]
pulse
0.5
40 1000
380
1000
0
0.1 0.2 0.3
70 0.5
0.4 0.6 0.7 0.8 0.9 1 1.1 360
20 40 60 80 100 120 140 160 180
38 Throat Diameter [mm]
Area Ratio Ae/At
0 0
tpulse Vs. Throat Diameter
mprop Vs. Area Ratio
3000 5 10 15 20
0.5 25 0.6 30 0.7 350.8 40 0.9 45 1 50 1.155 60
36 65 0.1 0.2 0.3 0.4 44
20
20 40
40 60
60 80 100[atm]
Pc 120
Throat Diameter 120
80 100 140
[mm] 140 160
160 180
180
tpulse [sec]
2000 42
mprop [gr]
Area Ratio Ae/At
Area Ratio Ae/At
40
1000
38
6 November 2011 0
0.1 0.2 0.3 0.4 0.5 0.6 0.7 0.8
Throat Diameter [mm]
0.9 1 1.1 36
20 40 60 80 100 120 140 160 180
Area Ratio Ae/At](https://image.slidesharecdn.com/20110617-111106152011-phpapp02/85/2011-06-17-69-320.jpg)

![Cost Estimation - Propulsion example
Gas Pressure Pressure Latch Solenoid Control
Part Name Thruster Fill Valve Fasteners
Tank Regulator Transducer Valve valve Board
Part's Cost $ 303 66 1,500 885 900 233 400 452 724
Time [Min] 120
Rate
Assembly Work 100
[$/Hour]
Cost $ 200
Opacity Test - Time [Min] 120
Helium mass Rate
Work 70
spectrometer [$/Hour]
with bell jar Cost $ 140
Quantity for the constellation 48 96 96 48 48 96 48 48 48
Total Cost per Satellite $ 7,268
Total Cost for Entire Constellation $ 348,856
Pressing pattern $ 10,000
Non- Opacity Equipment $ 5,000
recurrent Environmental
30,000
testing $
Total non-recurrent cost $ 45,000
6 November 2011](https://image.slidesharecdn.com/20110617-111106152011-phpapp02/85/2011-06-17-72-320.jpg)
![System Reliability
Reliability: “the probability that a device will work without failure
over a specific time periods or amount of usage” *IEEE, 1984].
R e t
R - Success Probability, - Failure Rate , t -Time Period
Series Reliability:
A B C RS RA RB RC
Parallel/Redundant Reliability :
A
B RP 1 1 R A
1 RB 1 RC
C
6 November 2011](https://image.slidesharecdn.com/20110617-111106152011-phpapp02/85/2011-06-17-78-320.jpg)