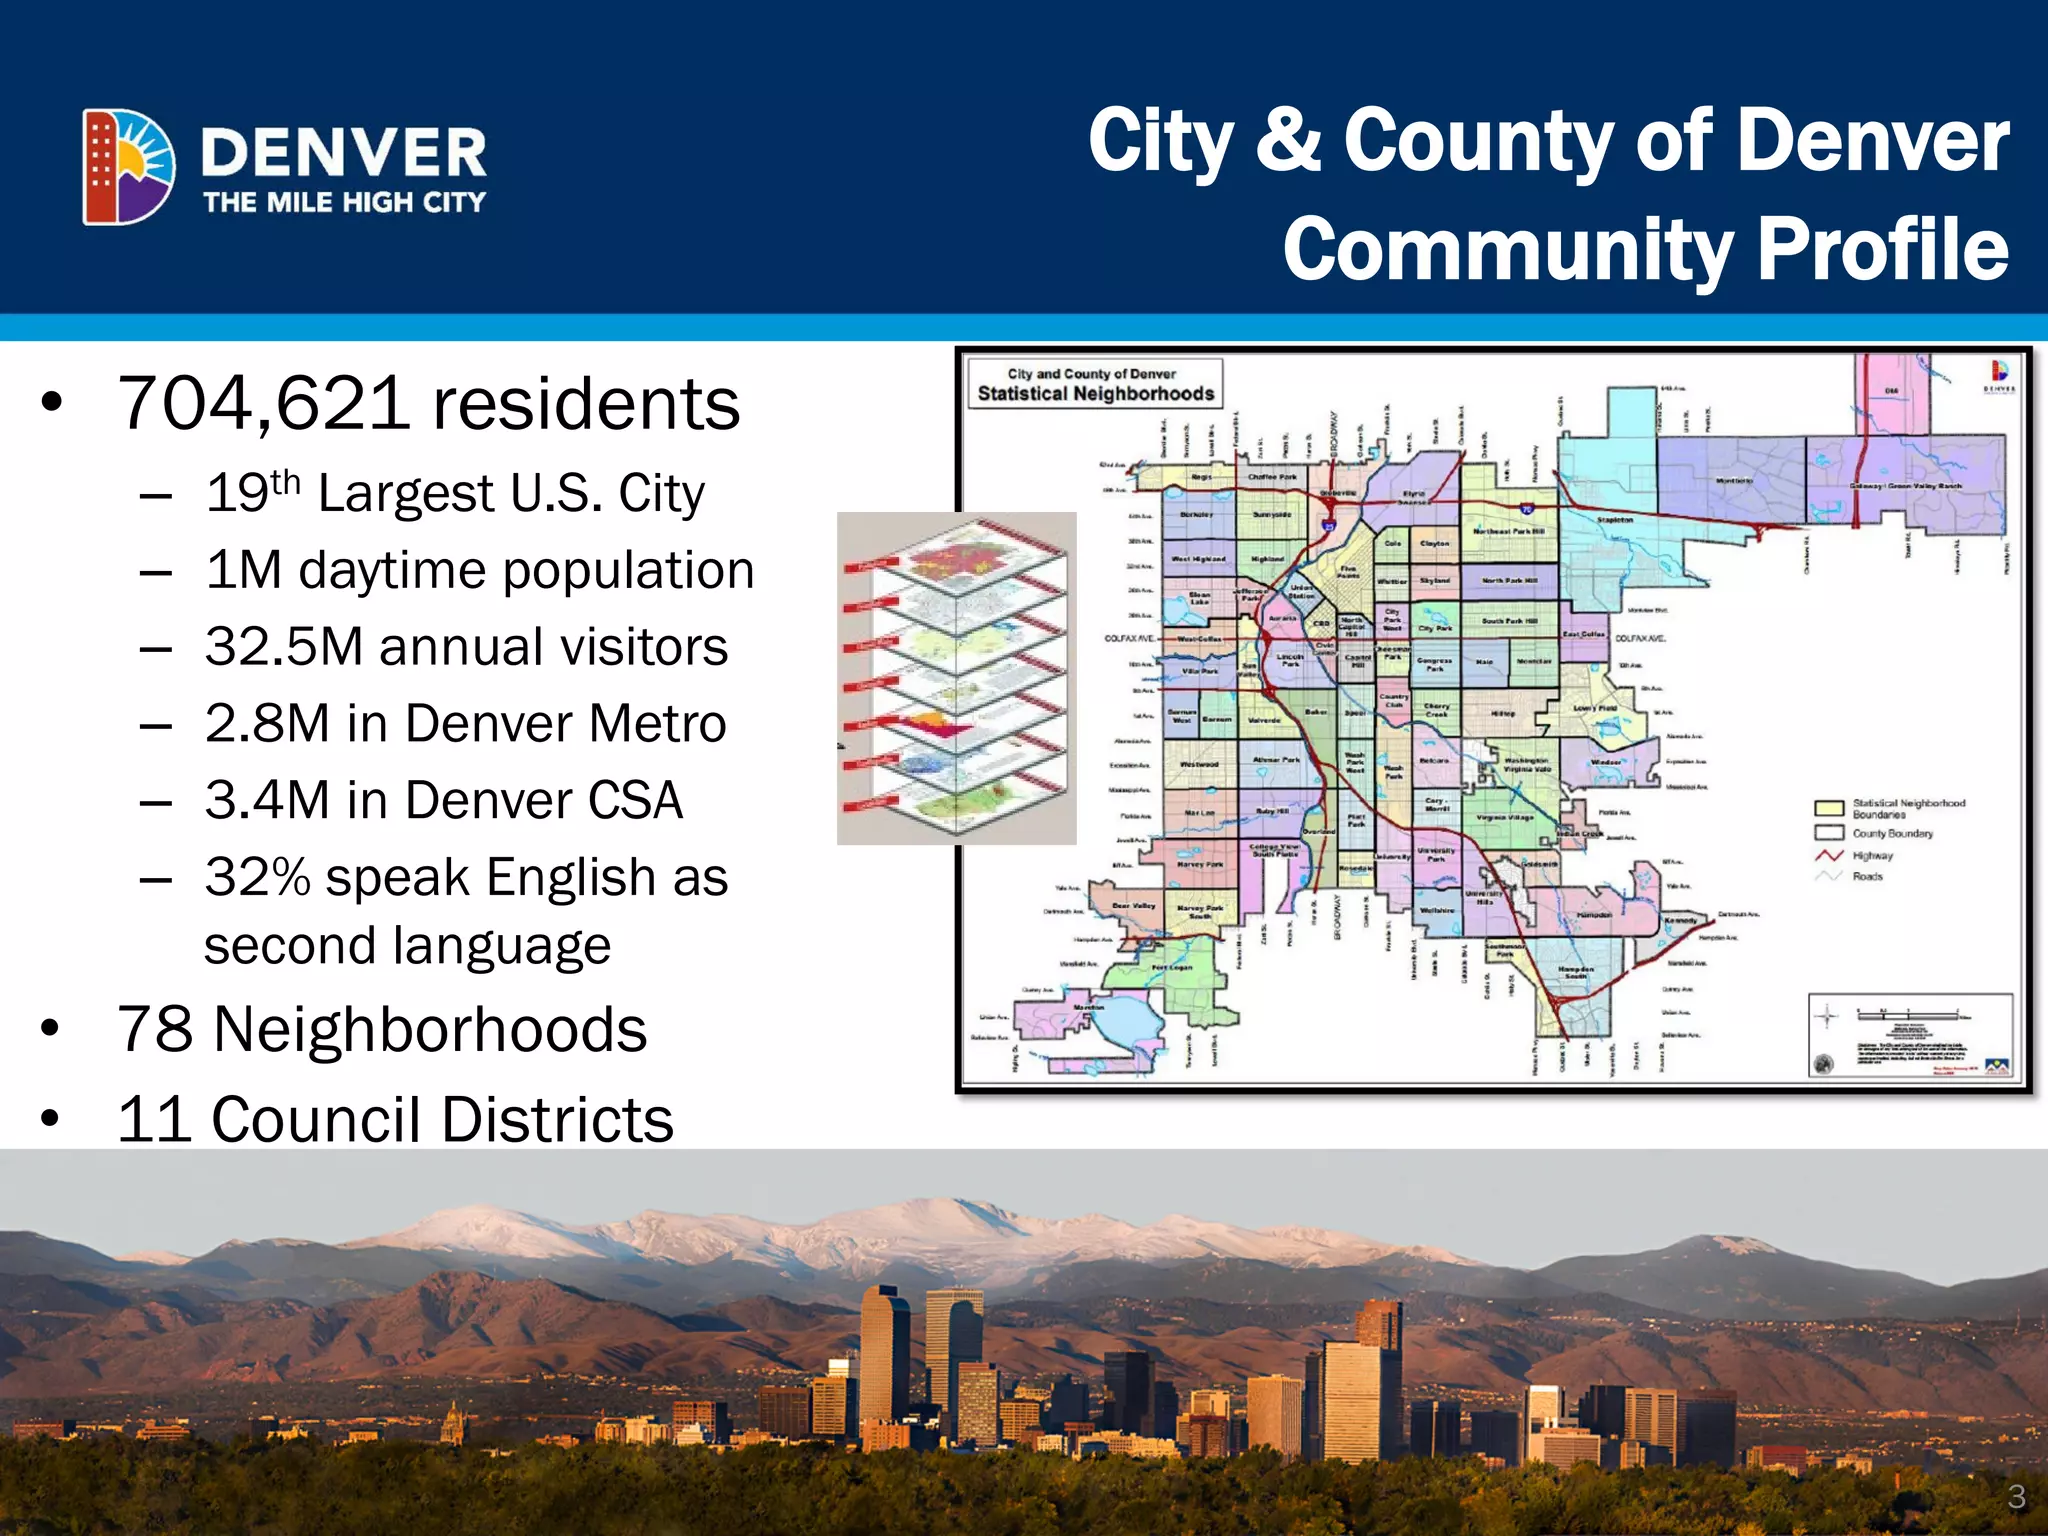
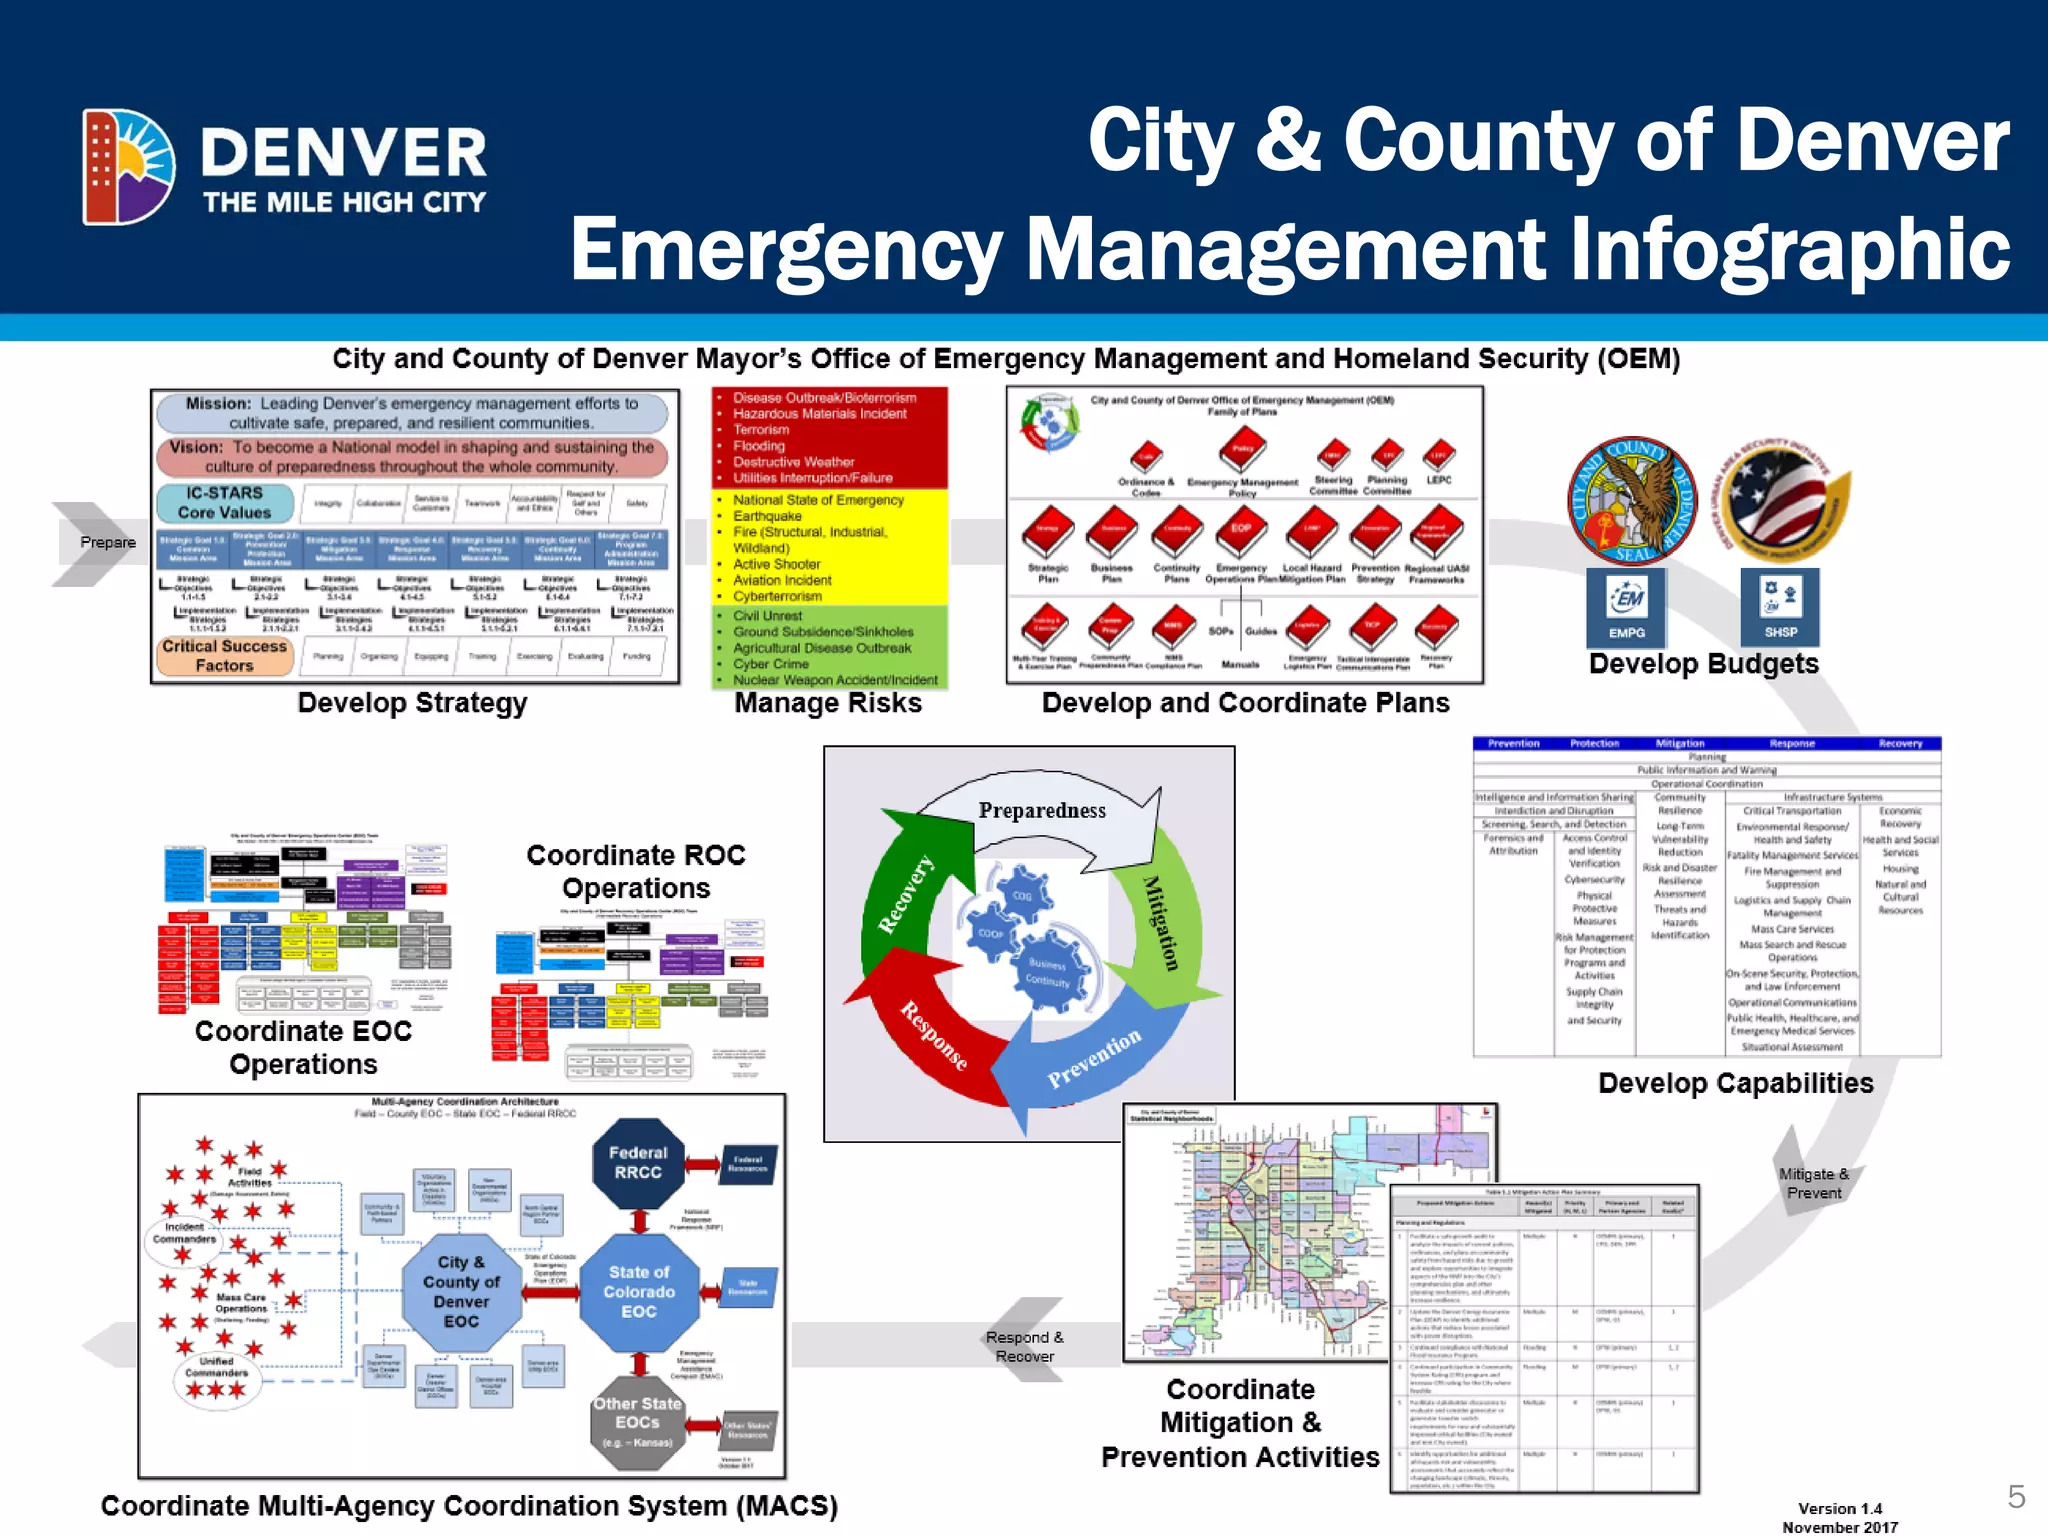
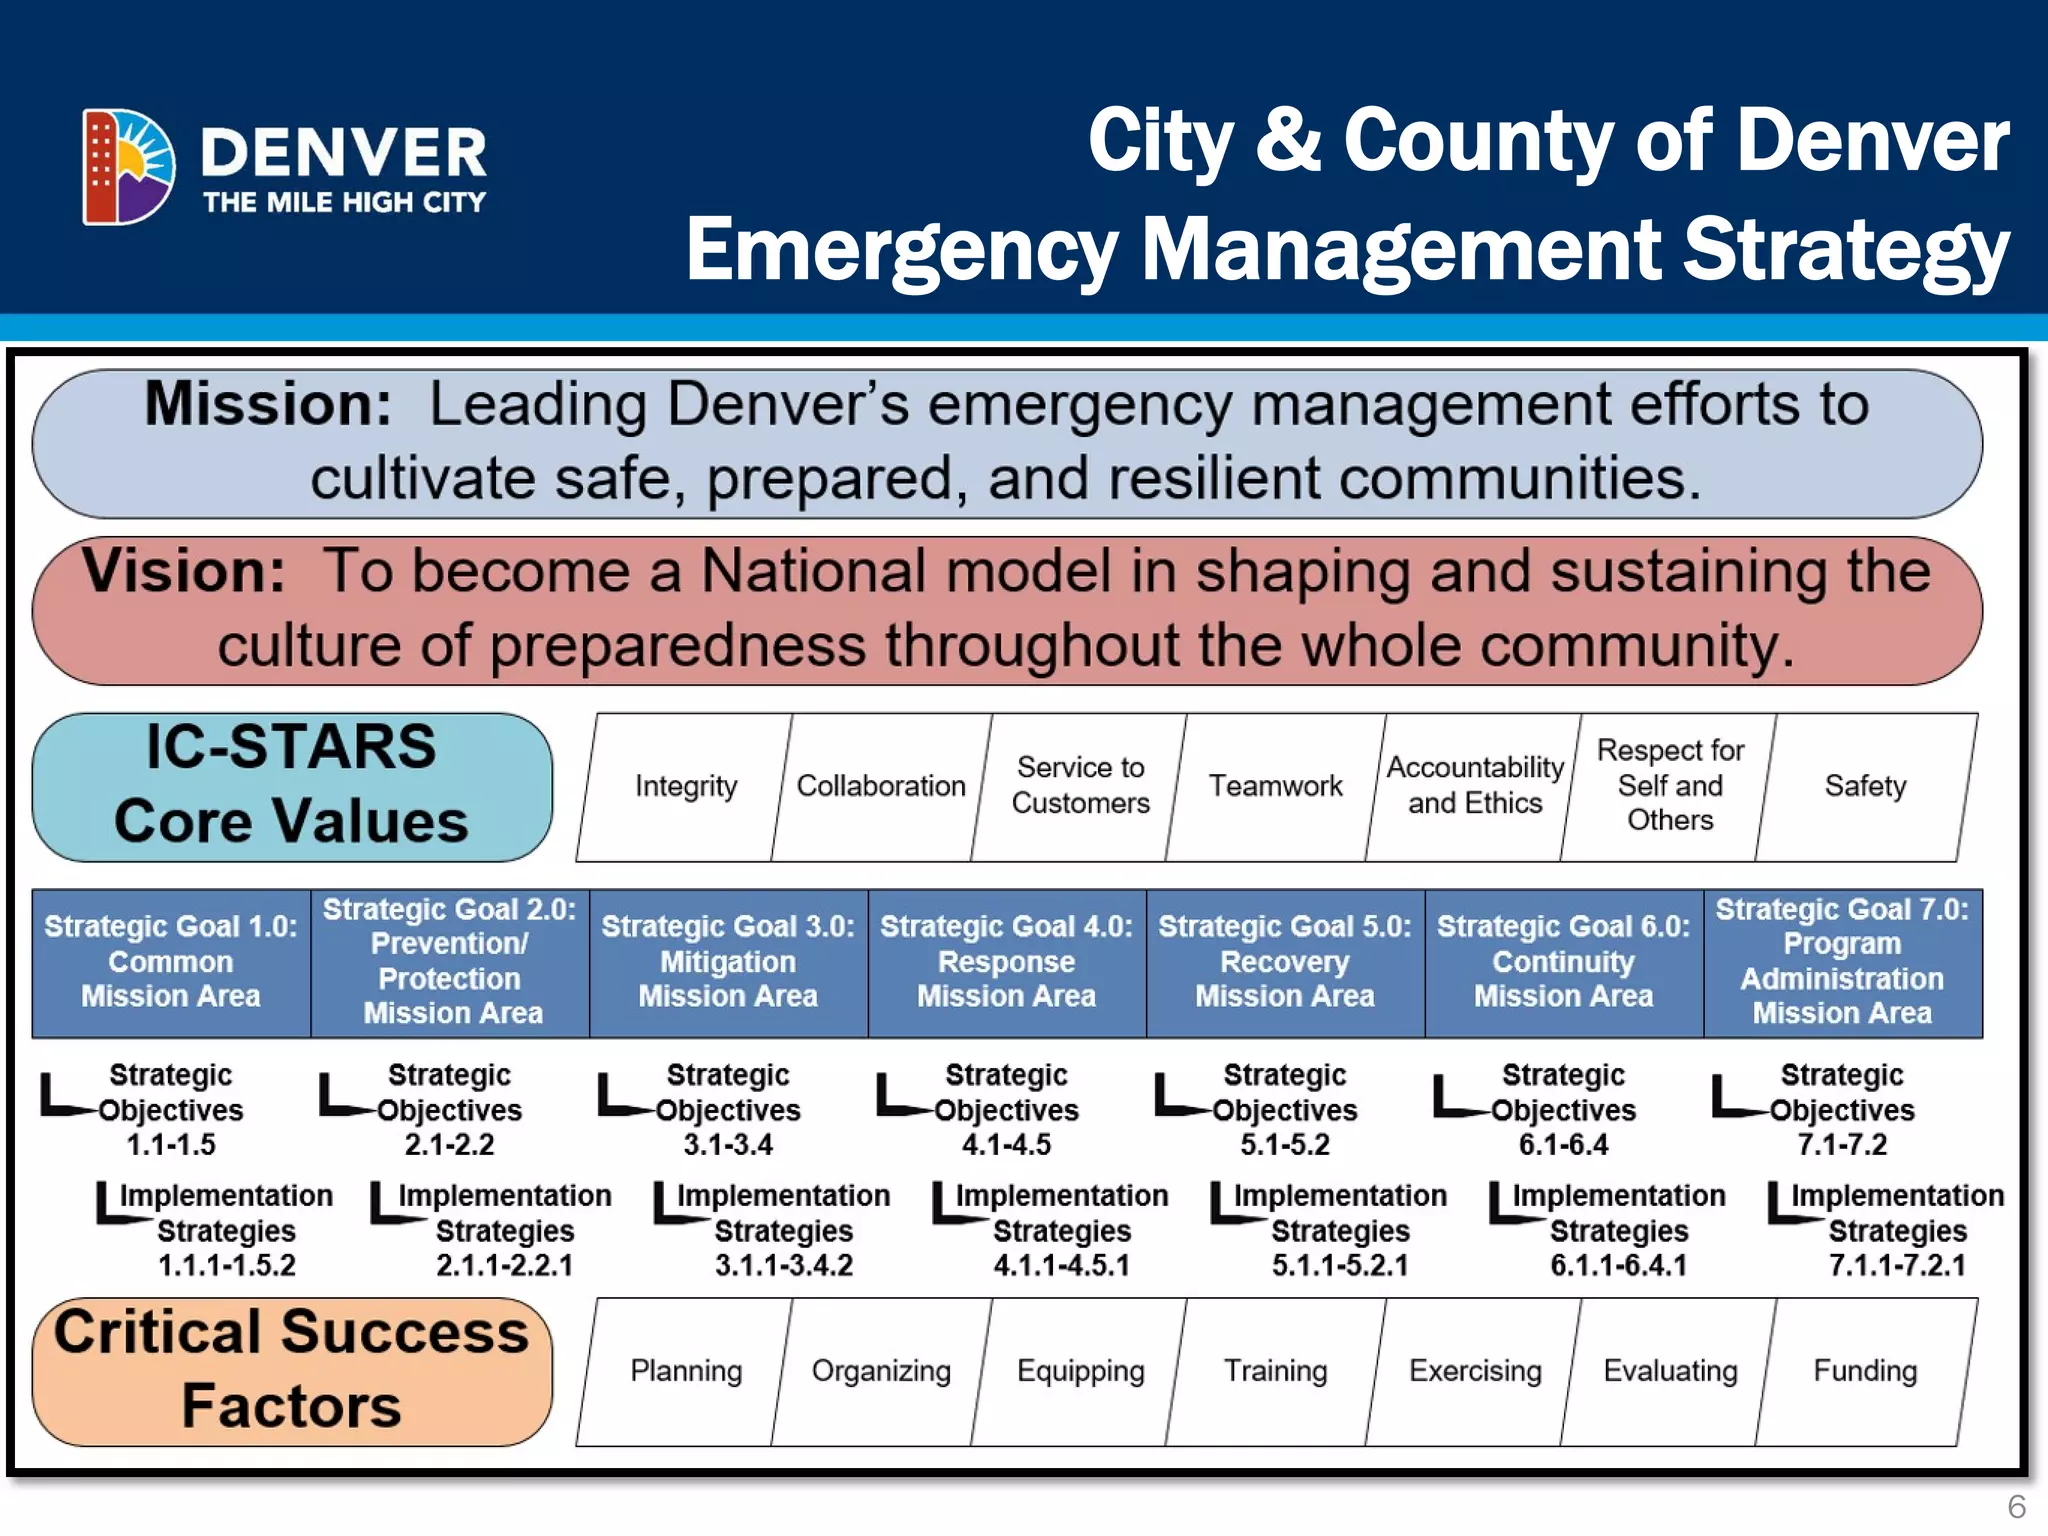
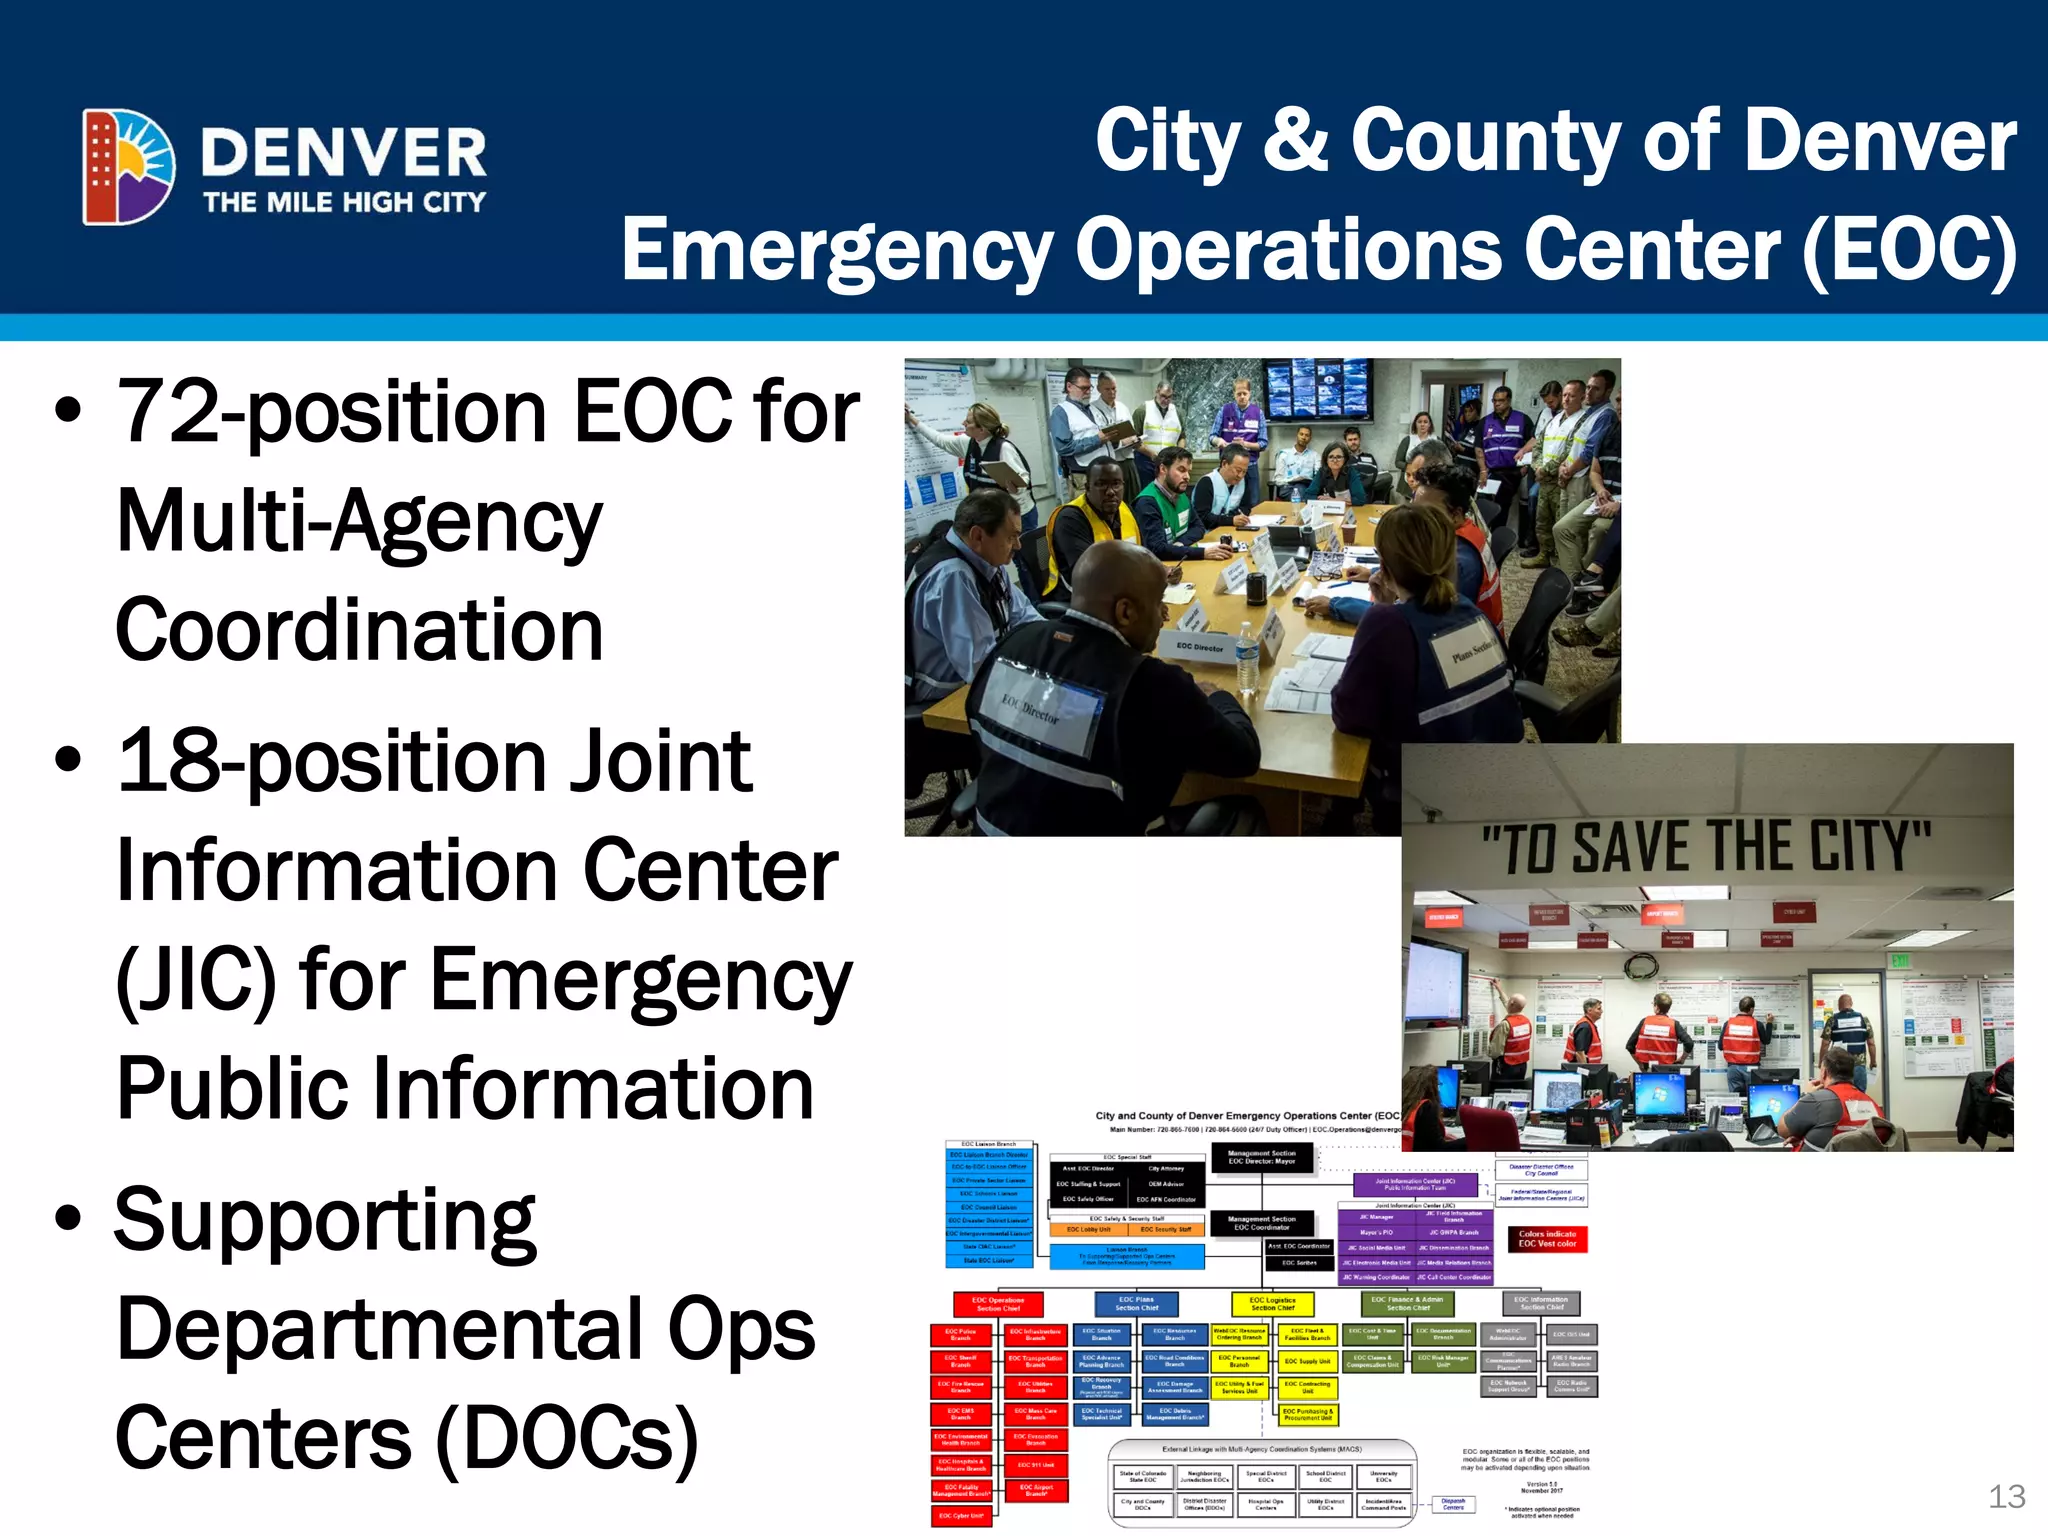
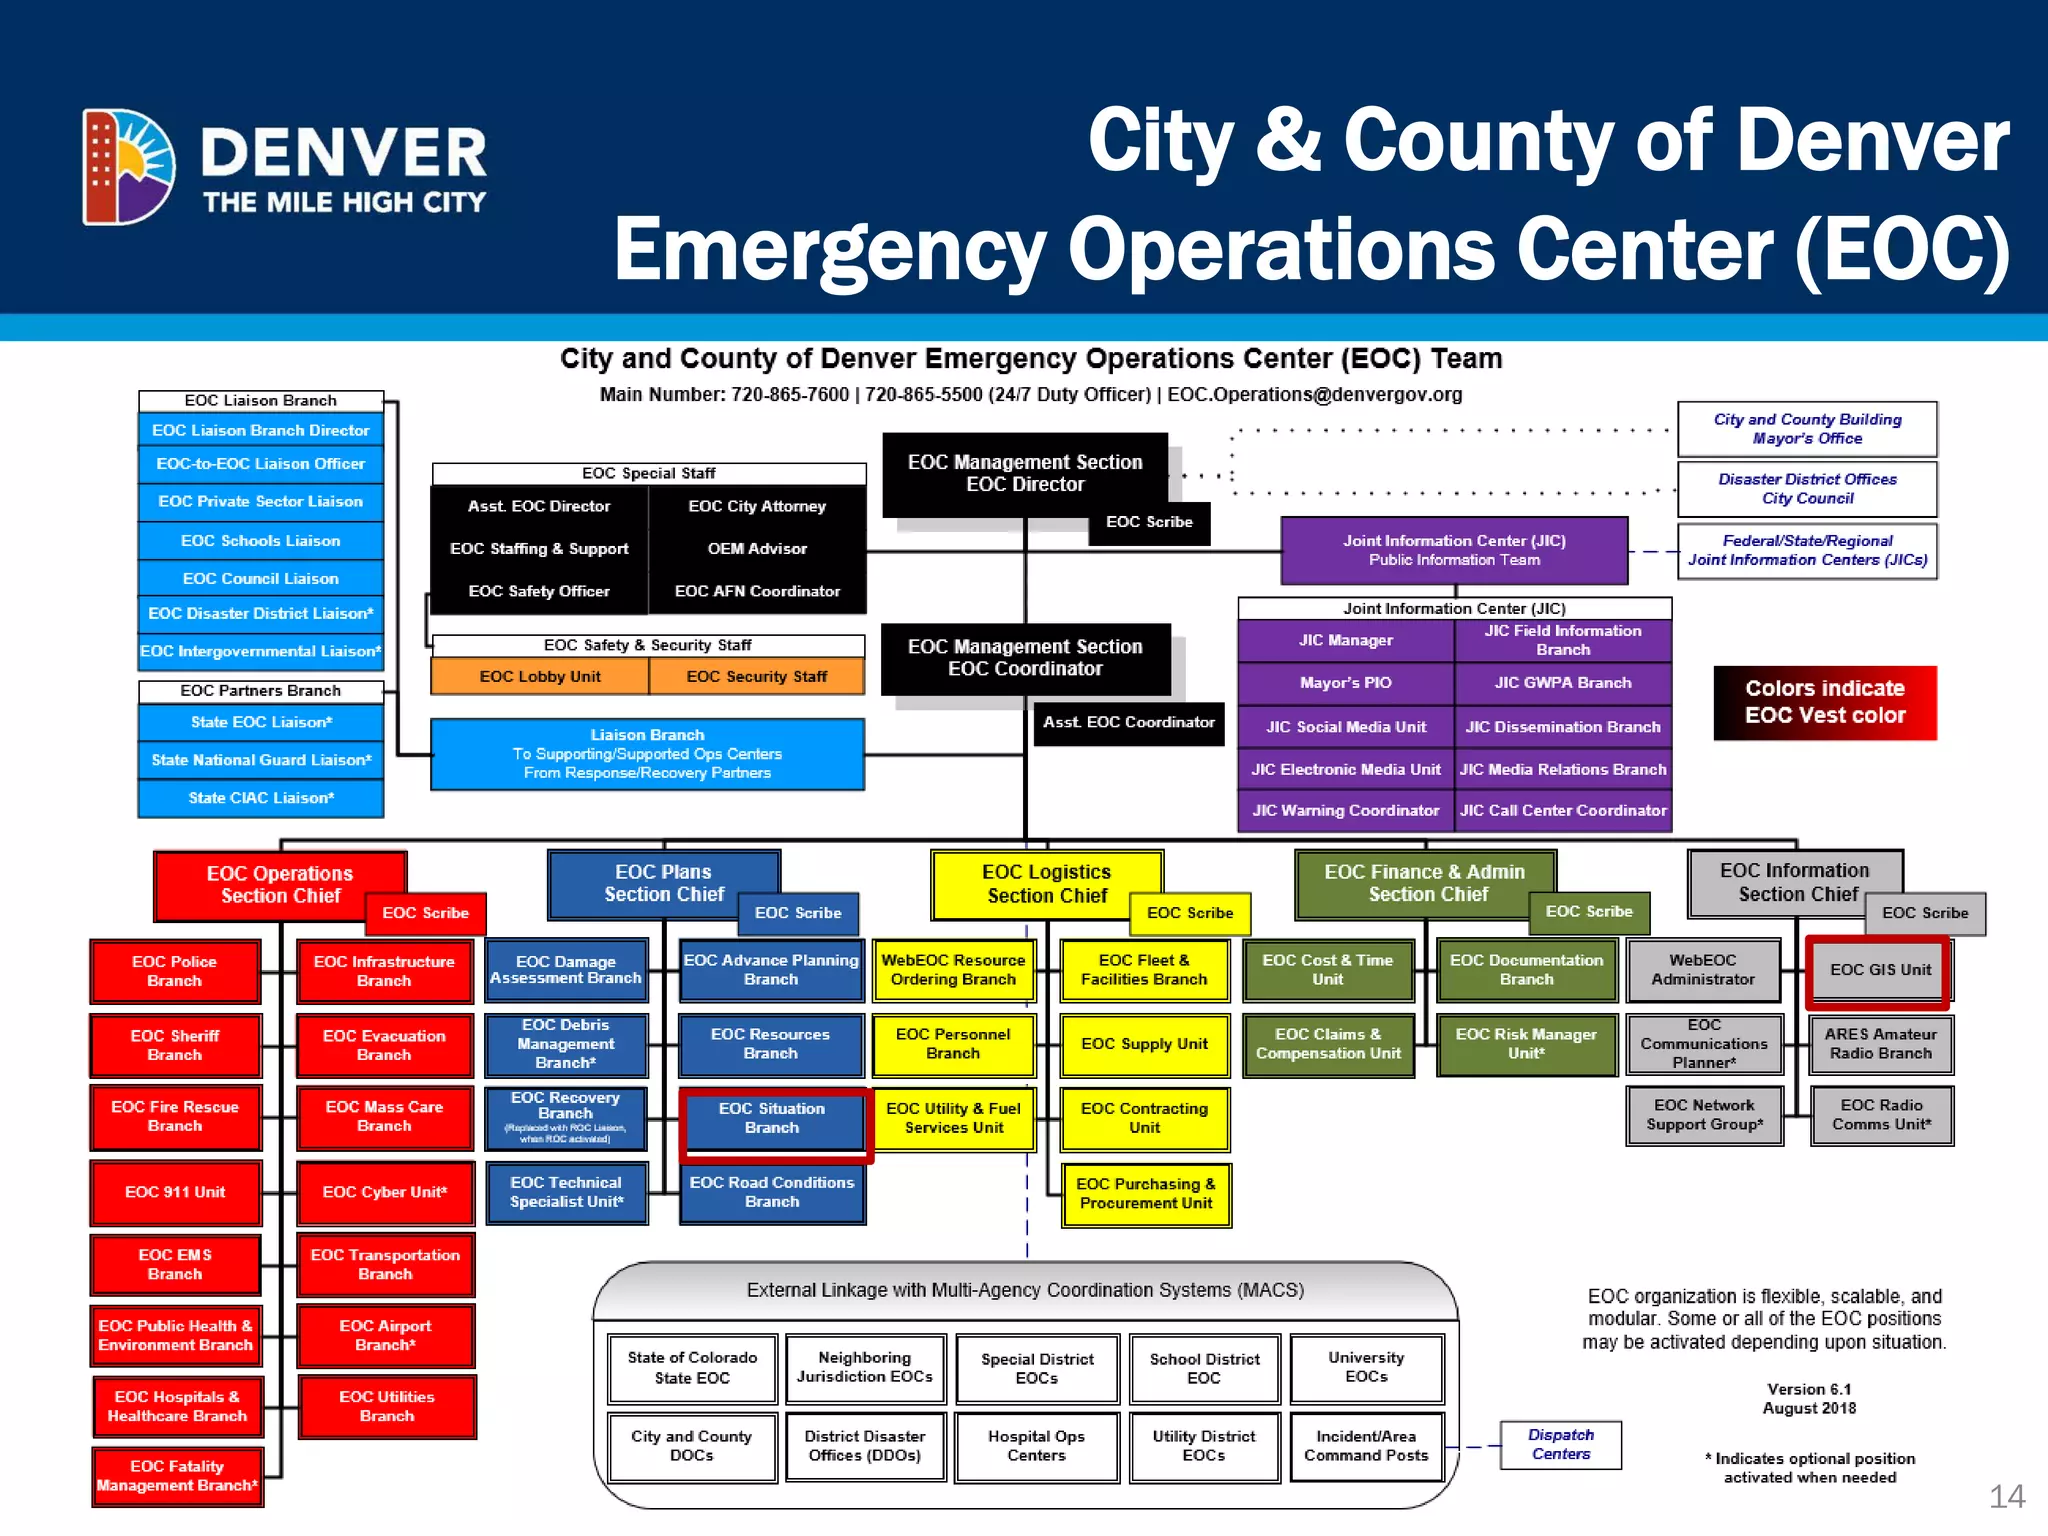
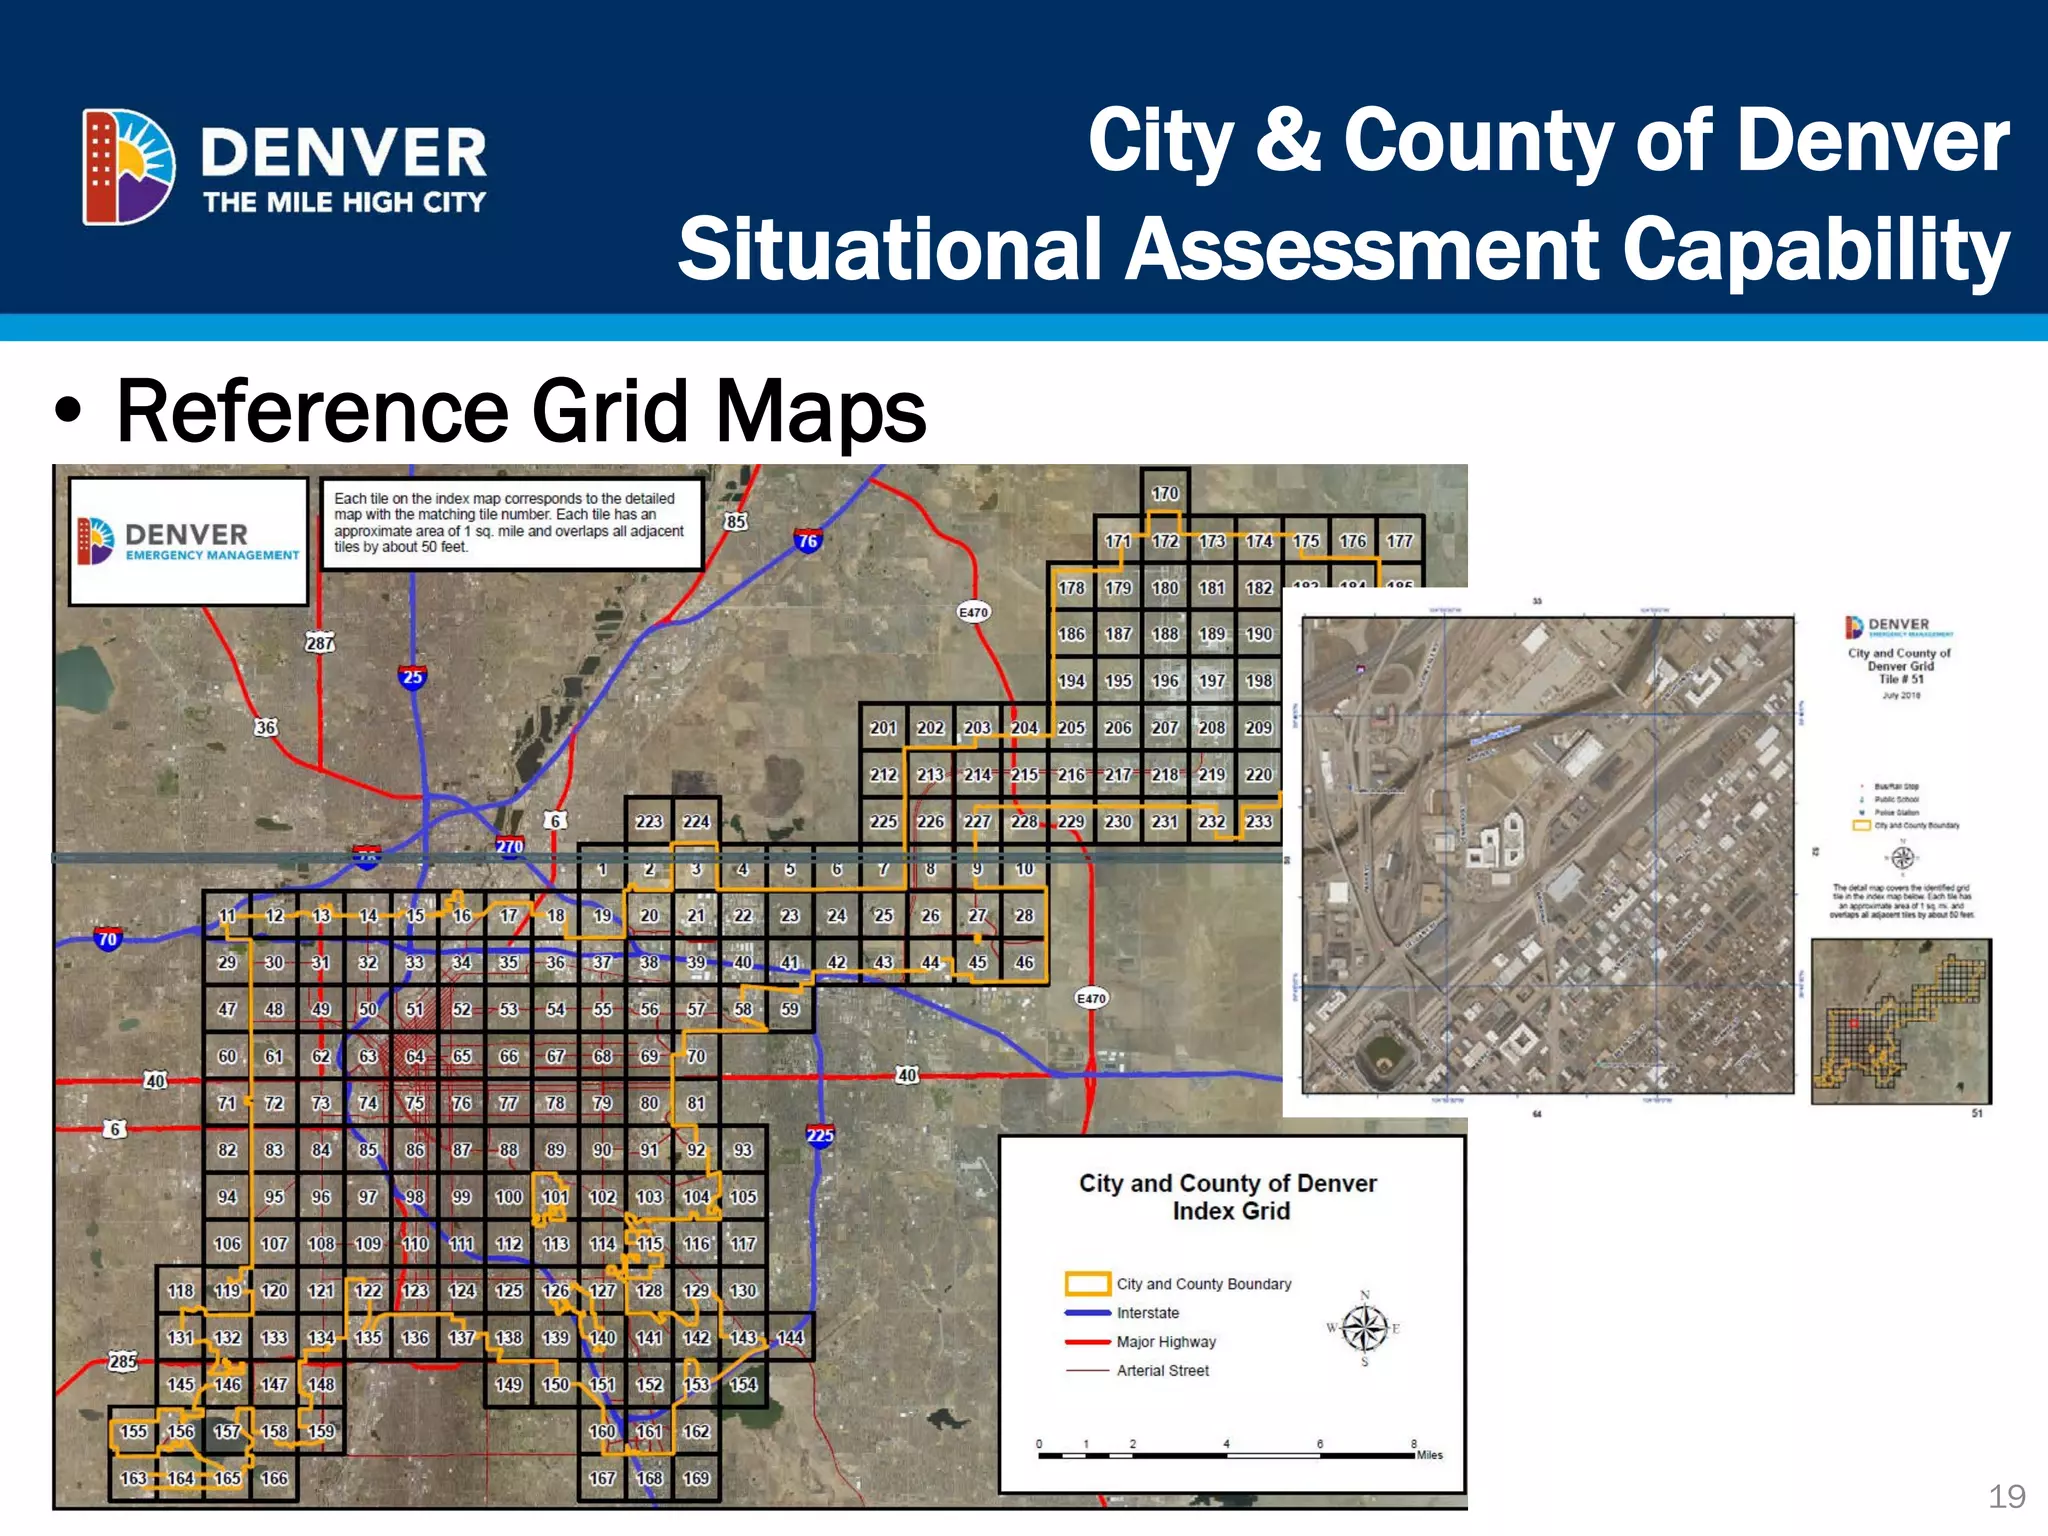
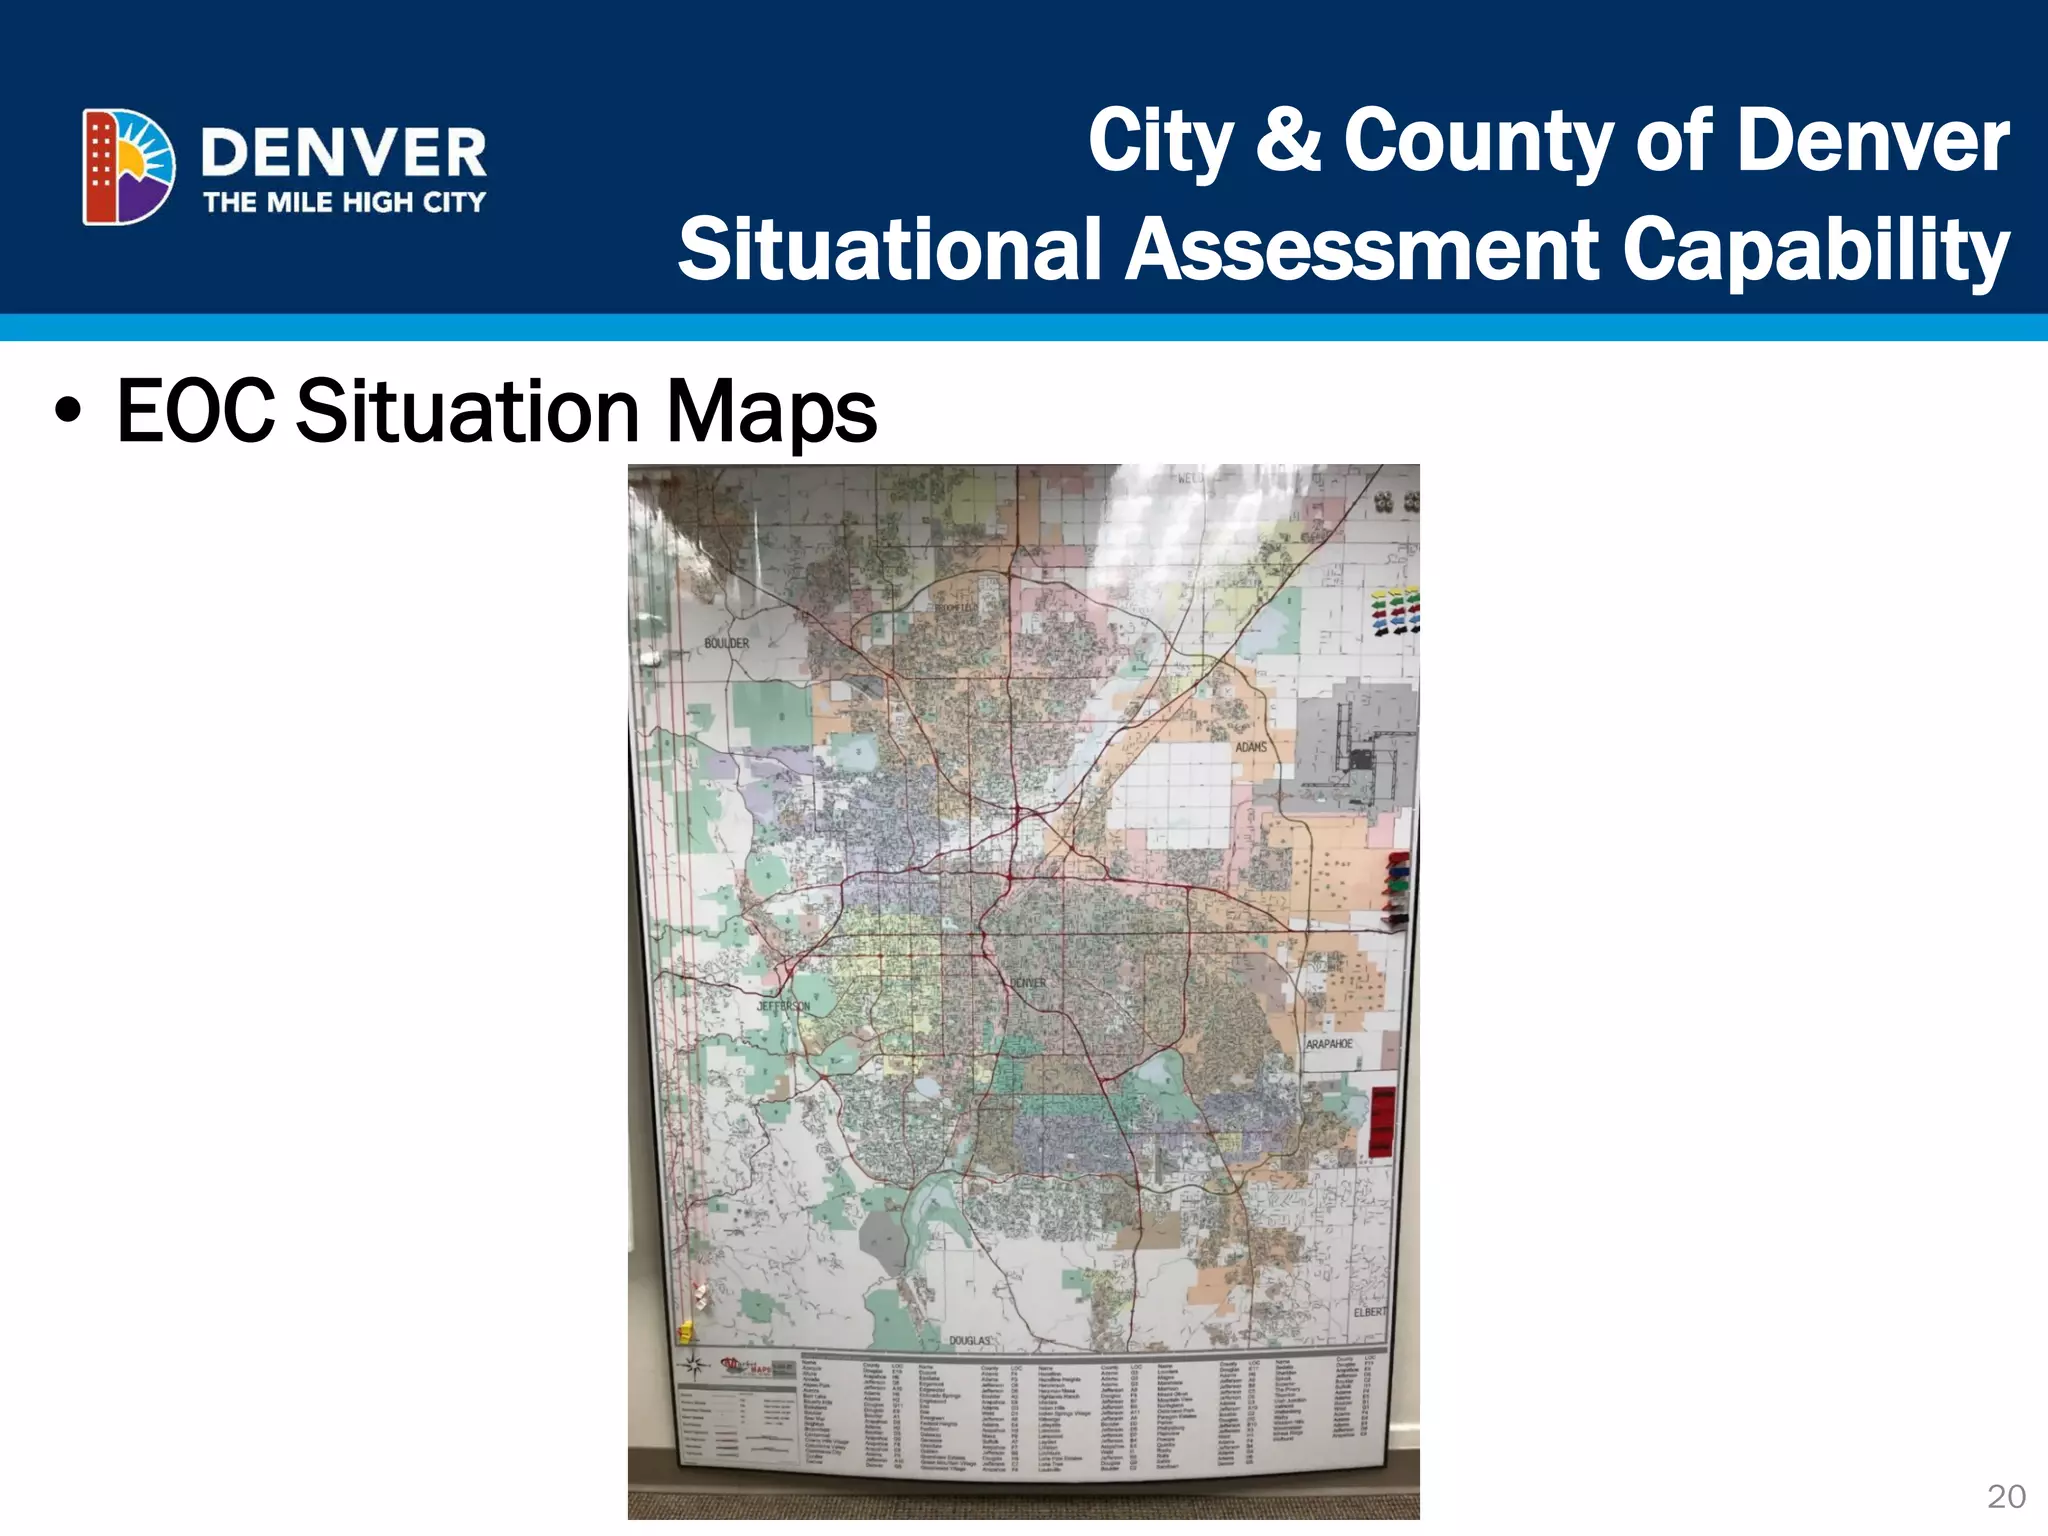
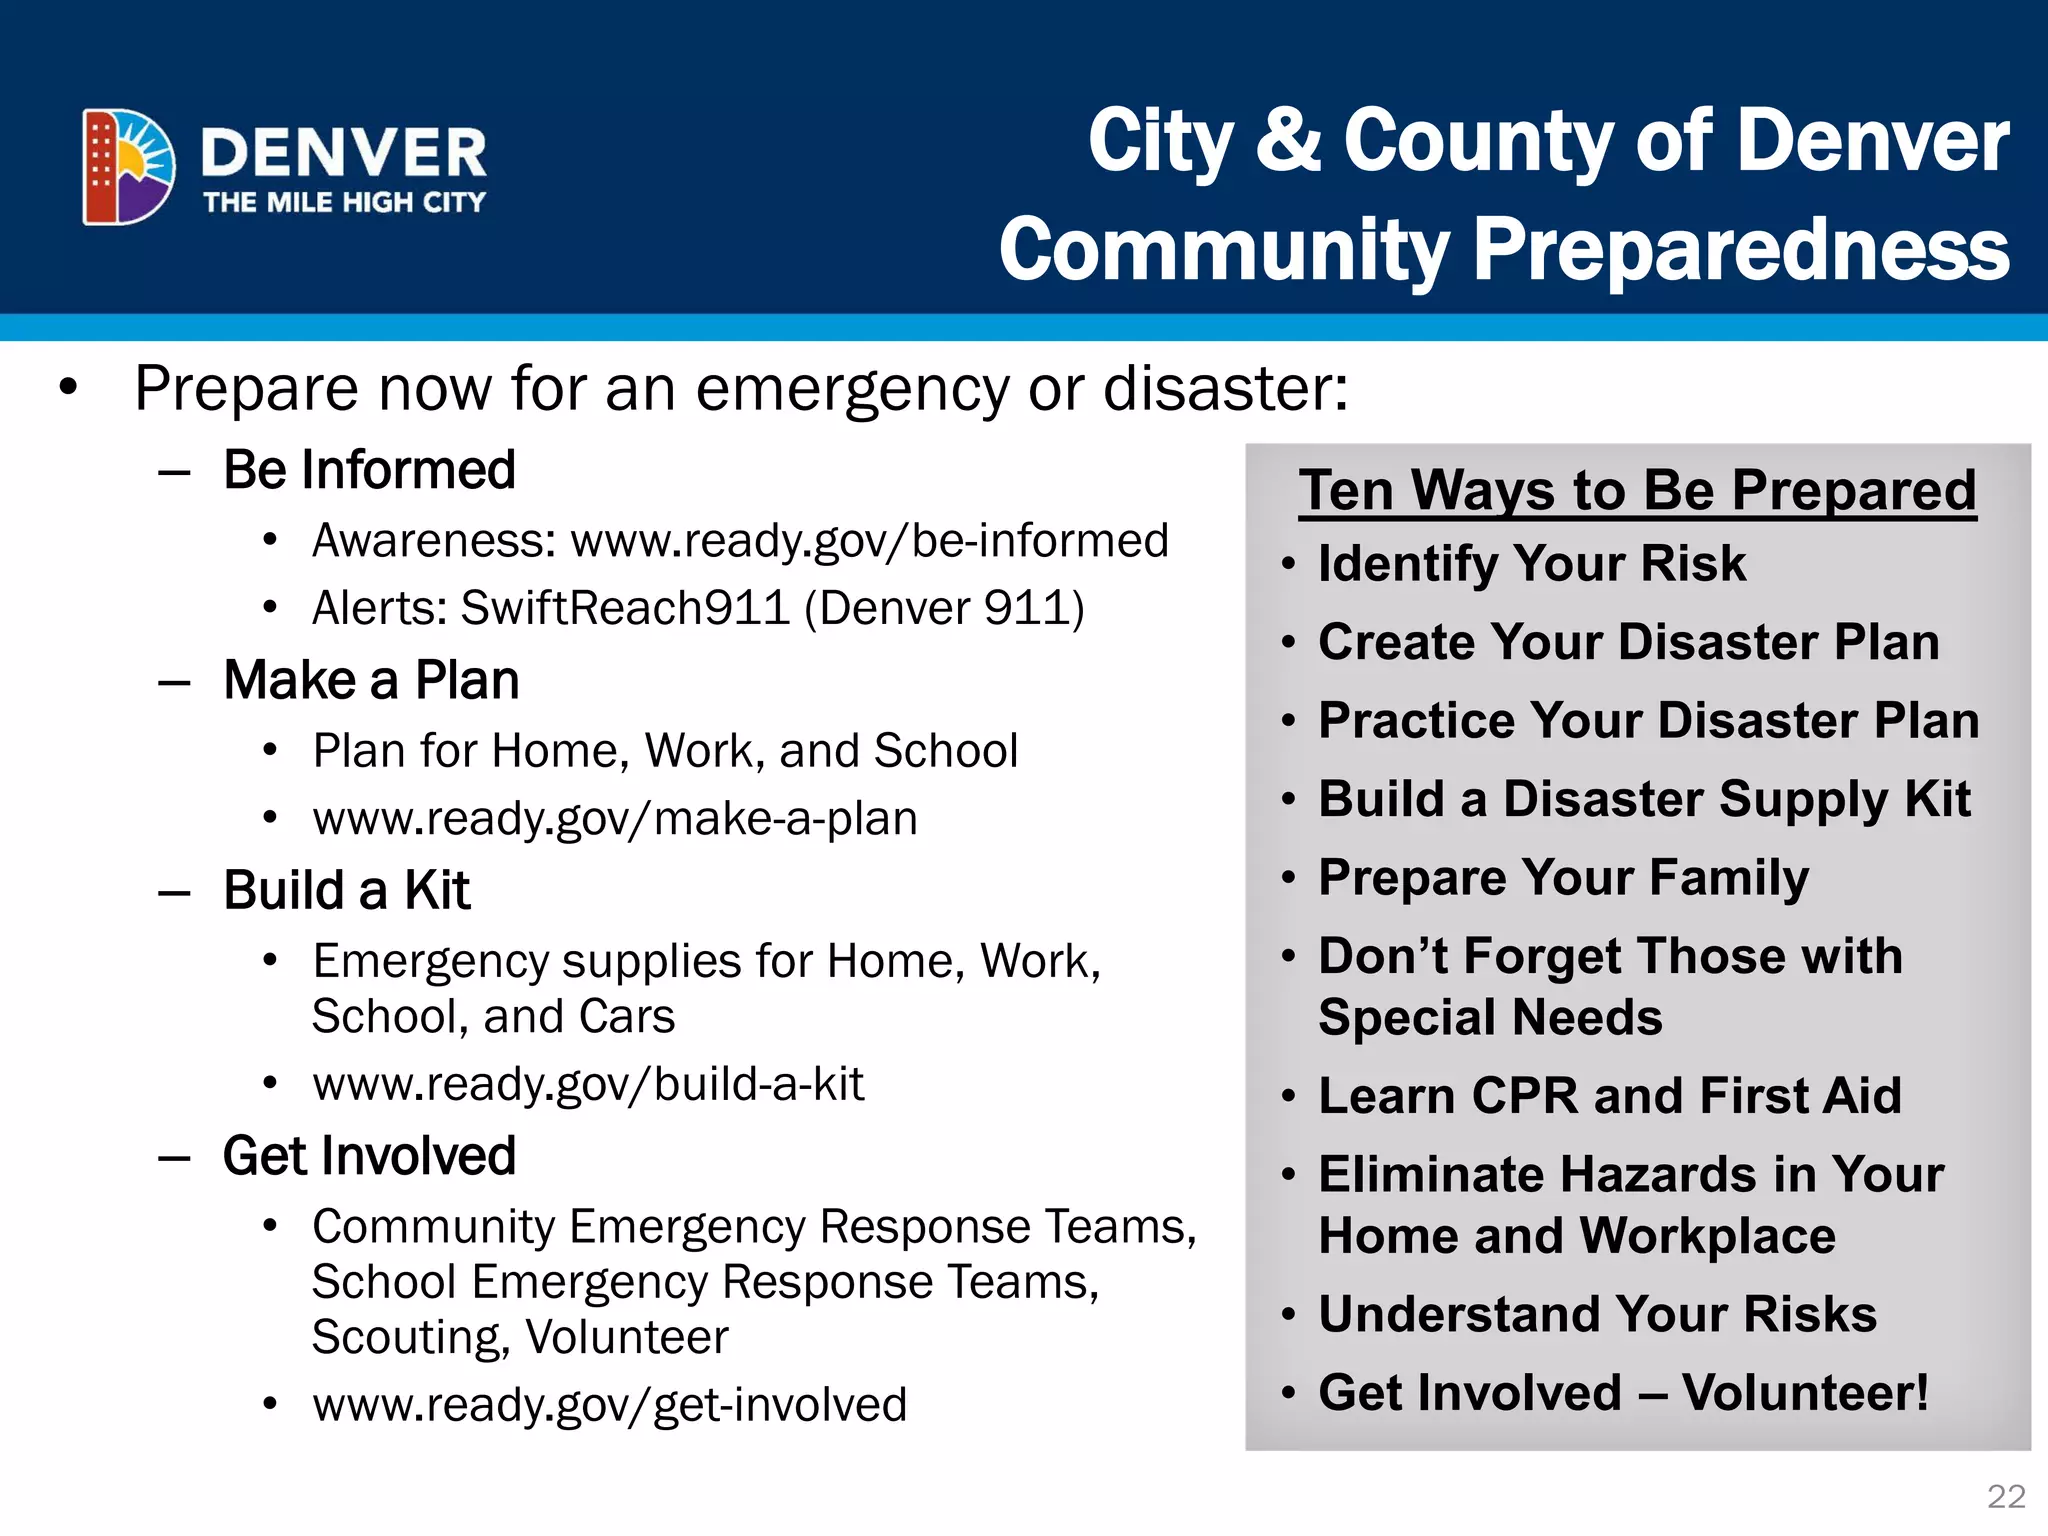
The document provides an overview of emergency management in Denver, Colorado. It details that Denver has a population of over 700,000 residents and hosts over 32 million visitors annually. It operates a 72-position Emergency Operations Center and utilizes geospatial technologies like GIS mapping to aid in situational awareness and emergency response. The document emphasizes preparing residents by encouraging them to be informed of risks, make an emergency plan, and build an emergency supply kit.
OEM Presentation - IA and Emergency ResponseNoreen Whysel
An introduction to Information Architecture and Emergency Response technologies presented at the NYC Office of Emergency Management for the Women's History Month Breakfast. This presentation is a companion to my IA Summit presentation Information Architecture and Emergency Response, which goes into more detail on the kinds of technologies used in Emergency Response.
Introduction to Machine Learning: An Application to Disaster ResponseMuhammad Imran
Introduction to Machine Learning talk (part-2) focused on the applications of machine learning in the disaster response domain. In the first part of the talk, we presented different machine learning approaches.
The Denver Federal Center (DFC) is a 623-acre federal facility adjacent to the foothills of the Colorado Rockies. With more than 55 active federal buildings and 6,500 weekly campus visitors there are many developments and history to be shared.
5th International Disaster and Risk Conference IDRC 2014 Integrative Risk Management - The role of science, technology & practice 24-28 August 2014 in Davos, Switzerland
Tools and processes in digital voluntarismperaarvik
Svend-Jonas Schelhorn at the seminar: Digital Humanitarianism and Networked Crisis Support, Bergen Academy of Art and Design, Bergen, Norway, 19th October 2013
Digital Humanitarians is a wide description of individuals and NGOs using digital tools for collaboration, mapping, analyzing or data-mining for humanitarian purposes and in humanitarian contexts. They typically engage for humanitarian crises, natural disasters, democracy projects, human rights monitoring or disaster preparedness. There are digital tools, procedures and ethical questions they all have in common.
Mayor Randy Holland's Presentation on how the City of Mayflower, Arkansas overcame three disasters in just a few years, including an EF5 tornado. This 2015 presentation also includes the progress made to rebuild and move forward. Also see http://cityofmayflower.com/presentation
Integrating Technology into Water Trail Managemetnt Practices - Walter Opusz...rshimoda2014
- NFCT Overview
- Compiling and Managing Trail Data
Defining Trail Standards and Staging Development: - Implementing a Water Recreation Opportunity Spectrum that fits your trail
- Using technology to communicate with various target audiences
Open Data Seminar
Department of Public Expenditure and Reform
D/Public Expenditure and reform, Government Buildings,
Merrion Street, Dublin 2
Conference Room 0.2, South Block
2.00pm, Wednesday 11 February 2015
Tracey P. Lauriault and Rob Kitchin
Programmable City Project, NIRSA, Maynooth University
5th International Disaster and Risk Conference IDRC 2014 Integrative Risk Management - The role of science, technology & practice 24-28 August 2014 in Davos, Switzerland
City of East Peoria State of the City 2014Jill Peterson
Learn how East Peoria fared in 2013 and what's in the works for 2014, presented March 7, 2014 during the East Peoria Chamber of Commerce's Eggs & Issues breakfast meeting. Every city department reviewed accomplishments and detailed future projects.
ISCRAM Asia 2014: Sahana Open Source Disaster Management System Overview and ...Chamindra de Silva
An overview of the Sahana Open Source disaster management system 10 years after the Tsunami and use since in 25+ countries globally both in disaster response and prepardness
GISCO Fall 2018: Bike Network Equity: A GIS and Qualitative Analysis of Ameri...GIS in the Rockies
The equitable distribution of bike paths ensuring safe cycling are inconsistently planned and evaluated. For residents to fully utilize bikes, it is essential that bike networks equitably serve all urban populations. In the absence of impartial evaluation, the construction of biking infrastructure may continue to perpetuate cycles of disadvantage. By measuring the spatial equity of six urban biking networks using GIS (San Francisco, Chicago, Minneapolis, Madison, Boulder and College Station) and interviewing transportation planners, we demonstrate that equity can play a role in planning. We provide spatial and qualitative analyses revealing varying relationships between urban transport planning and the relative equity of bike networks in major cities.
GISCO Fall 2018: Colorado 811: Changes and Challenges – Brian CollisonGIS in the Rockies
On May 25, Governor Hickenlooper signed Senate Bill 18-167 into law. This bill included the creation of the Underground Damage Prevention Safety Commission, effective August 8, 2018. The ratification of this law has started transitioning tier two members of the Utility Notification Center of Colorado, or Colorado 811, into tier one members. Safety and accuracy are some of the most challenging issues damage prevention professionals face. While the law will improve communication between all parties involved once it’s implemented, damage prevention work will drastically change over the next two years of transition. Join Brian Collison as he gives an overview of the changes, how tier two members can ease their transition to tier one and how this will affect anyone who works within right of ways in the state of Colorado.
More Related Content
Similar to 2018 GIS in Emergency Management: Denver Office of Emergency Management Overview
5th International Disaster and Risk Conference IDRC 2014 Integrative Risk Management - The role of science, technology & practice 24-28 August 2014 in Davos, Switzerland
Tools and processes in digital voluntarismperaarvik
Svend-Jonas Schelhorn at the seminar: Digital Humanitarianism and Networked Crisis Support, Bergen Academy of Art and Design, Bergen, Norway, 19th October 2013
Digital Humanitarians is a wide description of individuals and NGOs using digital tools for collaboration, mapping, analyzing or data-mining for humanitarian purposes and in humanitarian contexts. They typically engage for humanitarian crises, natural disasters, democracy projects, human rights monitoring or disaster preparedness. There are digital tools, procedures and ethical questions they all have in common.
Mayor Randy Holland's Presentation on how the City of Mayflower, Arkansas overcame three disasters in just a few years, including an EF5 tornado. This 2015 presentation also includes the progress made to rebuild and move forward. Also see http://cityofmayflower.com/presentation
Integrating Technology into Water Trail Managemetnt Practices - Walter Opusz...rshimoda2014
- NFCT Overview
- Compiling and Managing Trail Data
Defining Trail Standards and Staging Development: - Implementing a Water Recreation Opportunity Spectrum that fits your trail
- Using technology to communicate with various target audiences
Open Data Seminar
Department of Public Expenditure and Reform
D/Public Expenditure and reform, Government Buildings,
Merrion Street, Dublin 2
Conference Room 0.2, South Block
2.00pm, Wednesday 11 February 2015
Tracey P. Lauriault and Rob Kitchin
Programmable City Project, NIRSA, Maynooth University
5th International Disaster and Risk Conference IDRC 2014 Integrative Risk Management - The role of science, technology & practice 24-28 August 2014 in Davos, Switzerland
City of East Peoria State of the City 2014Jill Peterson
Learn how East Peoria fared in 2013 and what's in the works for 2014, presented March 7, 2014 during the East Peoria Chamber of Commerce's Eggs & Issues breakfast meeting. Every city department reviewed accomplishments and detailed future projects.
ISCRAM Asia 2014: Sahana Open Source Disaster Management System Overview and ...Chamindra de Silva
An overview of the Sahana Open Source disaster management system 10 years after the Tsunami and use since in 25+ countries globally both in disaster response and prepardness
GISCO Fall 2018: Bike Network Equity: A GIS and Qualitative Analysis of Ameri...GIS in the Rockies
The equitable distribution of bike paths ensuring safe cycling are inconsistently planned and evaluated. For residents to fully utilize bikes, it is essential that bike networks equitably serve all urban populations. In the absence of impartial evaluation, the construction of biking infrastructure may continue to perpetuate cycles of disadvantage. By measuring the spatial equity of six urban biking networks using GIS (San Francisco, Chicago, Minneapolis, Madison, Boulder and College Station) and interviewing transportation planners, we demonstrate that equity can play a role in planning. We provide spatial and qualitative analyses revealing varying relationships between urban transport planning and the relative equity of bike networks in major cities.
GISCO Fall 2018: Colorado 811: Changes and Challenges – Brian CollisonGIS in the Rockies
On May 25, Governor Hickenlooper signed Senate Bill 18-167 into law. This bill included the creation of the Underground Damage Prevention Safety Commission, effective August 8, 2018. The ratification of this law has started transitioning tier two members of the Utility Notification Center of Colorado, or Colorado 811, into tier one members. Safety and accuracy are some of the most challenging issues damage prevention professionals face. While the law will improve communication between all parties involved once it’s implemented, damage prevention work will drastically change over the next two years of transition. Join Brian Collison as he gives an overview of the changes, how tier two members can ease their transition to tier one and how this will affect anyone who works within right of ways in the state of Colorado.
GISCO Fall 2018: Senate Bill 18-167 and GIS – Dave MurrayGIS in the Rockies
The recently passed Senate Bill 18-167 has many new provisions that could impact the GIS community and location of in-ground infrastructure. Find out about how this bill might impact your organization.
2018 GIS in the Rockies Vendor Showcase (Th): The Data Driven GovernmentGIS in the Rockies
Today, GIS is not just software. It’s data. It’s people. It’s getting to the answer. Quicker. Data is expanding. More users demand access to information but don’t consume the information in the same way as a GIS professional would. But as curators and managers of geospatial information, GIS professionals are looking to support the entire organizational needs not just those in GIS Departments. The chief information officer is acutely aware of how much geospatial data is being collected; now, how do city and state governments leverage these data for smarter, more effective government services. Here are five pillars of the data-driven government to consider:
1. Extensibility: Whatever the choice, the platform must be customizable for users beyond the GIS department. Knowledge workers need access to geospatial technology too.
2. Usability: GIS is a complex tool. However, today’s desktop platform must be adaptable to many types of workflows.
3. Flexibility: The next generation of geospatial solutions must be ready to support the desktop, cloud, SaaS as well as mobile platforms. GIS must adapt to the user’s preferred IT environment…not the other way around.
4. Compatibility: GIS must work in mixed environments of open source and commercial software and ingest data from myriad sources.
5. Expandability: Can your GIS environment work in the world of big data? Smart cities depend on ingesting sensor data produced at high rates that require geoprocessing on a scale not thought possible until recently.
2018 GIS in the Rockies Vendor Showcase (Th): Solving Real World Issues With ...GIS in the Rockies
With the proliferation of location-aware mobile devices and the emergence of everyday analytics, geospatial technology now spans every market, crosses national boundaries, and affects every trending issue. There is no doubt that cloud-based solutions are increasing in demand, requiring next generation, customizable technology to harness multisource data and transform it into focused solutions to be consumed by users of every level. The M.App Portfolio platform is designed to create smart, lightweight, customized market applications that address unique business and industry problems by combining geospatial analytics with cloud technology, as well as enterprise-level deployment environments. These applications, known as Hexagon Smart M.Apps, link sophisticated analytics and spatial models to geospatially relevant information, conveying data about solutions through intuitive, customizable, interactive and innovative displays. In this presentation, you will see several Smart M.Apps in action to better understand how this platform is changing the way we visualize, interpret, and interact with spatial information. Learn how Hexagon Geospatial has teamed with the World Antiquities Coalition to use Smart M.App technology to track missing and stolen cultural artifacts. See how the Green Space Analyzer provides a new way for decision makers to influence policy. Understand how a Smart M.App helps count endangered species in Africa. See how Smart M.Apps address the problems of refugee camps and can be used in country-wide census. Hexagon Geospatial’s technology provides the ability to address the challenge of linking business information with multisource multi-sensor data, in near real-time to answer questions and make decisions about our dynamically changing Earth.
2018 GIS in the Rockies Vendor Showcase (Th): ERDAS Imagine What's New and Ti...GIS in the Rockies
This presentation will cover the latest release highlights as well as tips and tricks for processing LiDAR data, ERDAS Imagine modeling capabilities and a roadmap for cloud based processing.
The session will highlight exploiting the full spectrum of LiDAR from viewing and measurements to surface and terrain modeling as well as extraction of point clouds from imagery.
In addition we will discuss the migration of our image exploitation capabilities from the desktop to the cloud.
2018 GIS in the Rockies Vendor Showcase (Th): Building High Performance Gover...GIS in the Rockies
With thousands of citizens relying on your city's GIS and related technology, a lot is resting on your shoulders. Your team works day and night to map and maintain millions of dollars in infrastructure assets, plan for the future, and keep your residents safe and informed. But, how do you keep up when budget cuts, disasters, and staff changes are thrown into the mix?
During this session, you’ll learn how to build effective, innovative GIS teams and implement efficient processes. In addition, you’ll uncover the 5 reasons why local government agencies are working to become high performing, plus expert tips to help you get started on your journey today.
As a part of a joint effort between the Town of Silverthorne and the Summit Sky Ranch development, Allpoints GIS and Contour Logic were contracted to provide trail planning services on private and National Forest lands. Several variables presented challenges that required detailed planning work. Lidar data analysis, 3D web scenes, survey data, high resolution web maps, and ArcGIS Collector in the field were all employed in a joint desktop and field GIS effort to create trail plans. I will detail our GIS methods and products from this project from start to finish.
2018 GIS in Recreation: The Latest Trail Technology Crowdsourcing Maps and AppsGIS in the Rockies
Americans are increasingly recognizing the health, quality of life, environmental, and economic benefits that trails and active transportation offer. As a result, now more than ever it’s important to connect people to our trails, improve the planning of new trails, and better understand how visitors use trails.
For this session, we’ll explore what role technology plays in how people engage with trails. How can land managers utilize technology to publish better information to their visitors and also understand who’s engaging with their recreational infrastructure? Learn how to reach and understand new audiences, using everything from apps that get people outdoors to crowdsourced data.
2018 GIS in the Rockies: Riparian Shrub Assessment of the Mancos River Canyon...GIS in the Rockies
The Mancos River is the only perennial stream of Mesa Verde National Park and is a vital water source for flora and fauna. Mapping of the riparian shrubs is an important component to understanding the ecological state of the riparian zone, and will ultimately be used to inform future land management and restoration decisions.
2018 GIS in Development: Partnerships Lead to Additional Recreational Content...GIS in the Rockies
In 2010, the USGS National Geospatial Program (NGP) began producing the new US Topo map series. The first maps were relatively simple, but quality and content have continually improved. Recreational features, especially trails, are among the most often requested features, but have been difficult to add due to lack of national datasets. Some trails in National Forests were added in 2014. In 2015 the USGS partnered with the International Mountain Biking Association (REI-Adventure Projects) to include trails outside of Federal lands. A pilot project with the National Park Service in 2016 added trails, visitor centers, trailheads, and campgrounds to US Topo maps covering the Great Smoky Mountains National Park. 2018 US Topo maps include trails, trailheads, campgrounds, picnic areas, visitor centers, and other recreation information on selected Federal lands, using data provided by the relevant agencies. Continuing into the future, the USGS is working on partnerships with states and other organizations including The National Map Corps to expand recreational features to non-Federal lands. All such data will be in the public domain and published in The National Map geospatial databases.
2018 GIS in Recreation: Adding Value to Colorado the Beautiful Initiative carrGIS in the Rockies
The main point of this abstract is increasing the value of the current Colorado the Beautiful Initiative through additional data points gathered by mapping the trail systems with the use of unmanned aerial systems and 3rd party software to build the additional data points to be included in the current mapped environment.
I have used Unmanned Aerial Systems and 3rd Party Mapping Software Companies (DroneDeploy, Precision Hawk, Pix4D, and DroneMapper) to build sample data to support my work
I have been able to create sample maps, photos, video of certain trail sections to show how additional data sets can be included to increase the value of the initiative for both the public and government sectors
With the data I have collected, I can discuss several points of interest with the conference. I can show how the data can be utilized to benefit the public sector: Safety, knowledge, and planning and the government sector: trail maintenance, anticipating future problems- heavy traffic areas or lost hikers, plant health - fire danger and erosion, and intersection of multiple agency and private land area issues.
The City of Manitou Springs is planning a creek walk along Fountain Creek, an aspirational goal for over two decades. The question is: how to unite a diverse set of stakeholders with competing interests to agree on a preferred route, that incorporates their values and priorities? The answer was to use geodesign.
Geodesign is a powerful participatory planning method that uses stakeholder input and geospatial analytics to show the possible impact of design scenarios. It gets its strength in two ways: 1) from the diversity of participants—proving the adage that two heads are indeed better than one—and 2) from the power of spatial analytics, which allow the visualization of the world both as it is, and as it could be.
The presentation will focus on how geodesign methods where used to define stakeholder groups, clarify values, and prioritize criteria to help decision makers evaluate planning scenarios. Esri ArcGIS Pro was utilized to develop models—such as bikeability, walkability, ADA compliance, and more—that were used to both visualize and evaluate the impacts of each route segment. The spatial analysis resulted in an innovative solution that addressed both the concerns of both government and public stakeholders.
Attendees of this session will learn how to use geodesign as a systems approach for informed decision-making. More importantly, they will learn how to use spatial technology to guide conversations among diverse stakeholders to come up with plans that people understand and are happy with.
2018 GIS in Recreation: Virtually Touring the National TrailsGIS in the Rockies
Terrain360 has been commissioned to create a 360° “streetview” map of the Captain John Smith National Scenic Trail, Huron River Water Trail, Lake Huron, Lake St. Clair, Detroit River and other important waterways in 2018.We will be discussing the technical and mechanical challenges of capturing/managing massive amounts of GIS data and imagery from these projects. We will also discuss dissemination of the data on a forward facing exploration tool.
The Public Land Survey System (PLSS), which is the basis of land surveying in the western United States will be presented and will include how the system was developed, why it is important to the public, surveying and GIS communities and the appropriate use of the system in order to describe parcels of land. The attendees will lean the basics of the system from the founding fathers to requirements of the State of Colorado regarding the PLSS.
2018 GIS in the Rockies PLSC Track: Grid to Ground NATRF2022GIS in the Rockies
Here at altitude, if distances between points matter to you, correctly scaling your coordinates to ground is necessary. This presentation will address the modification of common map projections, how to compute and apply a combined adjusted scale factor, and an introduction to the North American Terrestrial Reference Frame of 2022, replacing NAD83 and NAVD88. Are you ready?
2018 GIS in Development: USGS and Citizen Science Success and Enhancements fo...GIS in the Rockies
The National Map Corps (TNMCorps) is a U.S. Geological Survey (USGS) citizen science project that uses crowdsourcing techniques to update structures data for The National Map and U.S. Topo maps. Using an online mapping application, volunteers confirm or update structures such as hospitals, cemeteries, post offices, schools, law enforcement, and fire stations.
Since its initiation in 2010 and nation-wide expansion in 2013, TNMCorps has evolved to become a stable and productive citizen science project. A new and internally-developed web application was launched in 2016. TNMCorps has also broadened the variety of approaches used to engage with volunteers. As a testimony to its success, TNMCorps recently passed a major milestone, with volunteers having collected more than 300,000 points. This presentation will provide an overview of the TNMCorps project as a whole while briefing audience members on milestones and enhancements.
A semantic web is a relativity modern technology coined by Sir Tim Berners-Lee in 2001. Web 2.0 is readable by humans. We have HTML 5 and CSS and it does a great job of allowing information to be read by humans. Where web 2.0 fails is supporting machine reading. This then brings up web 3.0. Being able to support data is great, but often what we are most interested in is not the data itself, but the relationships between and among data. Think about how hard it is currently to get all water features. Those features are often in different services and provided by different organizations. I want to quickly and easily get all water features nationally. This is where a semantic web would be very useful because one can store the relationships between data to give you all water features. This talk will show you some of the advantages of a semantic web and how it can be used to answer questions that one would struggle to answer without it.
GDG Cloud Southlake #33: Boule & Rebala: Effective AppSec in SDLC using Deplo...James Anderson
Effective Application Security in Software Delivery lifecycle using Deployment Firewall and DBOM
The modern software delivery process (or the CI/CD process) includes many tools, distributed teams, open-source code, and cloud platforms. Constant focus on speed to release software to market, along with the traditional slow and manual security checks has caused gaps in continuous security as an important piece in the software supply chain. Today organizations feel more susceptible to external and internal cyber threats due to the vast attack surface in their applications supply chain and the lack of end-to-end governance and risk management.
The software team must secure its software delivery process to avoid vulnerability and security breaches. This needs to be achieved with existing tool chains and without extensive rework of the delivery processes. This talk will present strategies and techniques for providing visibility into the true risk of the existing vulnerabilities, preventing the introduction of security issues in the software, resolving vulnerabilities in production environments quickly, and capturing the deployment bill of materials (DBOM).
Speakers:
Bob Boule
Robert Boule is a technology enthusiast with PASSION for technology and making things work along with a knack for helping others understand how things work. He comes with around 20 years of solution engineering experience in application security, software continuous delivery, and SaaS platforms. He is known for his dynamic presentations in CI/CD and application security integrated in software delivery lifecycle.
Gopinath Rebala
Gopinath Rebala is the CTO of OpsMx, where he has overall responsibility for the machine learning and data processing architectures for Secure Software Delivery. Gopi also has a strong connection with our customers, leading design and architecture for strategic implementations. Gopi is a frequent speaker and well-known leader in continuous delivery and integrating security into software delivery.
Accelerate your Kubernetes clusters with Varnish CachingThijs Feryn
A presentation about the usage and availability of Varnish on Kubernetes. This talk explores the capabilities of Varnish caching and shows how to use the Varnish Helm chart to deploy it to Kubernetes.
This presentation was delivered at K8SUG Singapore. See https://feryn.eu/presentations/accelerate-your-kubernetes-clusters-with-varnish-caching-k8sug-singapore-28-2024 for more details.
Transcript: Selling digital books in 2024: Insights from industry leaders - T...BookNet Canada
The publishing industry has been selling digital audiobooks and ebooks for over a decade and has found its groove. What’s changed? What has stayed the same? Where do we go from here? Join a group of leading sales peers from across the industry for a conversation about the lessons learned since the popularization of digital books, best practices, digital book supply chain management, and more.
Link to video recording: https://bnctechforum.ca/sessions/selling-digital-books-in-2024-insights-from-industry-leaders/
Presented by BookNet Canada on May 28, 2024, with support from the Department of Canadian Heritage.
Slack (or Teams) Automation for Bonterra Impact Management (fka Social Soluti...Jeffrey Haguewood
Sidekick Solutions uses Bonterra Impact Management (fka Social Solutions Apricot) and automation solutions to integrate data for business workflows.
We believe integration and automation are essential to user experience and the promise of efficient work through technology. Automation is the critical ingredient to realizing that full vision. We develop integration products and services for Bonterra Case Management software to support the deployment of automations for a variety of use cases.
This video focuses on the notifications, alerts, and approval requests using Slack for Bonterra Impact Management. The solutions covered in this webinar can also be deployed for Microsoft Teams.
Interested in deploying notification automations for Bonterra Impact Management? Contact us at sales@sidekicksolutionsllc.com to discuss next steps.
Key Trends Shaping the Future of Infrastructure.pdfCheryl Hung
Keynote at DIGIT West Expo, Glasgow on 29 May 2024.
Cheryl Hung, ochery.com
Sr Director, Infrastructure Ecosystem, Arm.
The key trends across hardware, cloud and open-source; exploring how these areas are likely to mature and develop over the short and long-term, and then considering how organisations can position themselves to adapt and thrive.
Encryption in Microsoft 365 - ExpertsLive Netherlands 2024Albert Hoitingh
In this session I delve into the encryption technology used in Microsoft 365 and Microsoft Purview. Including the concepts of Customer Key and Double Key Encryption.
Builder.ai Founder Sachin Dev Duggal's Strategic Approach to Create an Innova...Ramesh Iyer
In today's fast-changing business world, Companies that adapt and embrace new ideas often need help to keep up with the competition. However, fostering a culture of innovation takes much work. It takes vision, leadership and willingness to take risks in the right proportion. Sachin Dev Duggal, co-founder of Builder.ai, has perfected the art of this balance, creating a company culture where creativity and growth are nurtured at each stage.
Smart TV Buyer Insights Survey 2024 by 91mobiles.pdf91mobiles
91mobiles recently conducted a Smart TV Buyer Insights Survey in which we asked over 3,000 respondents about the TV they own, aspects they look at on a new TV, and their TV buying preferences.
The Art of the Pitch: WordPress Relationships and SalesLaura Byrne
Clients don’t know what they don’t know. What web solutions are right for them? How does WordPress come into the picture? How do you make sure you understand scope and timeline? What do you do if sometime changes?
All these questions and more will be explored as we talk about matching clients’ needs with what your agency offers without pulling teeth or pulling your hair out. Practical tips, and strategies for successful relationship building that leads to closing the deal.
Software Delivery At the Speed of AI: Inflectra Invests In AI-Powered QualityInflectra
In this insightful webinar, Inflectra explores how artificial intelligence (AI) is transforming software development and testing. Discover how AI-powered tools are revolutionizing every stage of the software development lifecycle (SDLC), from design and prototyping to testing, deployment, and monitoring.
Learn about:
• The Future of Testing: How AI is shifting testing towards verification, analysis, and higher-level skills, while reducing repetitive tasks.
• Test Automation: How AI-powered test case generation, optimization, and self-healing tests are making testing more efficient and effective.
• Visual Testing: Explore the emerging capabilities of AI in visual testing and how it's set to revolutionize UI verification.
• Inflectra's AI Solutions: See demonstrations of Inflectra's cutting-edge AI tools like the ChatGPT plugin and Azure Open AI platform, designed to streamline your testing process.
Whether you're a developer, tester, or QA professional, this webinar will give you valuable insights into how AI is shaping the future of software delivery.
LF Energy Webinar: Electrical Grid Modelling and Simulation Through PowSyBl -...DanBrown980551
Do you want to learn how to model and simulate an electrical network from scratch in under an hour?
Then welcome to this PowSyBl workshop, hosted by Rte, the French Transmission System Operator (TSO)!
During the webinar, you will discover the PowSyBl ecosystem as well as handle and study an electrical network through an interactive Python notebook.
PowSyBl is an open source project hosted by LF Energy, which offers a comprehensive set of features for electrical grid modelling and simulation. Among other advanced features, PowSyBl provides:
- A fully editable and extendable library for grid component modelling;
- Visualization tools to display your network;
- Grid simulation tools, such as power flows, security analyses (with or without remedial actions) and sensitivity analyses;
The framework is mostly written in Java, with a Python binding so that Python developers can access PowSyBl functionalities as well.
What you will learn during the webinar:
- For beginners: discover PowSyBl's functionalities through a quick general presentation and the notebook, without needing any expert coding skills;
- For advanced developers: master the skills to efficiently apply PowSyBl functionalities to your real-world scenarios.
JMeter webinar - integration with InfluxDB and GrafanaRTTS
Watch this recorded webinar about real-time monitoring of application performance. See how to integrate Apache JMeter, the open-source leader in performance testing, with InfluxDB, the open-source time-series database, and Grafana, the open-source analytics and visualization application.
In this webinar, we will review the benefits of leveraging InfluxDB and Grafana when executing load tests and demonstrate how these tools are used to visualize performance metrics.
Length: 30 minutes
Session Overview
-------------------------------------------
During this webinar, we will cover the following topics while demonstrating the integrations of JMeter, InfluxDB and Grafana:
- What out-of-the-box solutions are available for real-time monitoring JMeter tests?
- What are the benefits of integrating InfluxDB and Grafana into the load testing stack?
- Which features are provided by Grafana?
- Demonstration of InfluxDB and Grafana using a practice web application
To view the webinar recording, go to:
https://www.rttsweb.com/jmeter-integration-webinar
GraphRAG is All You need? LLM & Knowledge GraphGuy Korland
Guy Korland, CEO and Co-founder of FalkorDB, will review two articles on the integration of language models with knowledge graphs.
1. Unifying Large Language Models and Knowledge Graphs: A Roadmap.
https://arxiv.org/abs/2306.08302
2. Microsoft Research's GraphRAG paper and a review paper on various uses of knowledge graphs:
https://www.microsoft.com/en-us/research/blog/graphrag-unlocking-llm-discovery-on-narrative-private-data/
2. City & County of Denver
Community Profile
• “Mile High City” (5280ft)
• 2016 “Best Place to Live”
• $180B metro economy (~Greece)
• 155 square miles (249 km2)
– Plus 14,000 acres of Mountain Parks
• Geographic Isolation
– Largest city in 500 mile radius
2
3. City & County of Denver
Community Profile
• 704,621 residents
– 19th Largest U.S. City
– 1M daytime population
– 32.5M annual visitors
– 2.8M in Denver Metro
– 3.4M in Denver CSA
– 32% speak English as
second language
• 78 Neighborhoods
• 11 Council Districts
3
4. City & County of Denver
Community Profile
• 67,500 businesses
• Denver International Airport
– 5th Busiest U.S. Airport
– 20th Busiest World Airport
– 61.4 million passengers in 2017
– 2.59M international passengers
• Denver Mountain Parks
– Red Rocks Park
– Winter Park Resort
• 700+ Special Events in
public spaces
4
5. City & County of Denver
Emergency Management Infographic
5
6. City & County of Denver
Emergency Management Strategy
6
7. City & County of Denver
Risk Management
• Denver Risk Management
– OEM manages multi-
agency risks from natural,
technological, terrorism,
and intentional threats and
hazards
– Focused on prevention,
protection, mitigation,
response, and recovery
operations
• Disease Outbreak/Bioterrorism
• Hazardous Materials Incident
• Terrorism
• Flooding (Dam Failure)
• Destructive Weather
• Utilities Interruption/Failure
• National State of Emergency
• Earthquake
• Fire (Structural, Industrial, Wildland)
• Active Shooter
• Aviation Incident
• Cyberterrorism
• Drought
• Civil Unrest
• Ground Subsidence/Sinkholes
• Agricultural Disease Outbreak
• Cyber Crime
• Nuclear Weapon Accident/Incident 7
8. City & County of Denver
Emergency Management Planning
8
9. City & County of Denver
Emergency Management Capabilities
From Foundation…
… to Capstone …
… to Fully Integrated
• Federal (National Planning Frameworks)
• State (Colorado State Government)
• State Regions (Colorado All-Hazards Regions)
• Tribal
• County
• Local (City, Town)
• Non-governmental Organizations
• Facilities
• Businesses
• Private Industry
• Individual Residents
The use of a consistent
framework allows
organizations at all
levels to work together
more efficiently
9
10. City & County of Denver
Emergency Management Capabilities
10
• FEMA Core Capabilities
– 32 FEMA Core
Capabilities across 5
mission areas:
• Prevention
• Protection
• Mitigation
• Response
• Recovery
– Plus 2 local Denver
capabilities applied to
all 5 mission areas
• Continuity
• Program
Administration
11. City & County of Denver
Emergency Management Capabilities
11
• Each capability requires:
o Planning
o Organization
o Equipment
o Training
o Exercises & Evaluation
POETE Model
13. City & County of Denver
Emergency Operations Center (EOC)
• 72-position EOC for
Multi-Agency
Coordination
• 18-position Joint
Information Center
(JIC) for Emergency
Public Information
• Supporting
Departmental Ops
Centers (DOCs) 13
14. City & County of Denver
Emergency Operations Center (EOC)
14
15. City & County of Denver
Emergency Operations Center (EOC)
15
16. City & County of Denver
Situational Assessment Capability
16
• Pre-Emergency
– Community Profile
•Demographics
•Stakeholders
•Resources
– Risk Management
– Emergency Planning
– Mitigation Planning
17. City & County of Denver
Situational Assessment Capability
17
• Pre-Emergency Uses for GIS:
– Resource Visualization
– Stakeholder Visualization
– Hazard Visualization
– Impact Visualization
– Utility Service Visualization
– Historic Data Analysis
18. City & County of Denver
Situational Assessment Capability
18
• During an Emergency
– Reference Grid Maps
– EOC Situation Maps
– Situational Awareness Tool
– EOC GIS Unit
– WebEOC
• After an Emergency
– Impact Analysis
– Loss/Damage Estimate
– Recovery Operations Map
19. City & County of Denver
Situational Assessment Capability
19
• Reference Grid Maps
20. City & County of Denver
Situational Assessment Capability
20
• EOC Situation Maps
21. City & County of Denver
Situational Assessment Capability
21
• Situational Awareness Tool Demo
22. City & County of Denver
Community Preparedness
• Prepare now for an emergency or disaster:
– Be Informed
• Awareness: www.ready.gov/be-informed
• Alerts: SwiftReach911 (Denver 911)
– Make a Plan
• Plan for Home, Work, and School
• www.ready.gov/make-a-plan
– Build a Kit
• Emergency supplies for Home, Work,
School, and Cars
• www.ready.gov/build-a-kit
– Get Involved
• Community Emergency Response Teams,
School Emergency Response Teams,
Scouting, Volunteer
• www.ready.gov/get-involved
22
Ten Ways to Be Prepared
• Identify Your Risk
• Create Your Disaster Plan
• Practice Your Disaster Plan
• Build a Disaster Supply Kit
• Prepare Your Family
• Don’t Forget Those with
Special Needs
• Learn CPR and First Aid
• Eliminate Hazards in Your
Home and Workplace
• Understand Your Risks
• Get Involved – Volunteer!
23. City & County of Denver
Emergency Management Services
• Denver OEM Contact Information:
– By Mail: 1437 Bannock St. #3, Denver, CO 80202
– By Phone: (720) 865-7600
• Duty Officer: (720) 865-5500
– By Email: EOC.Operations@denvergov.org
– On the Web:
www.denvergov.org/content/denvergov/en/office-of-
emergency-management.html
– On Facebook: www.facebook.com/DenverOEM/
– On Twitter: @DenverOEM
23