
Download as PDF, PPTX


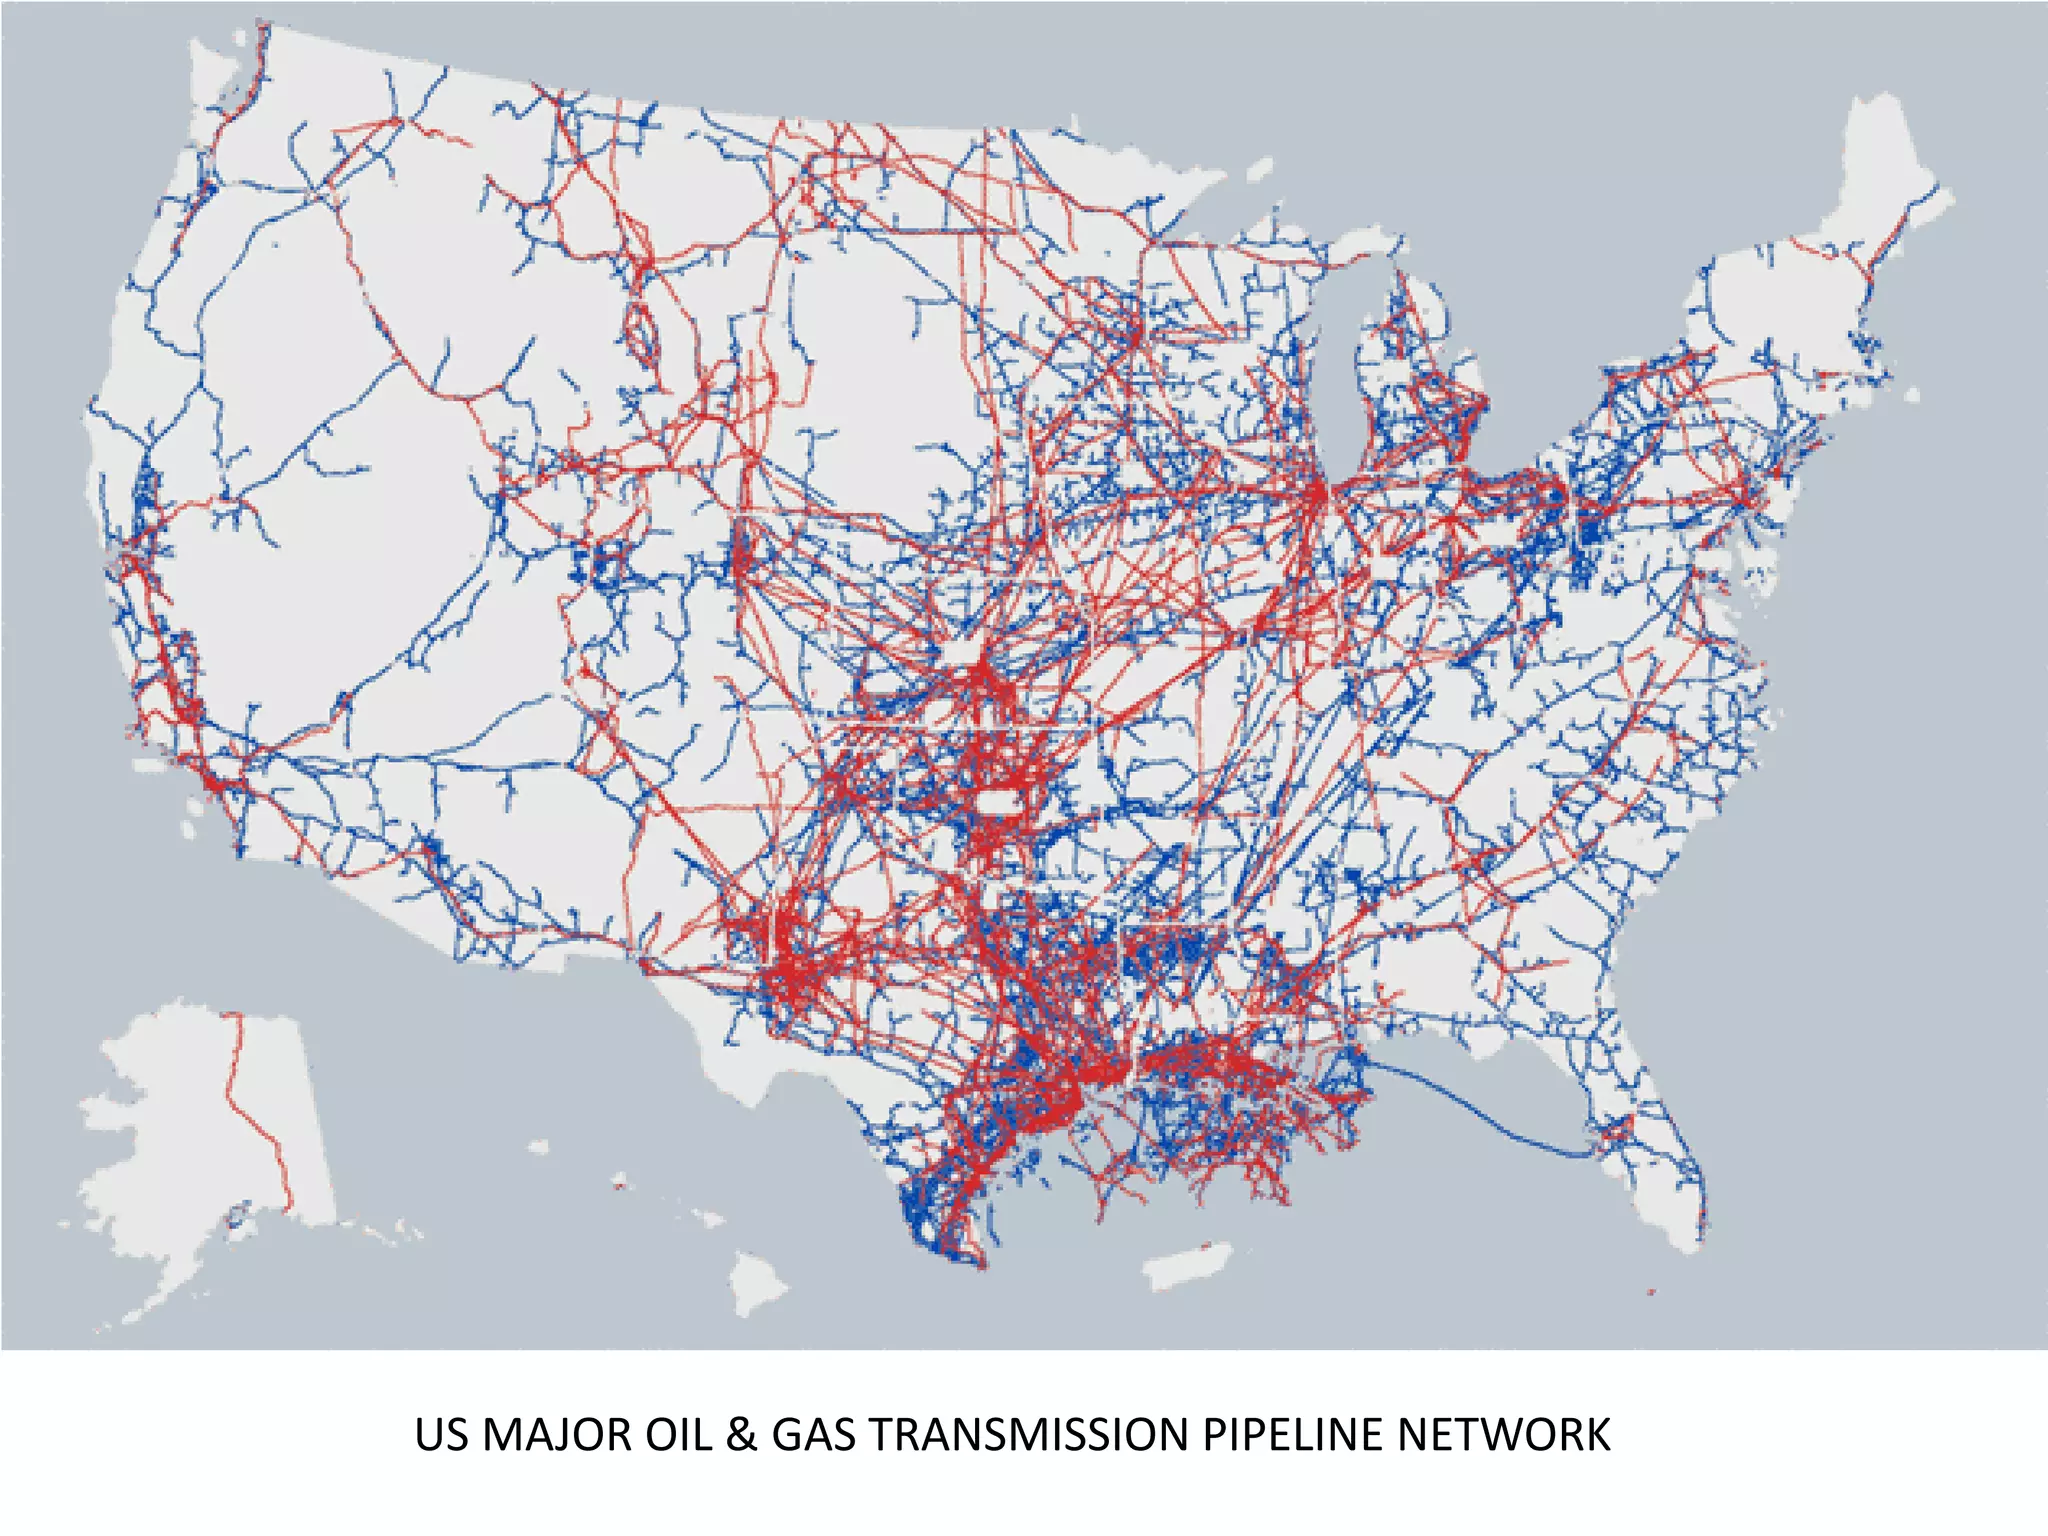
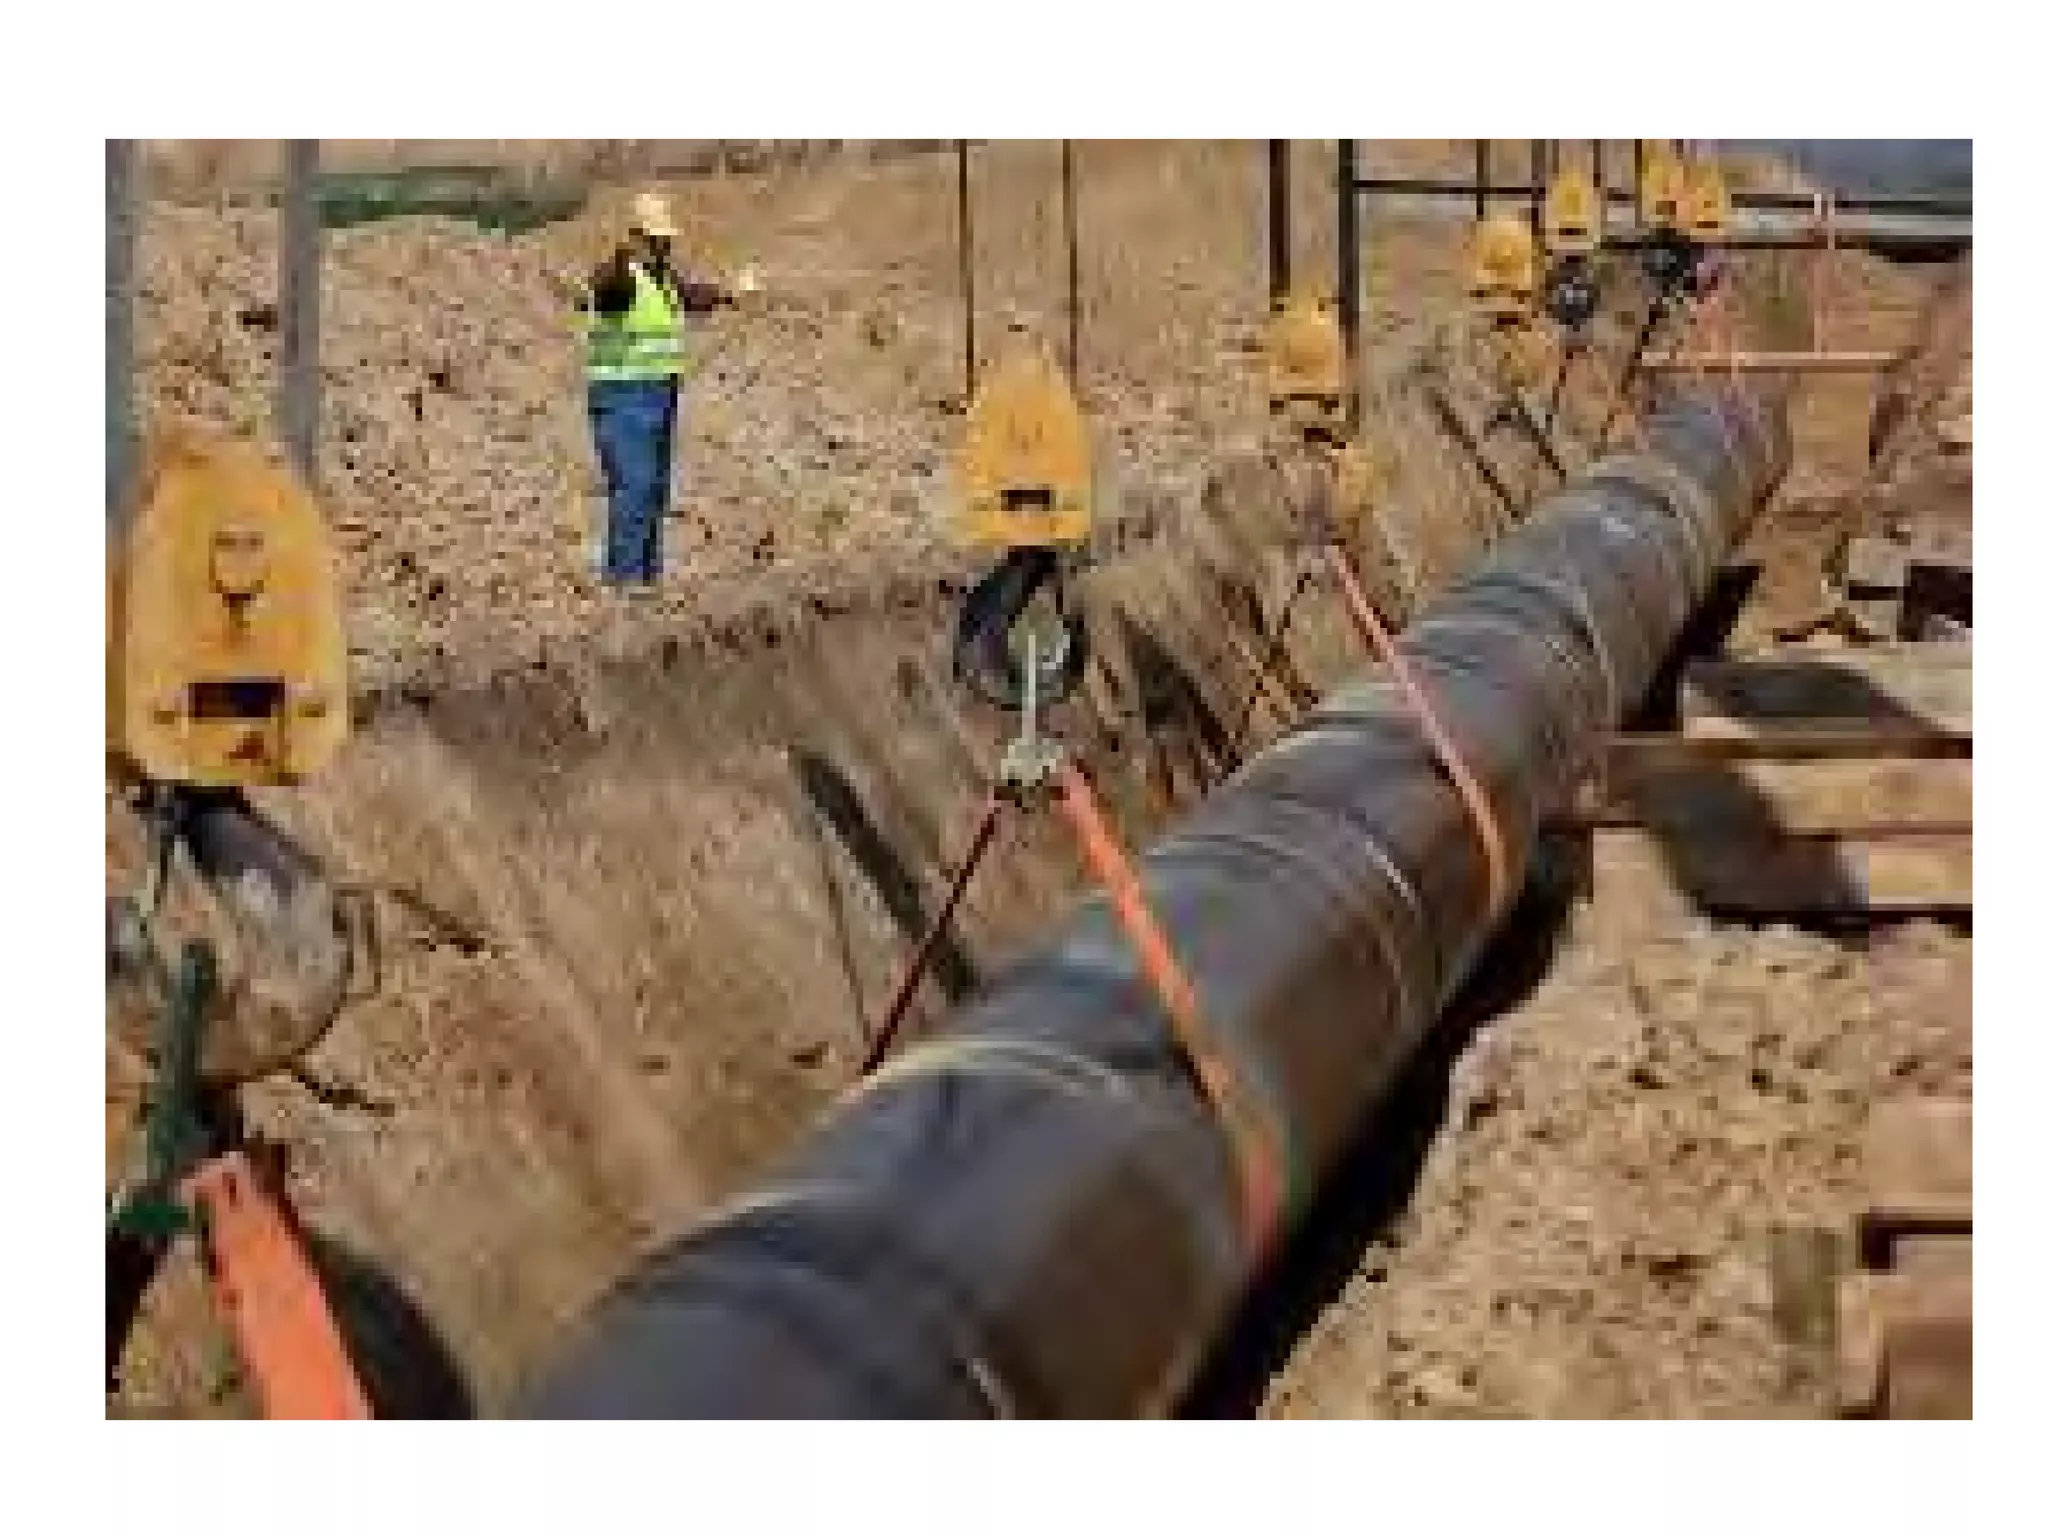

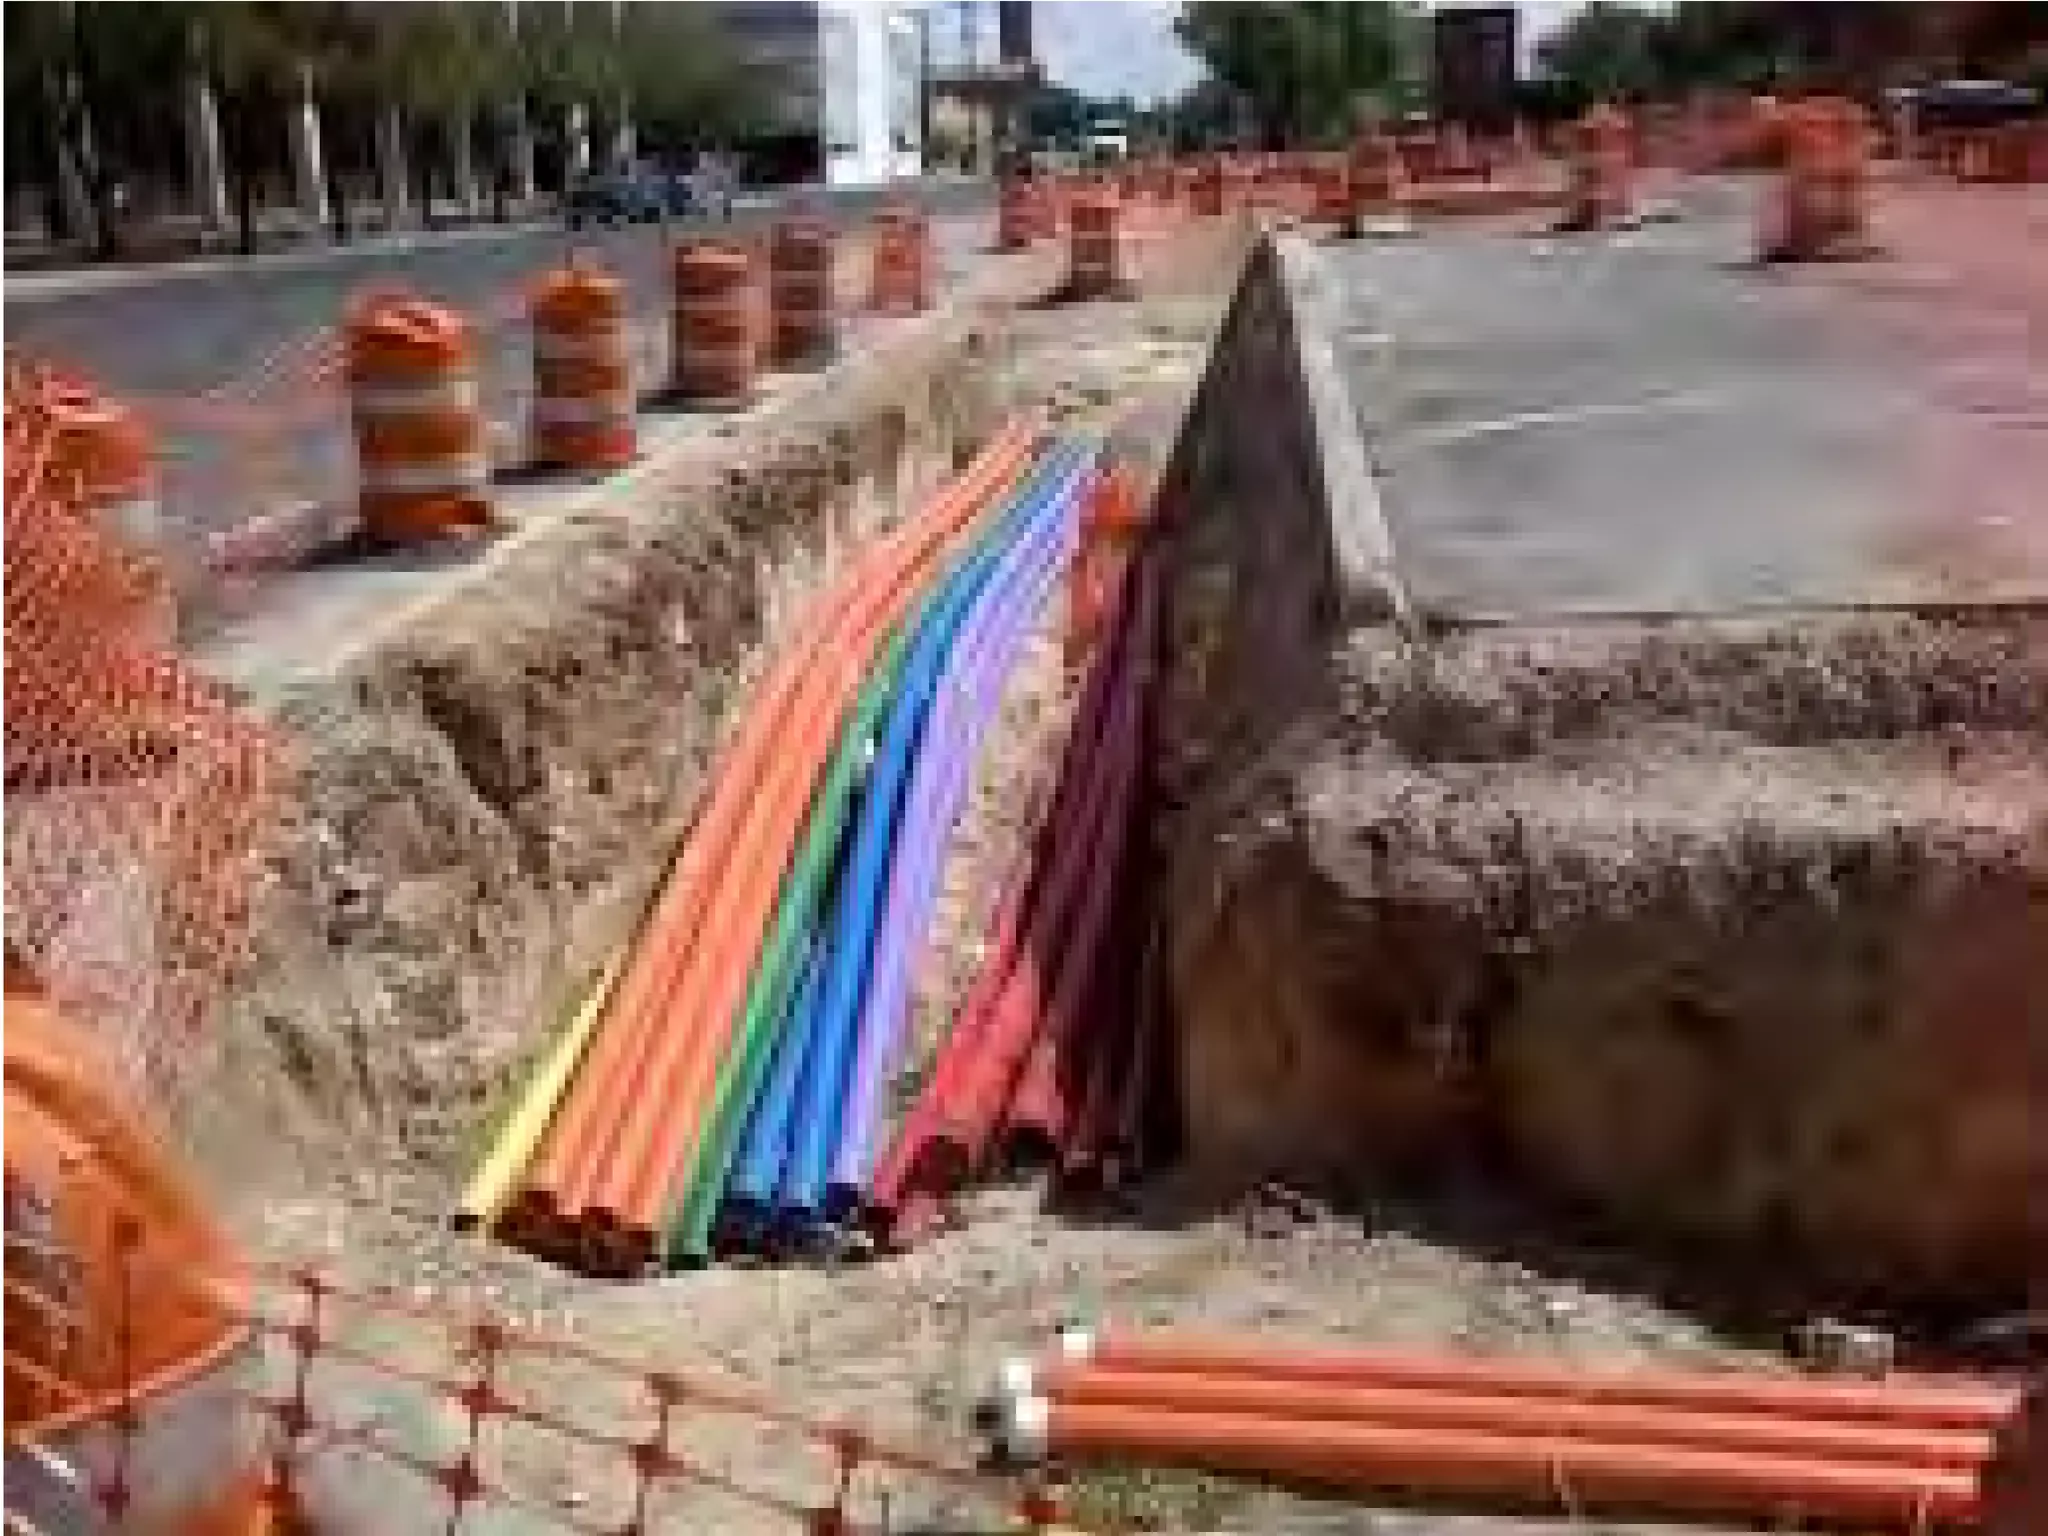
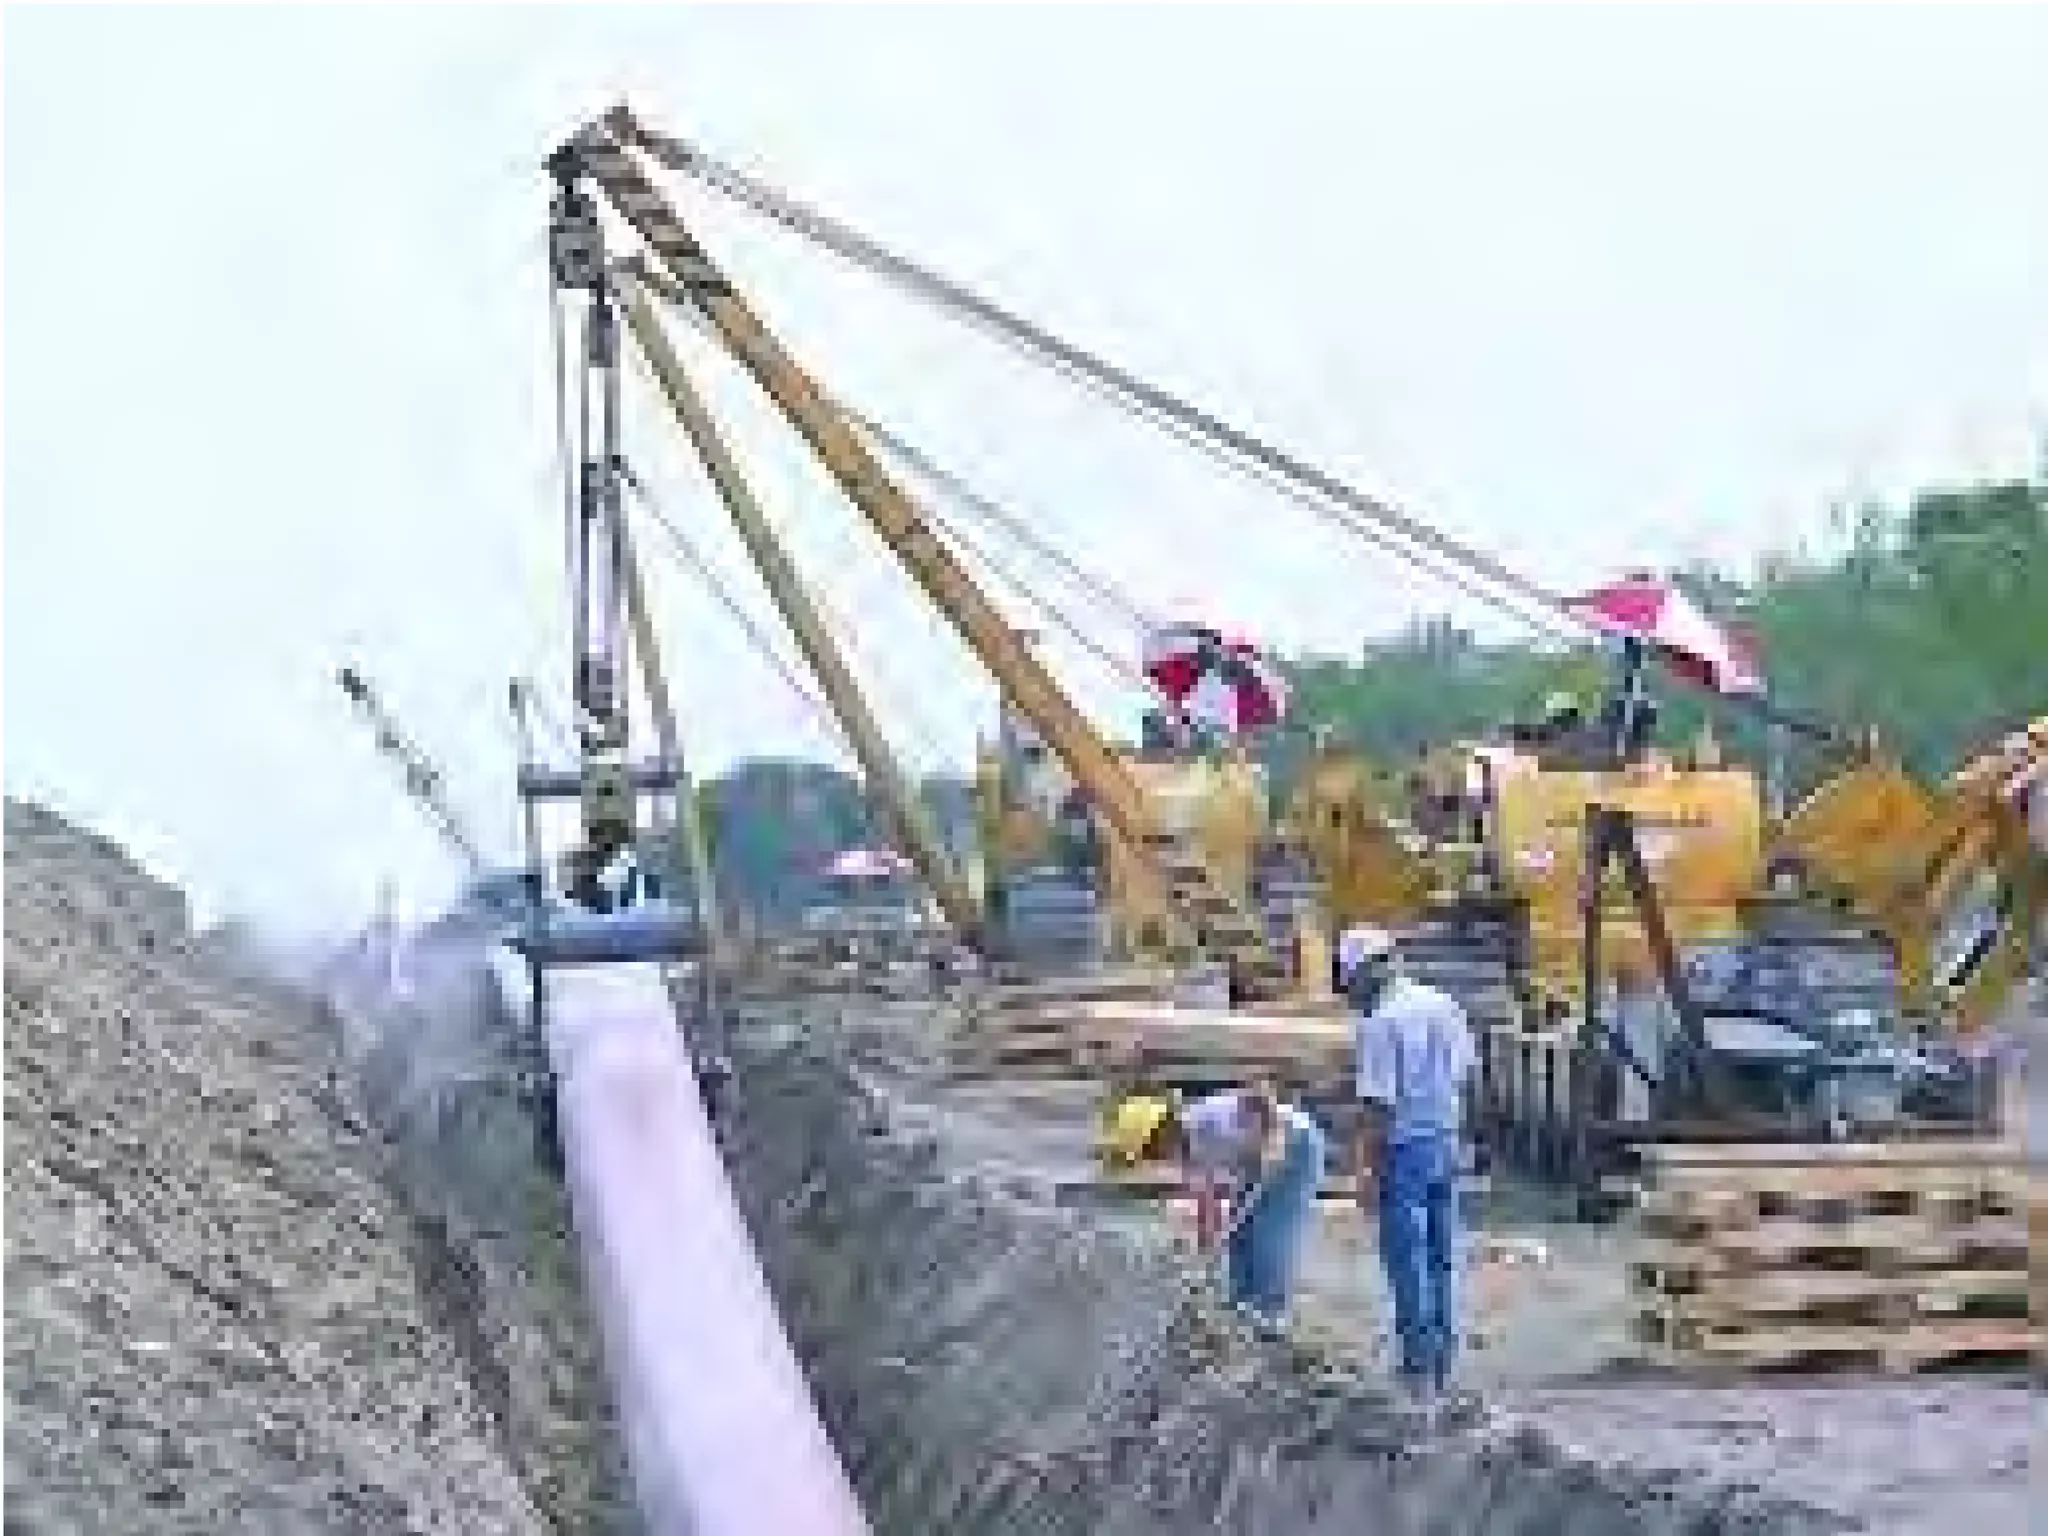
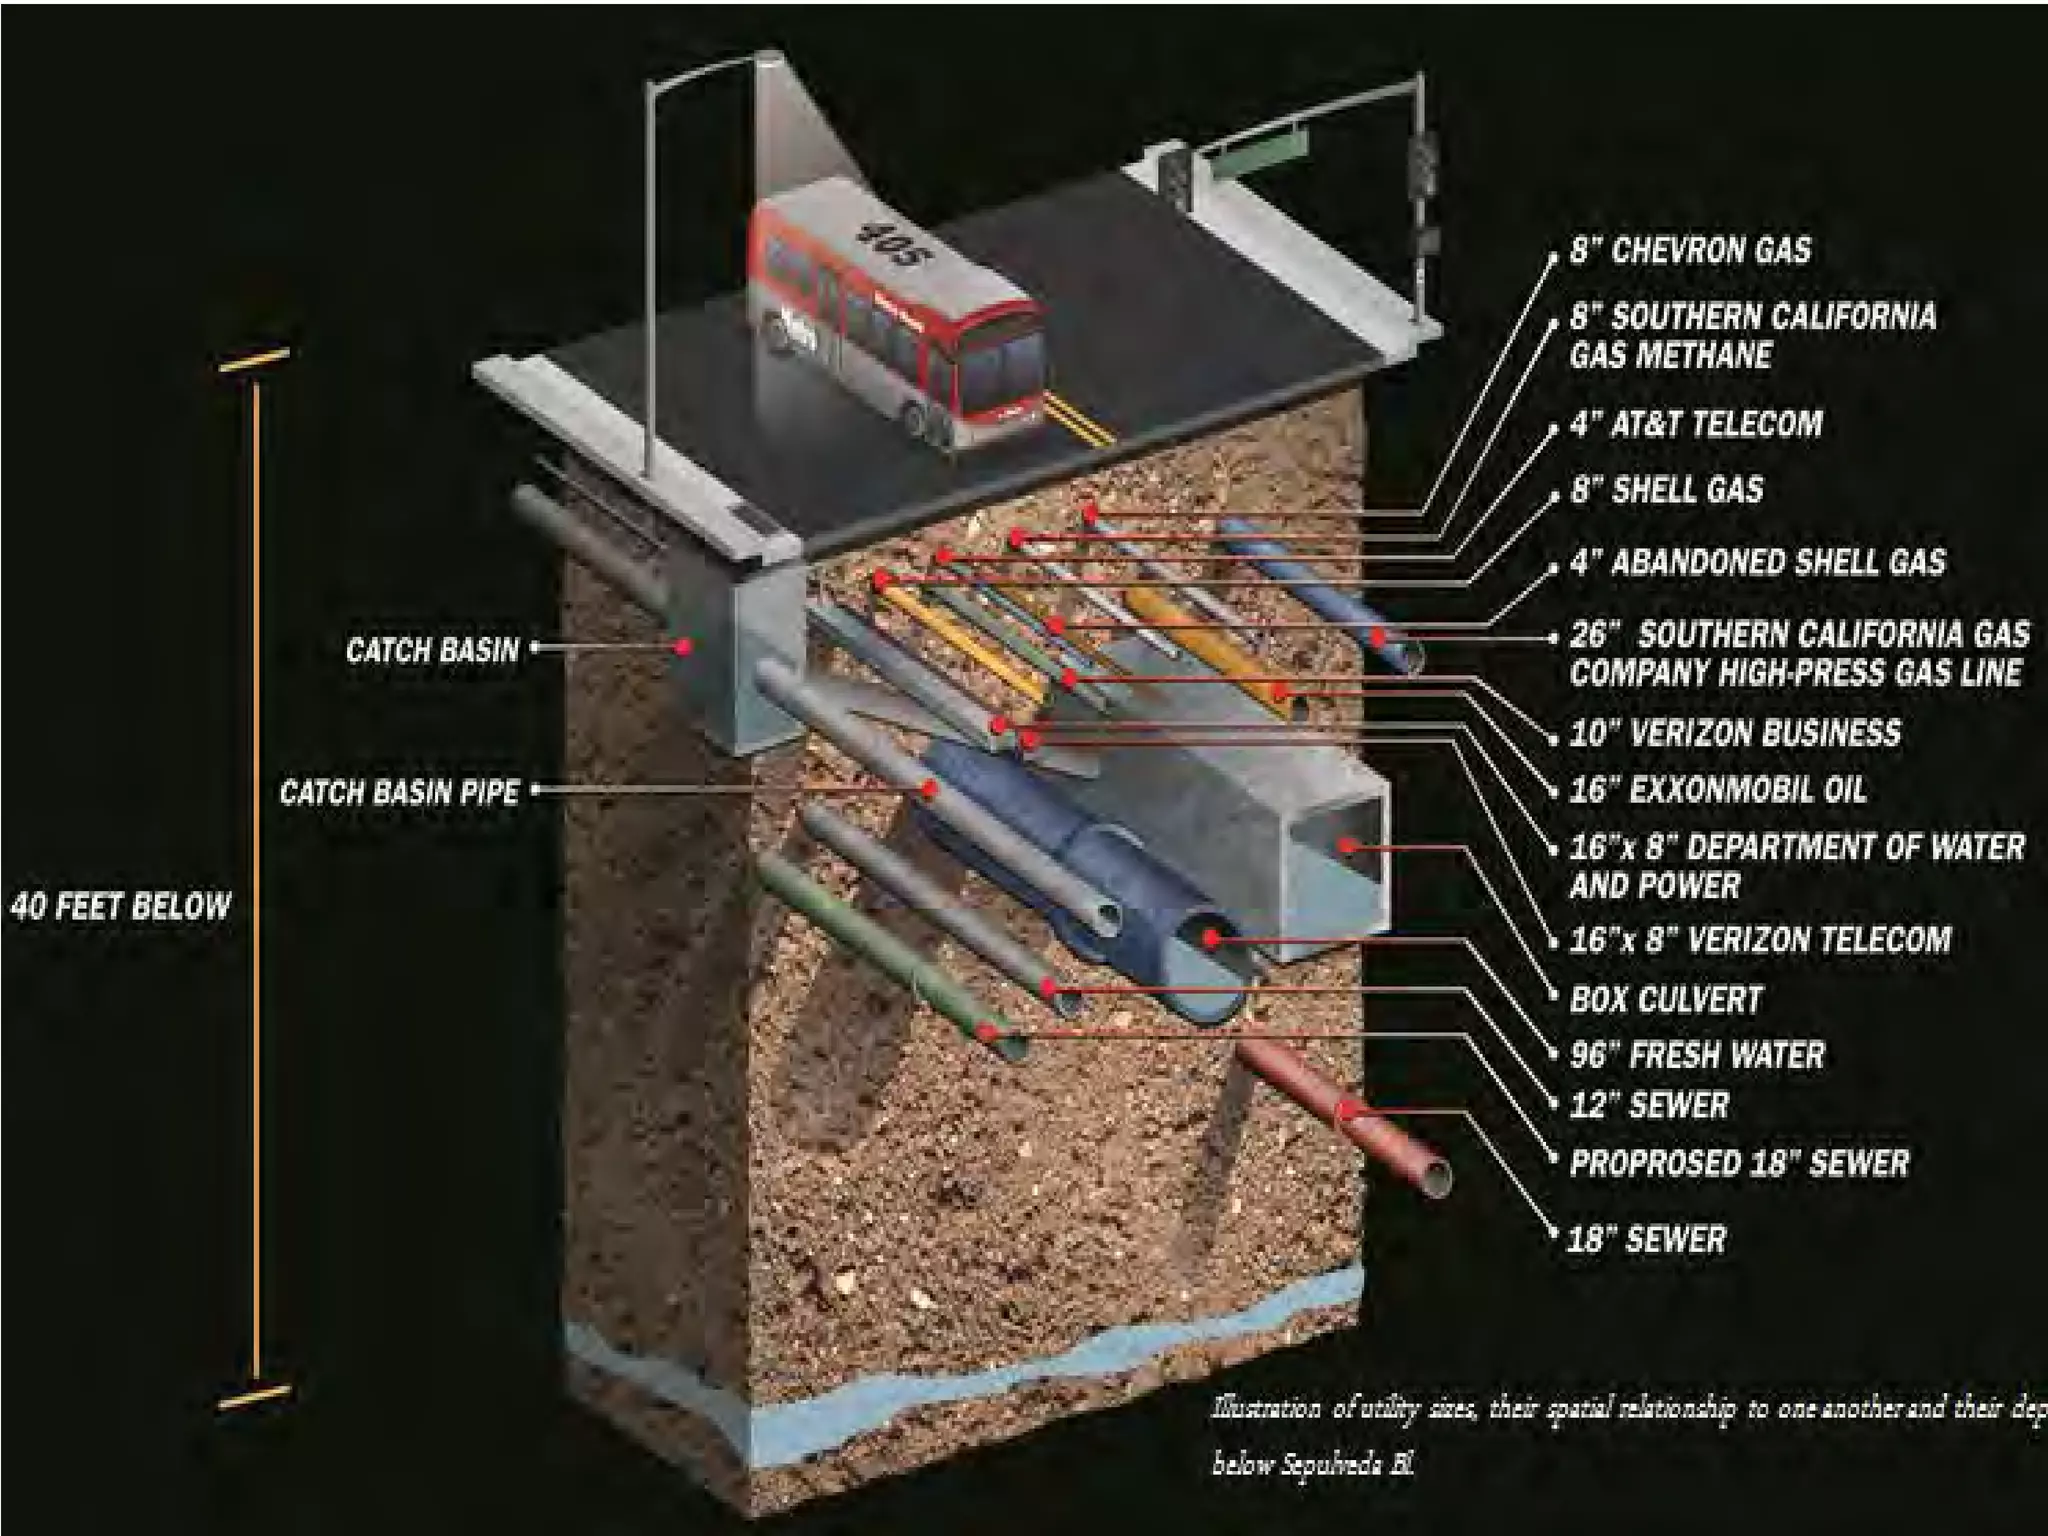

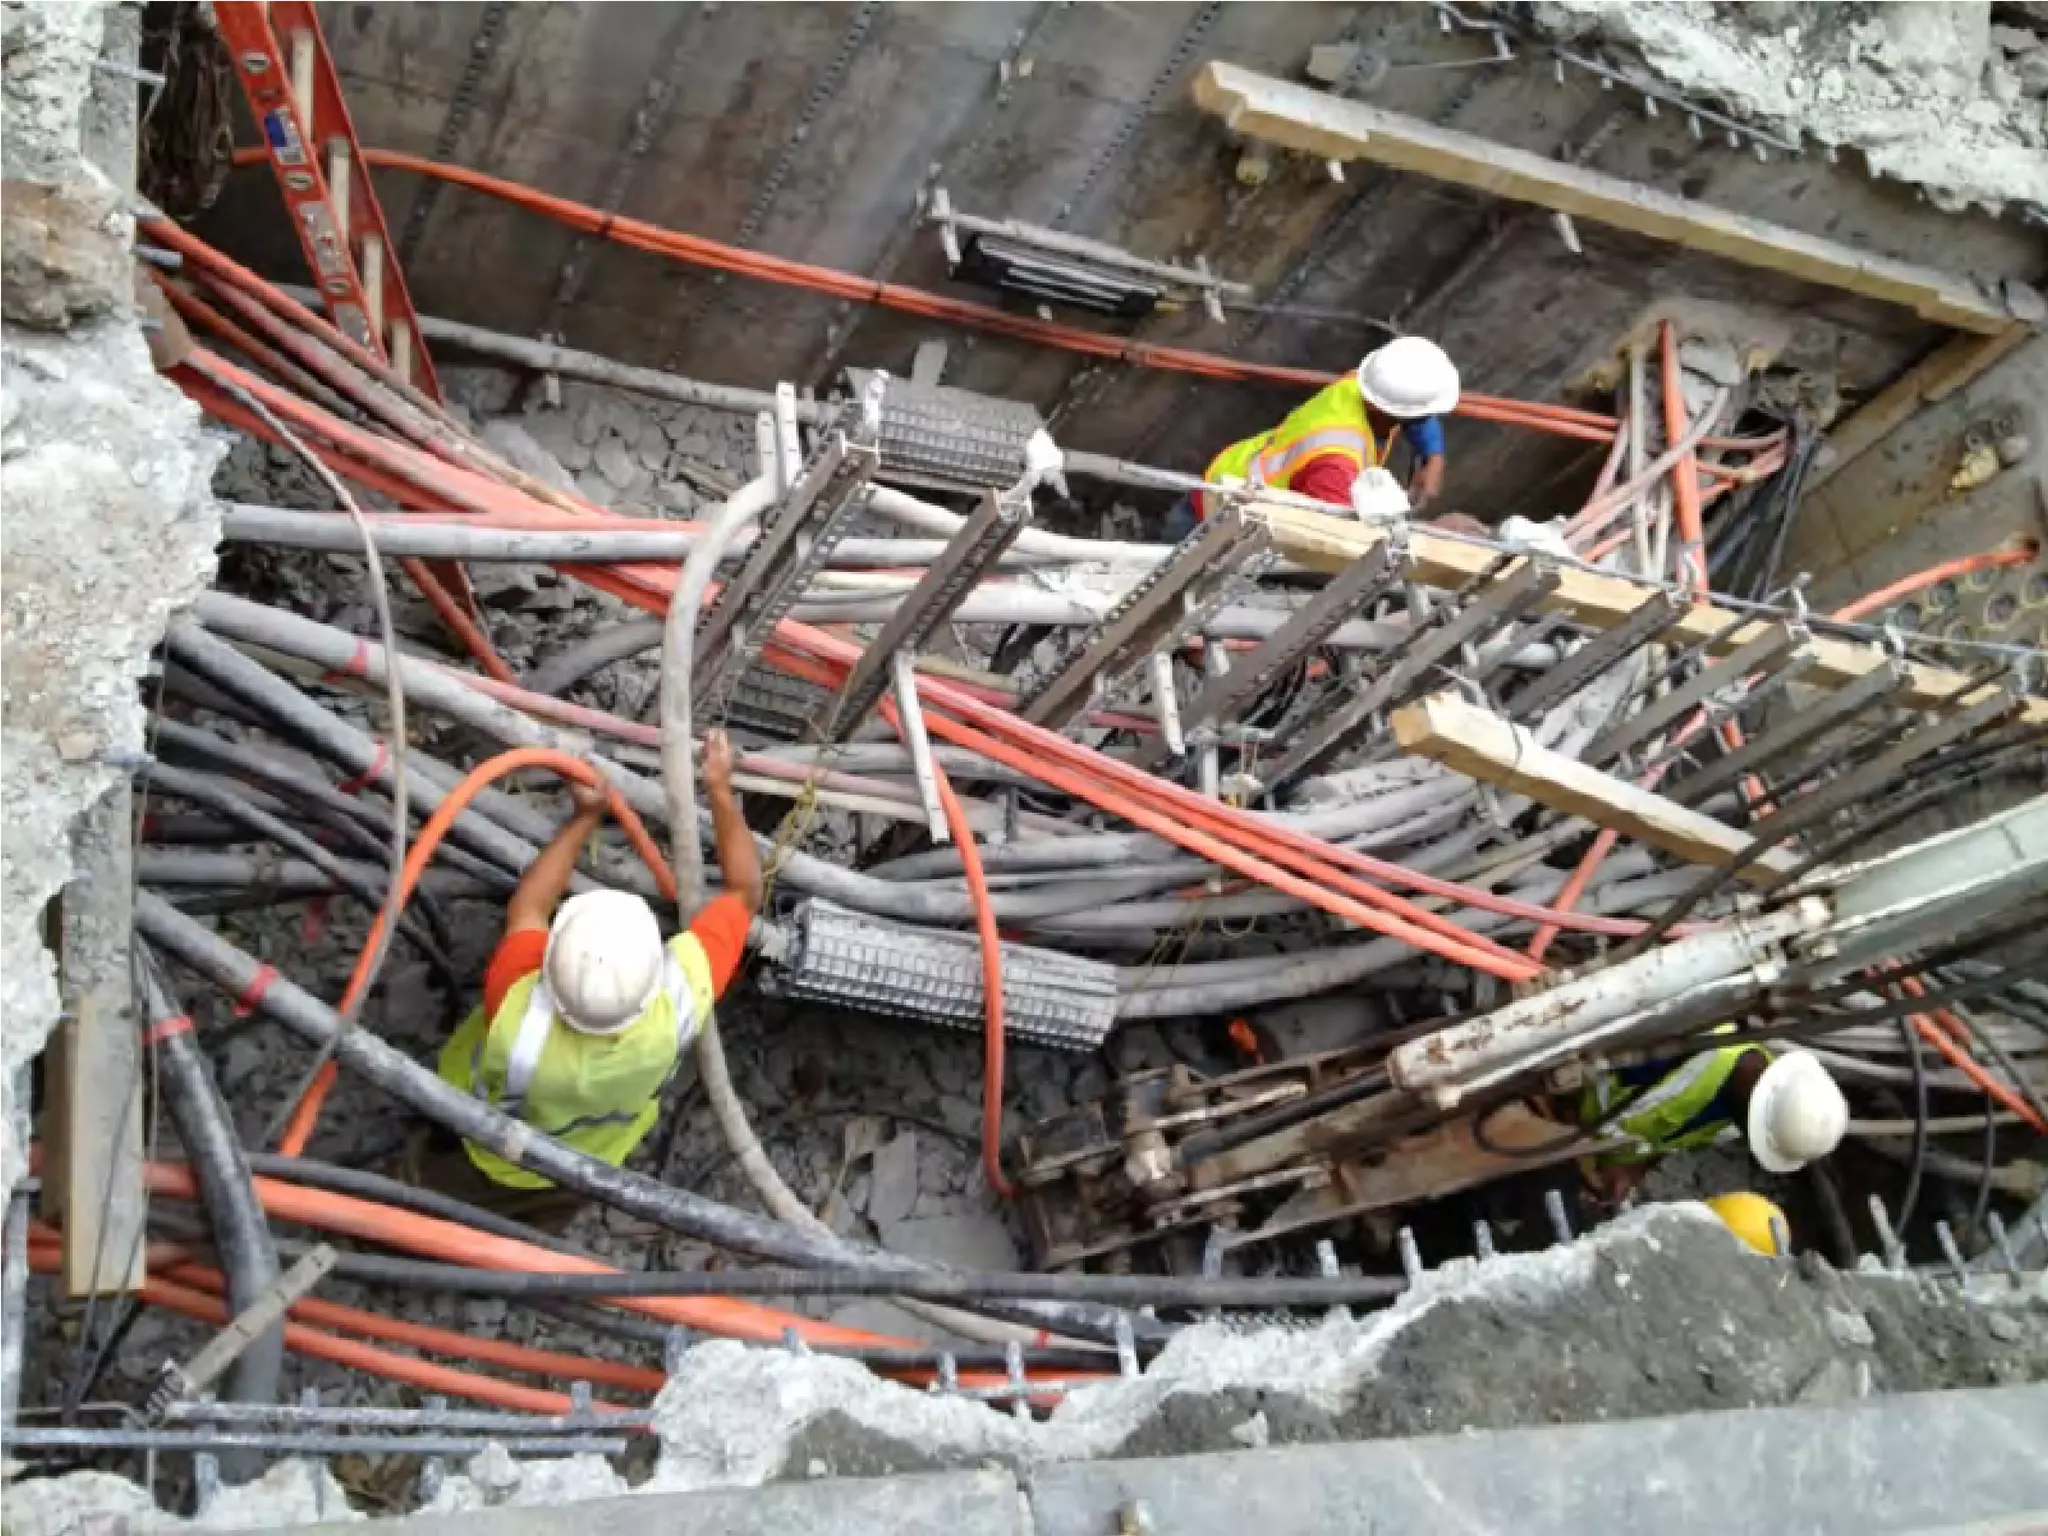
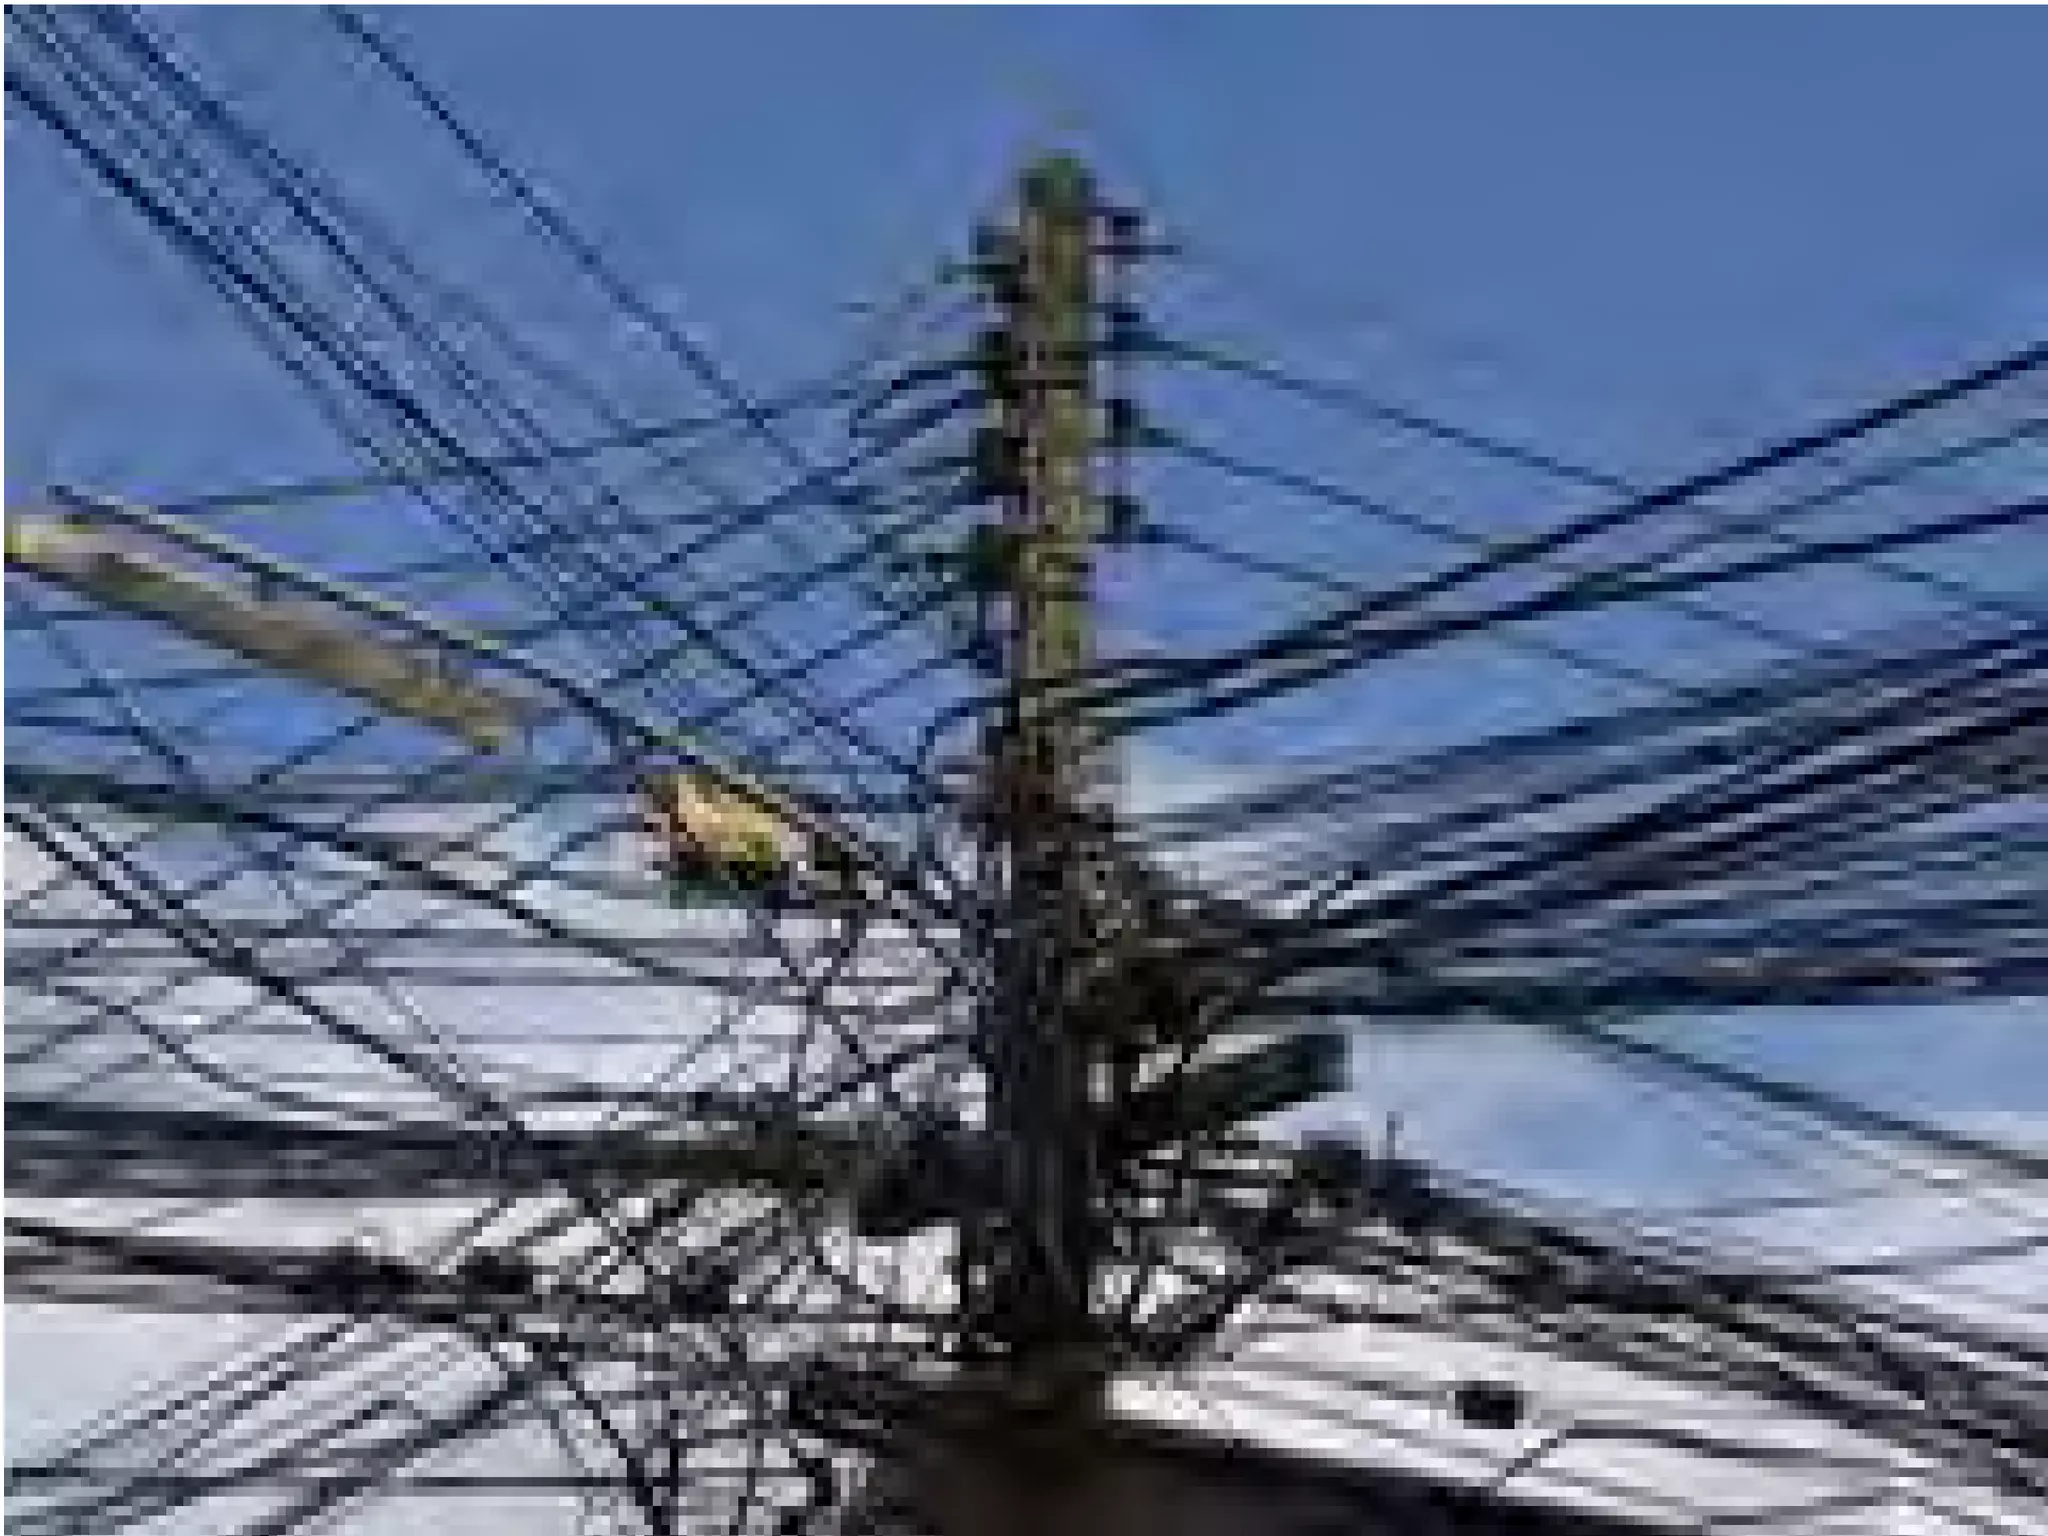
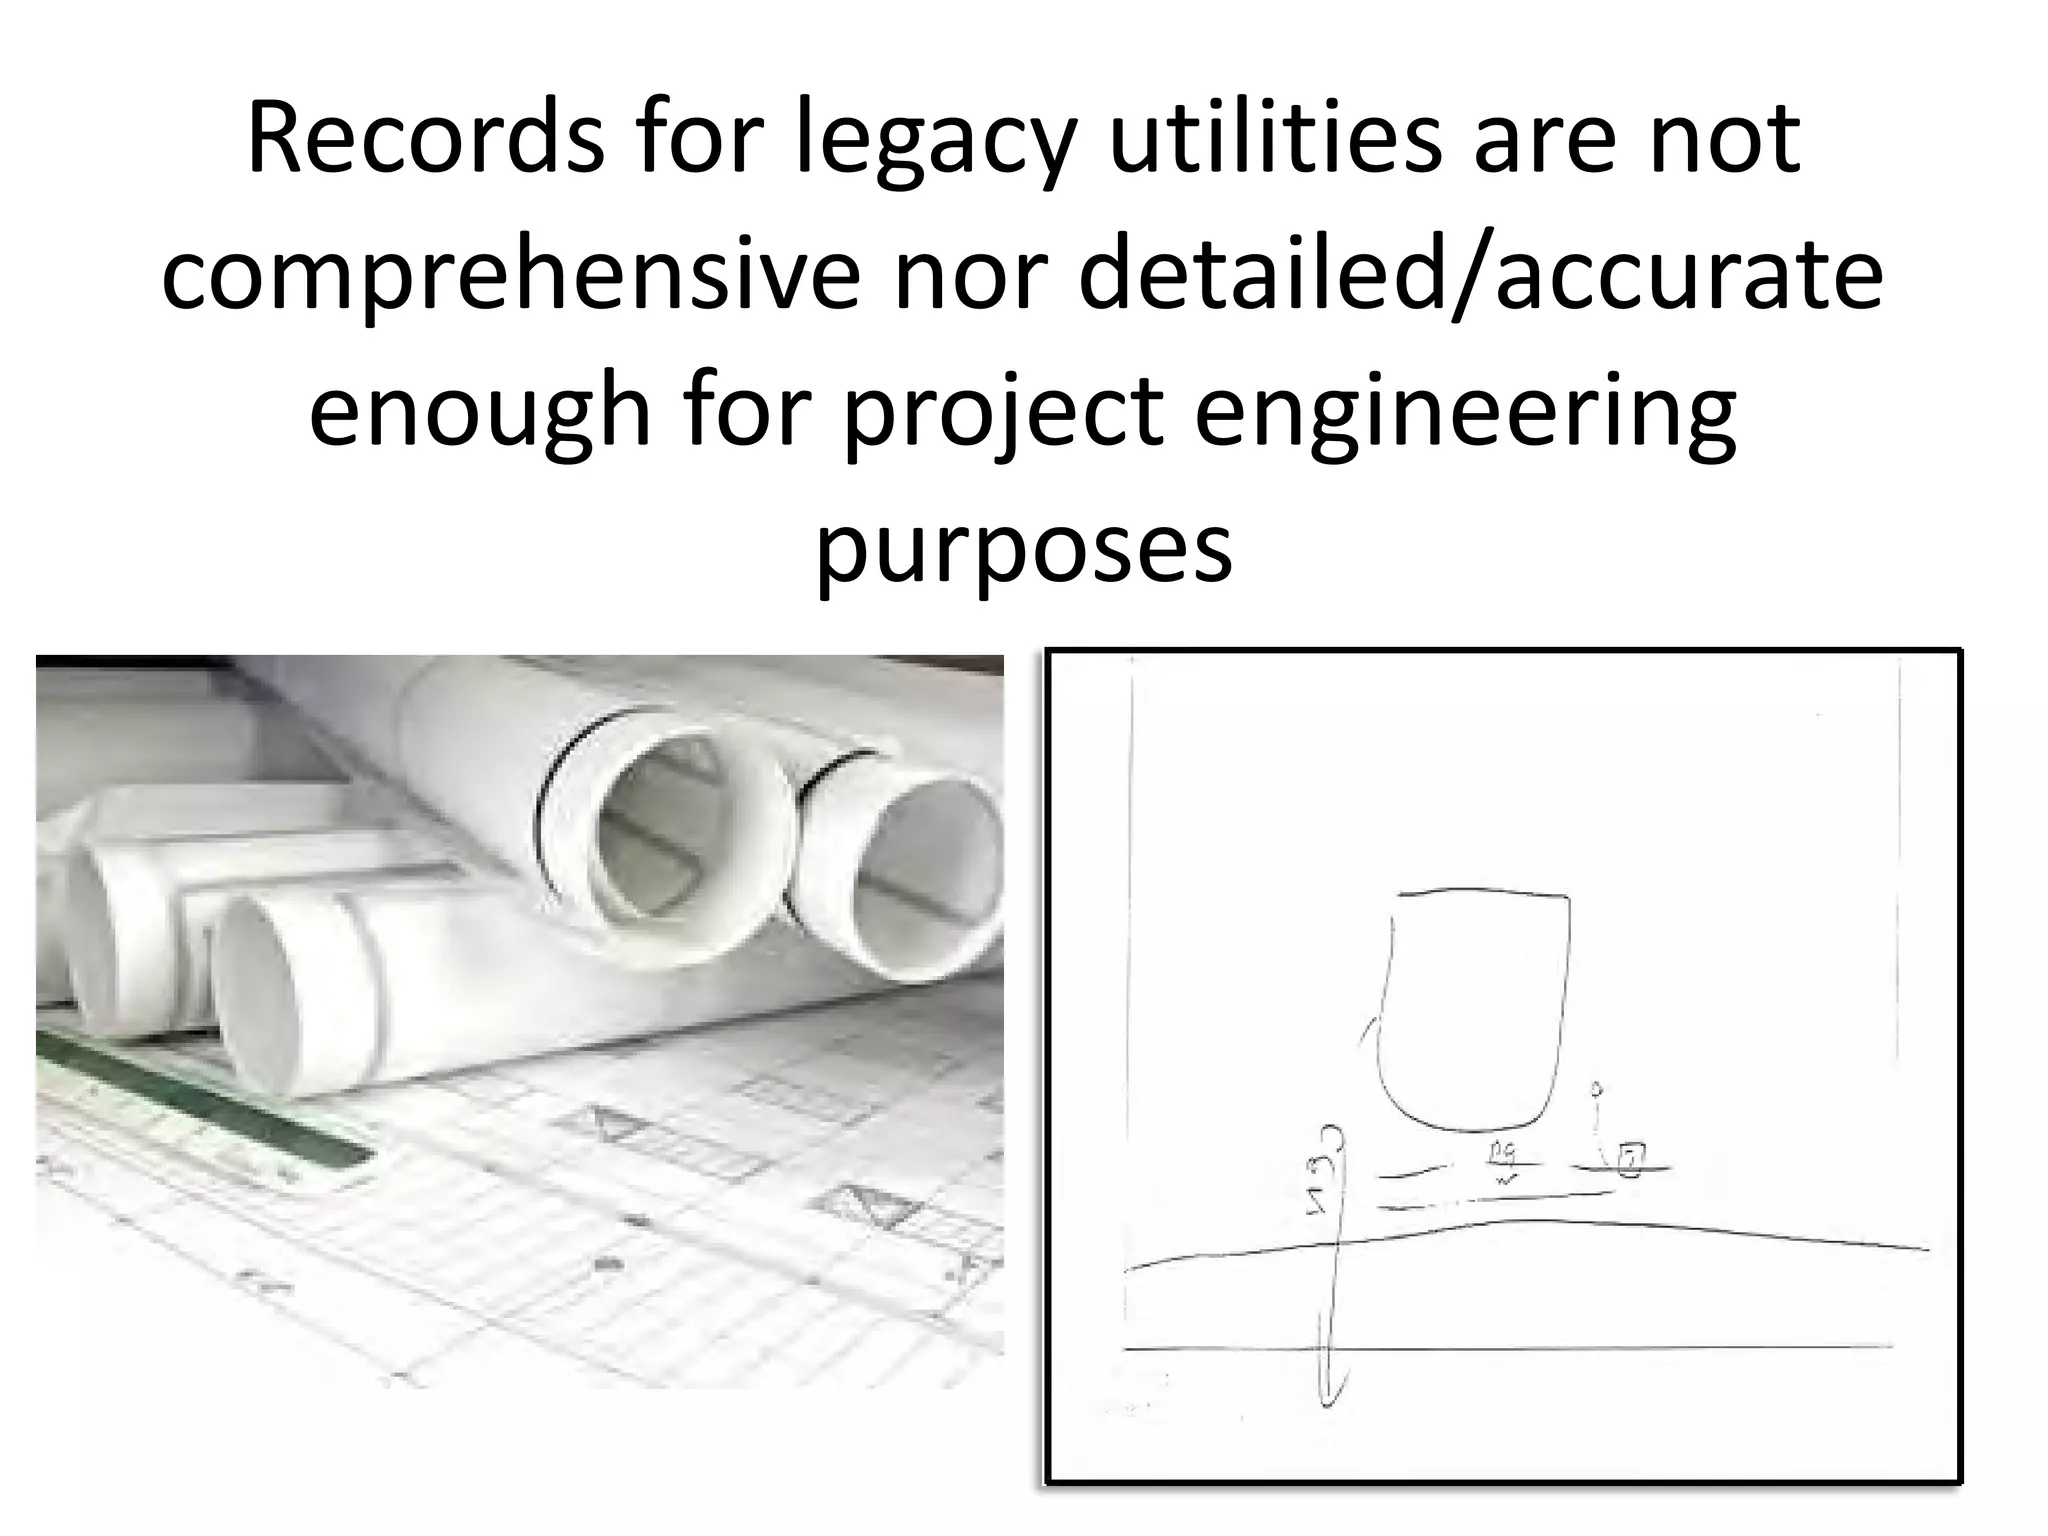


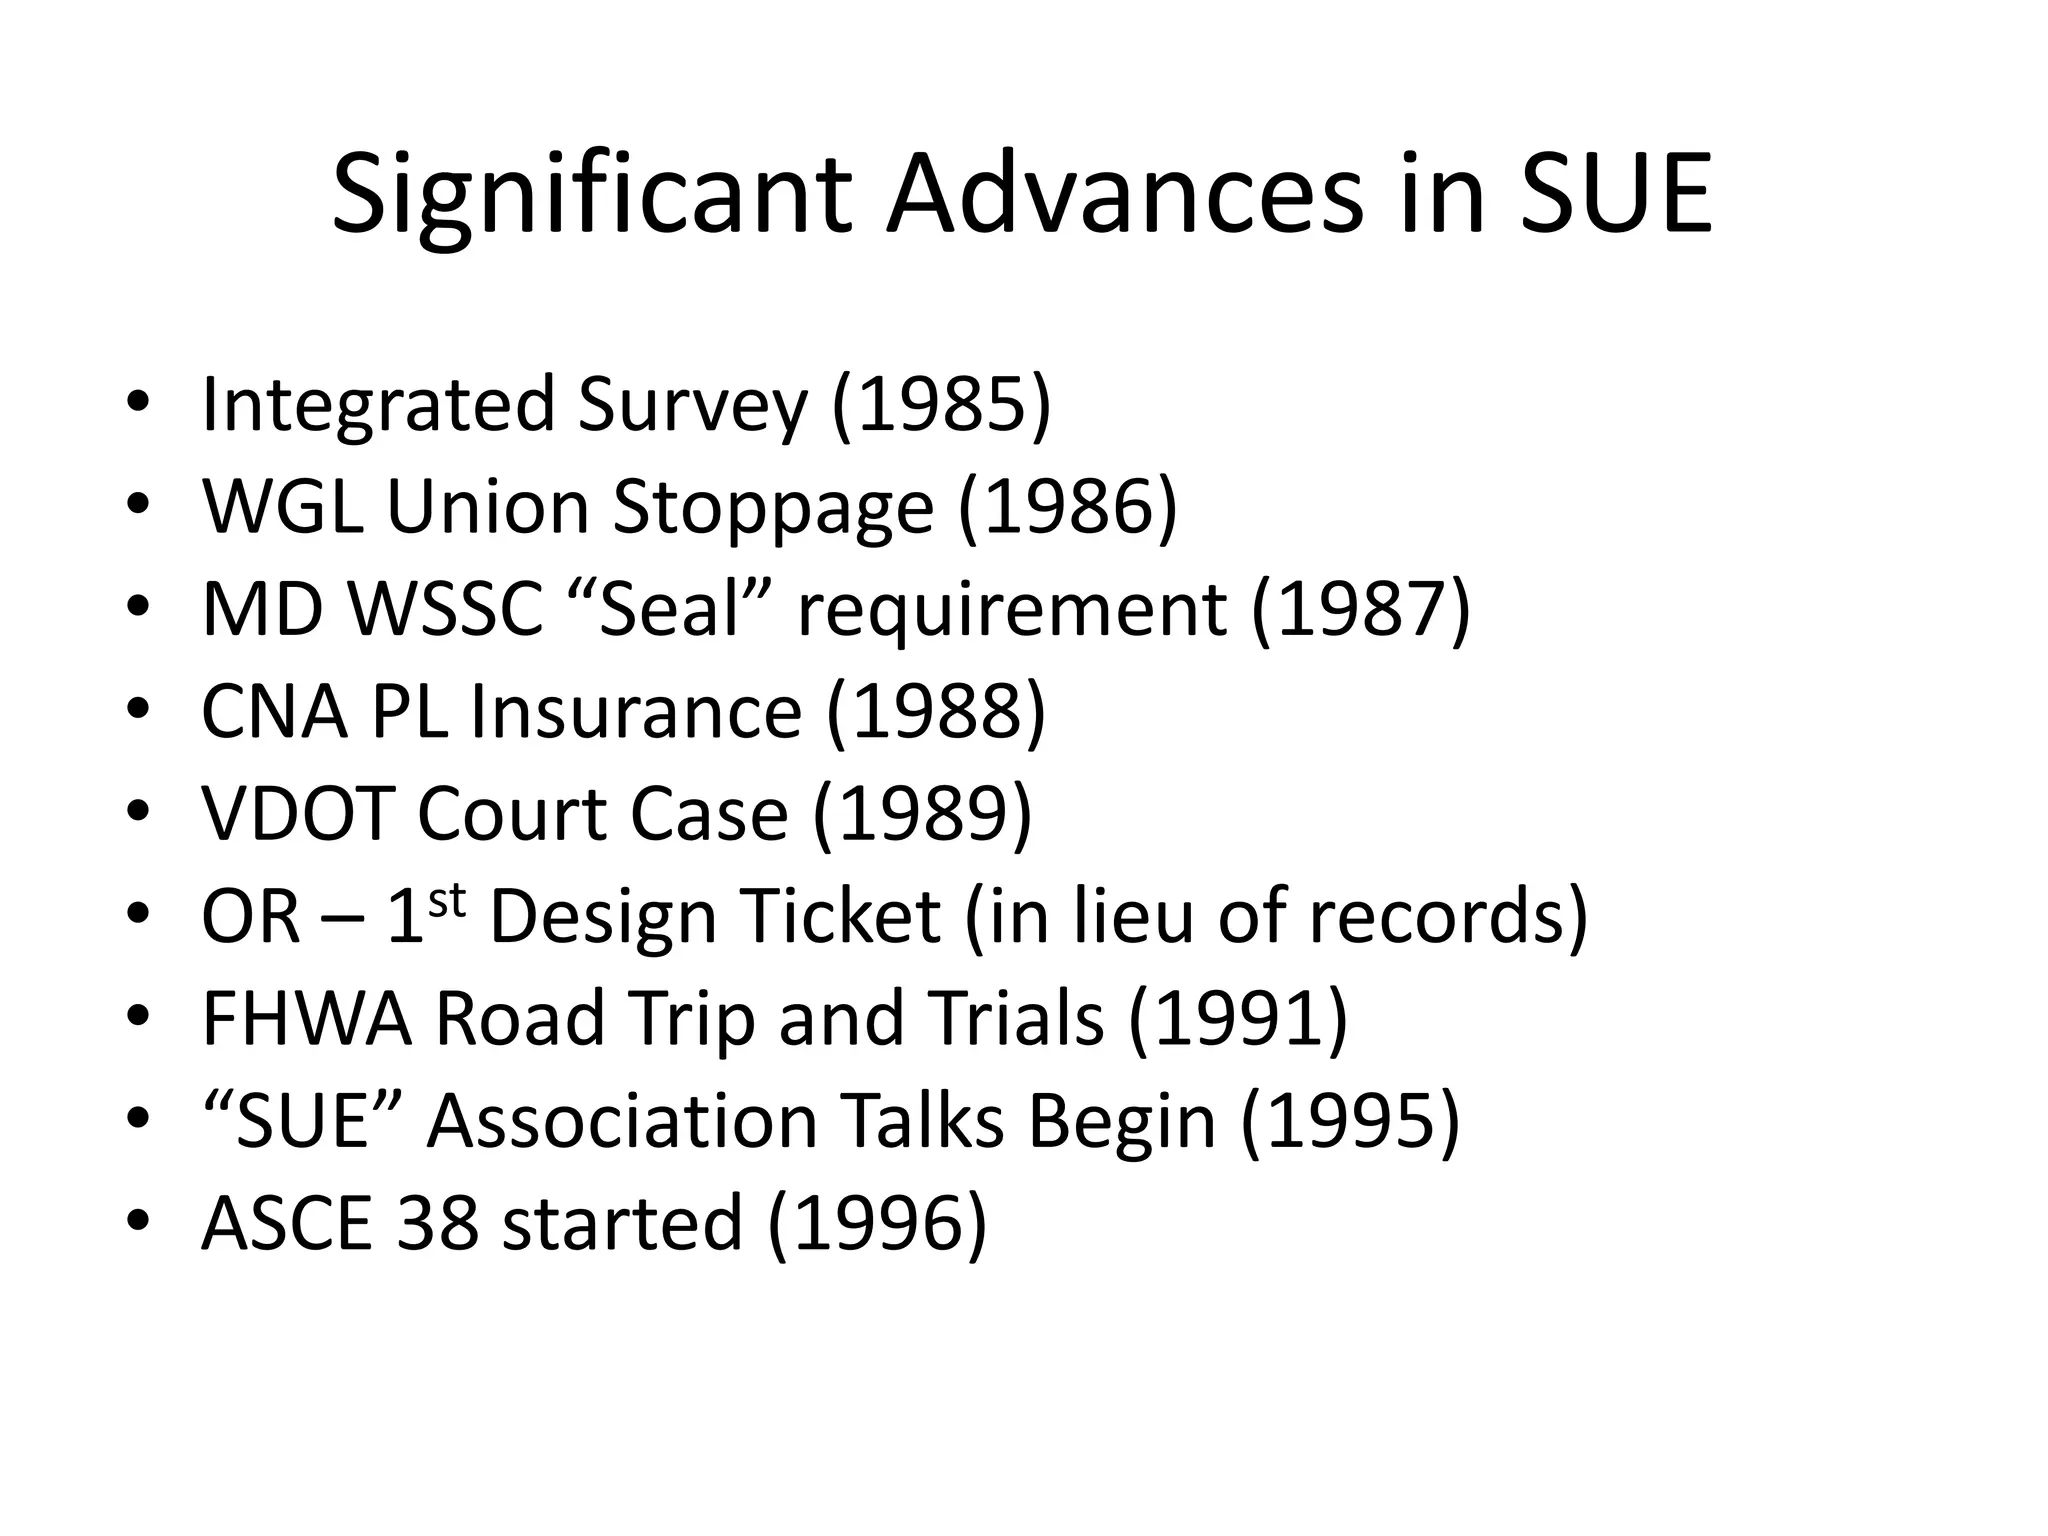


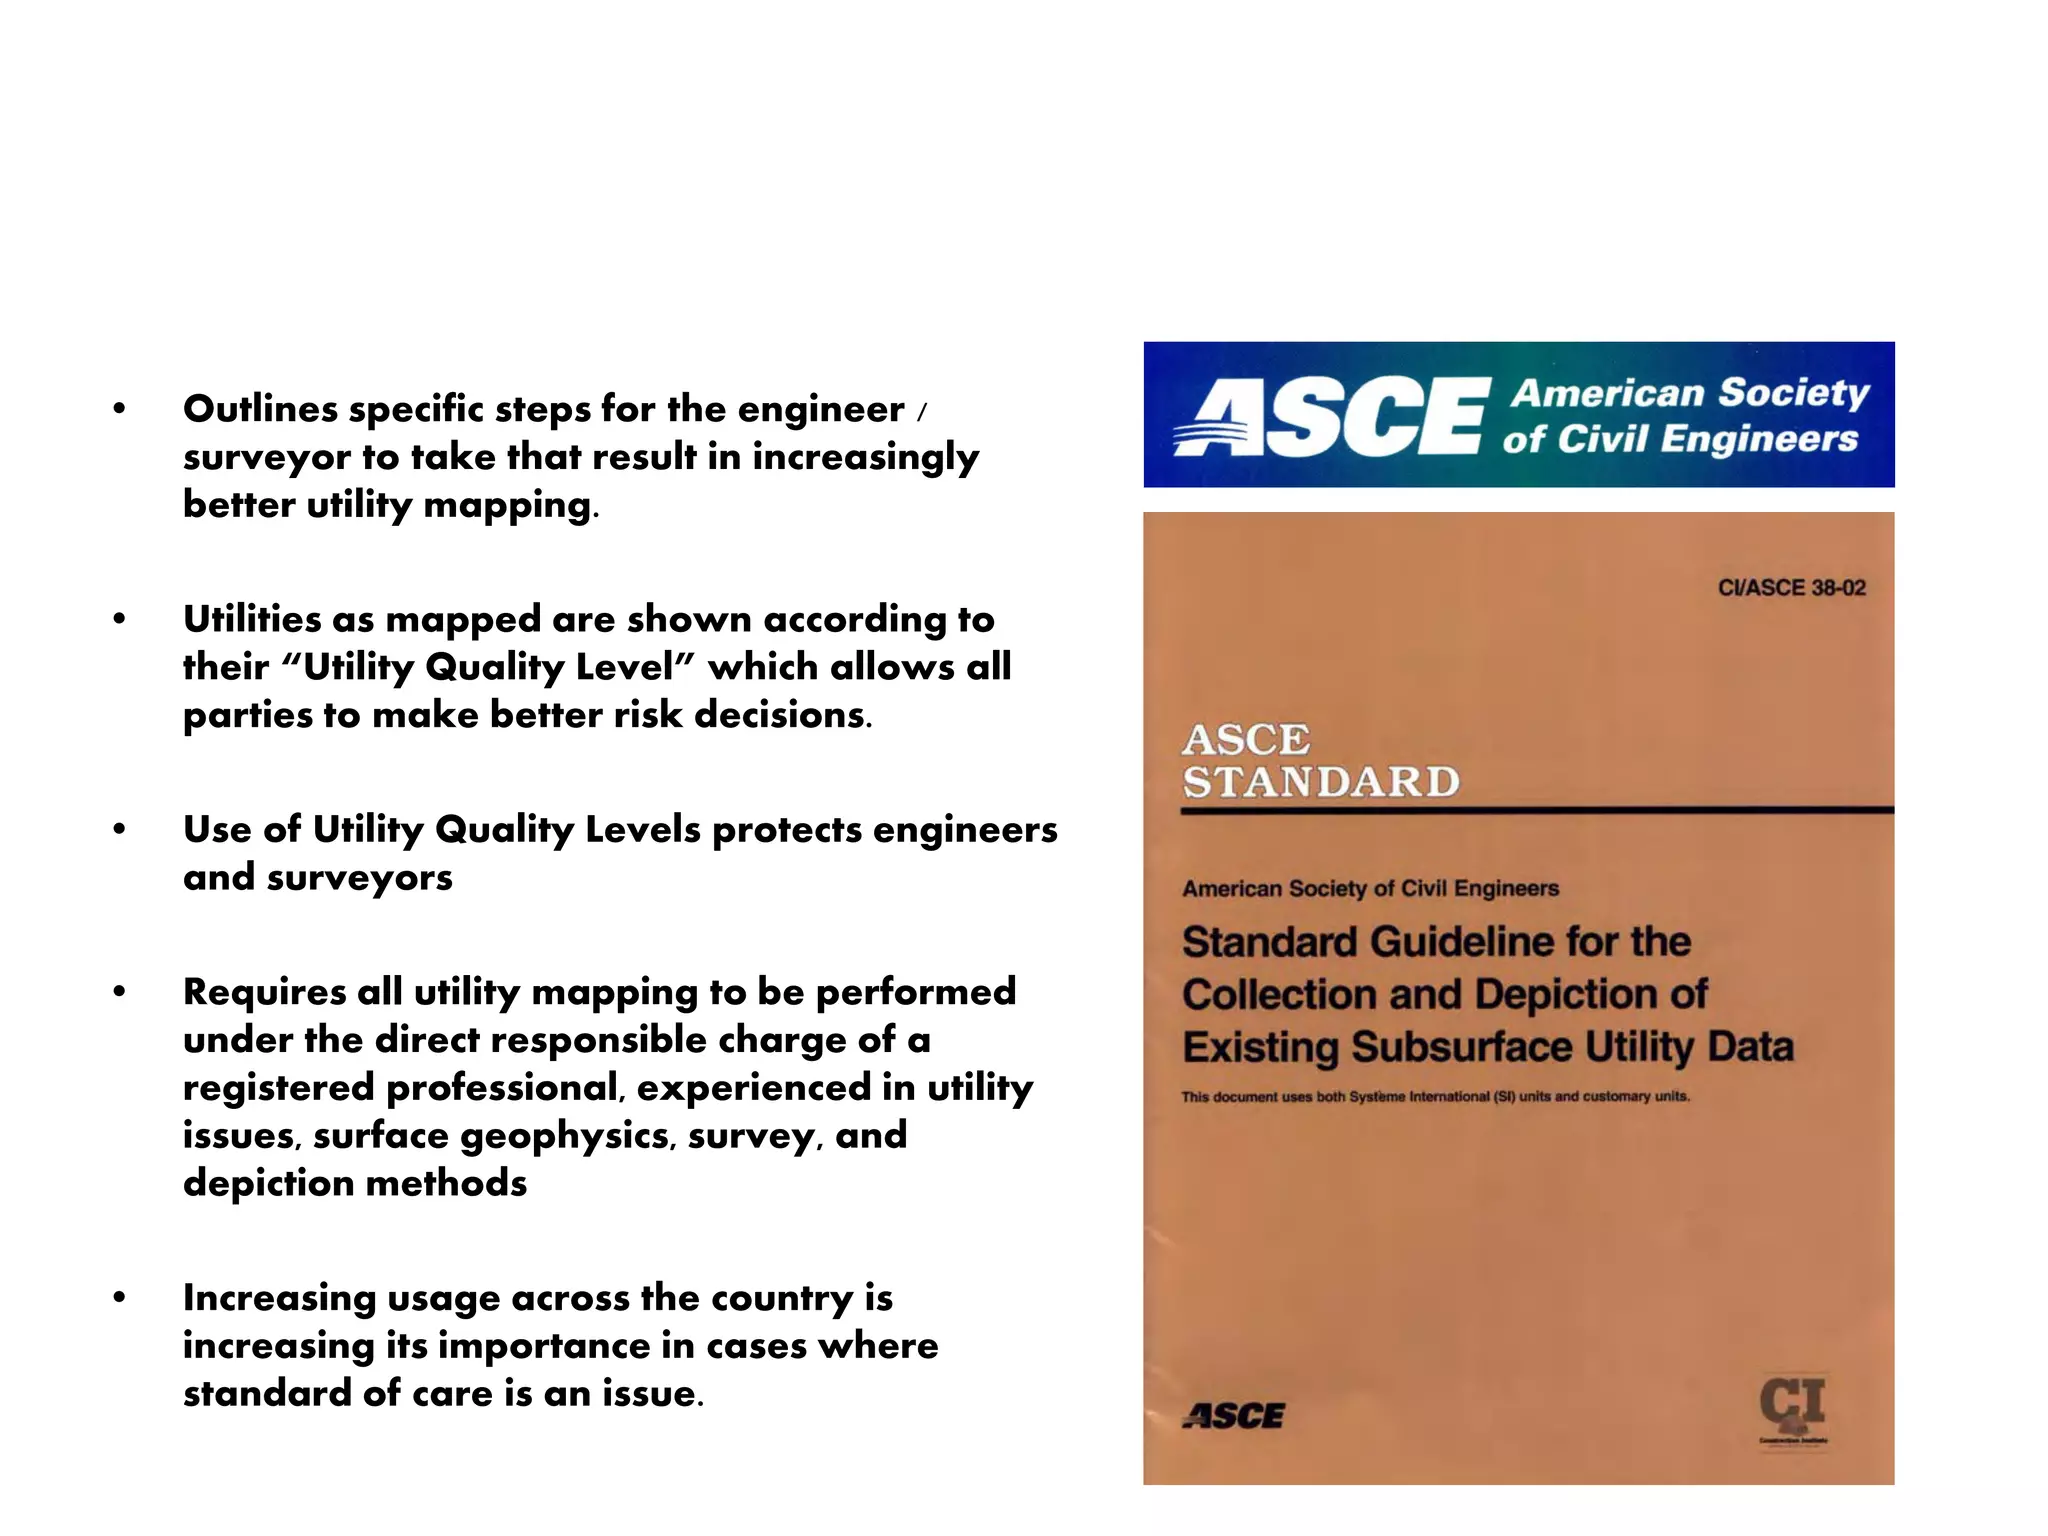


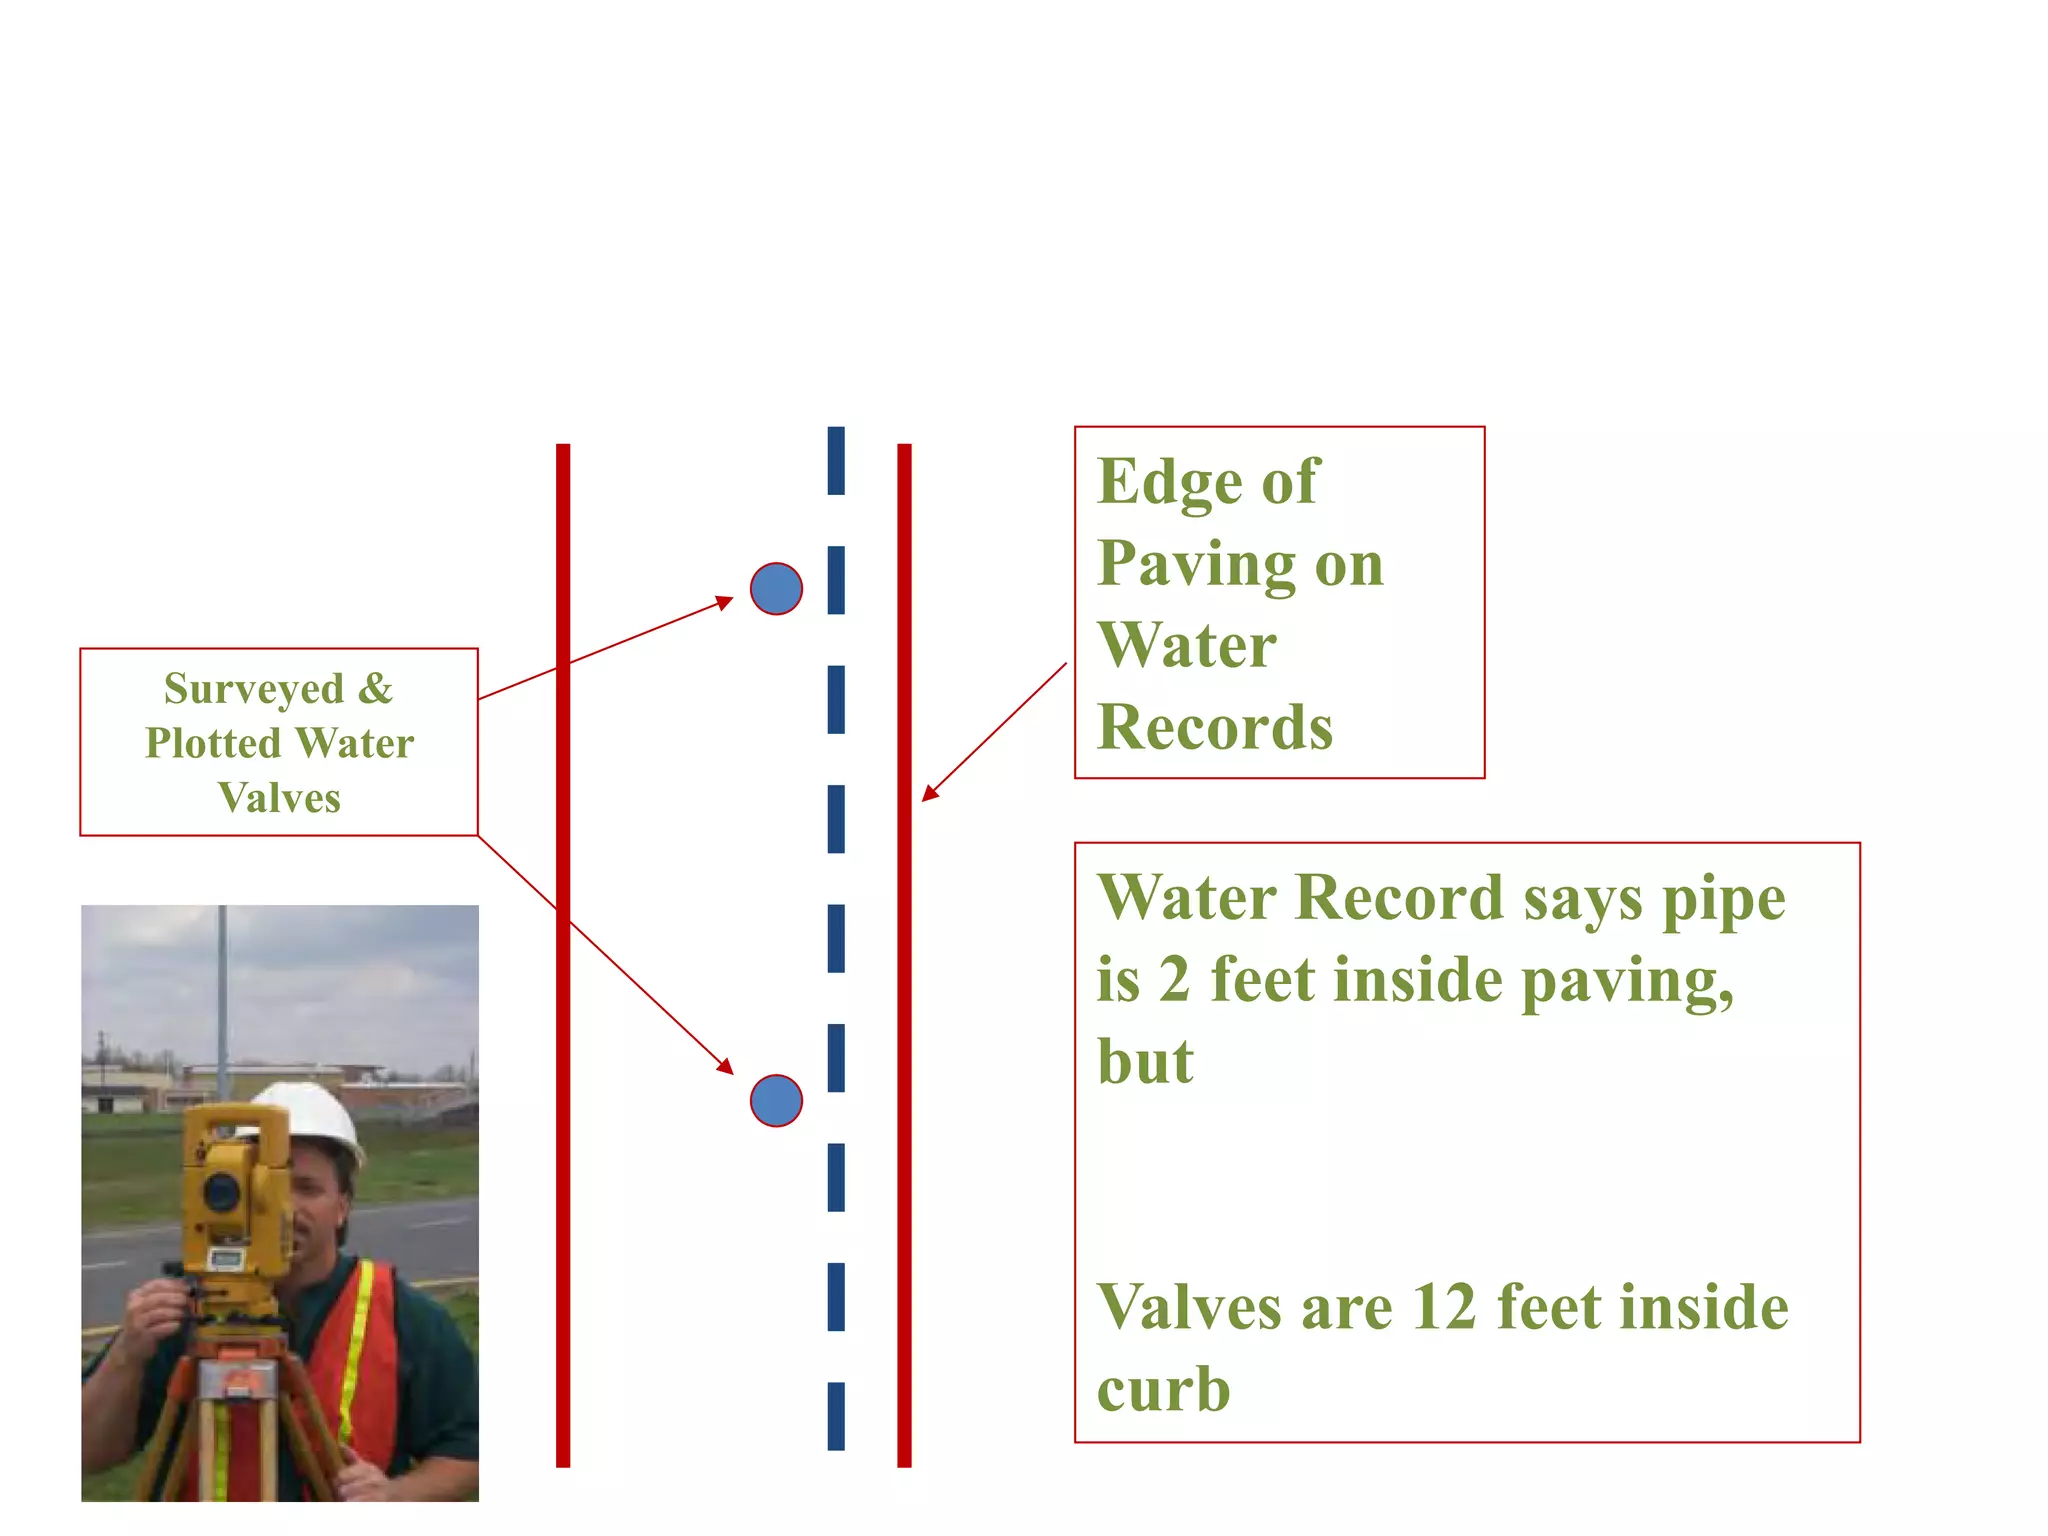

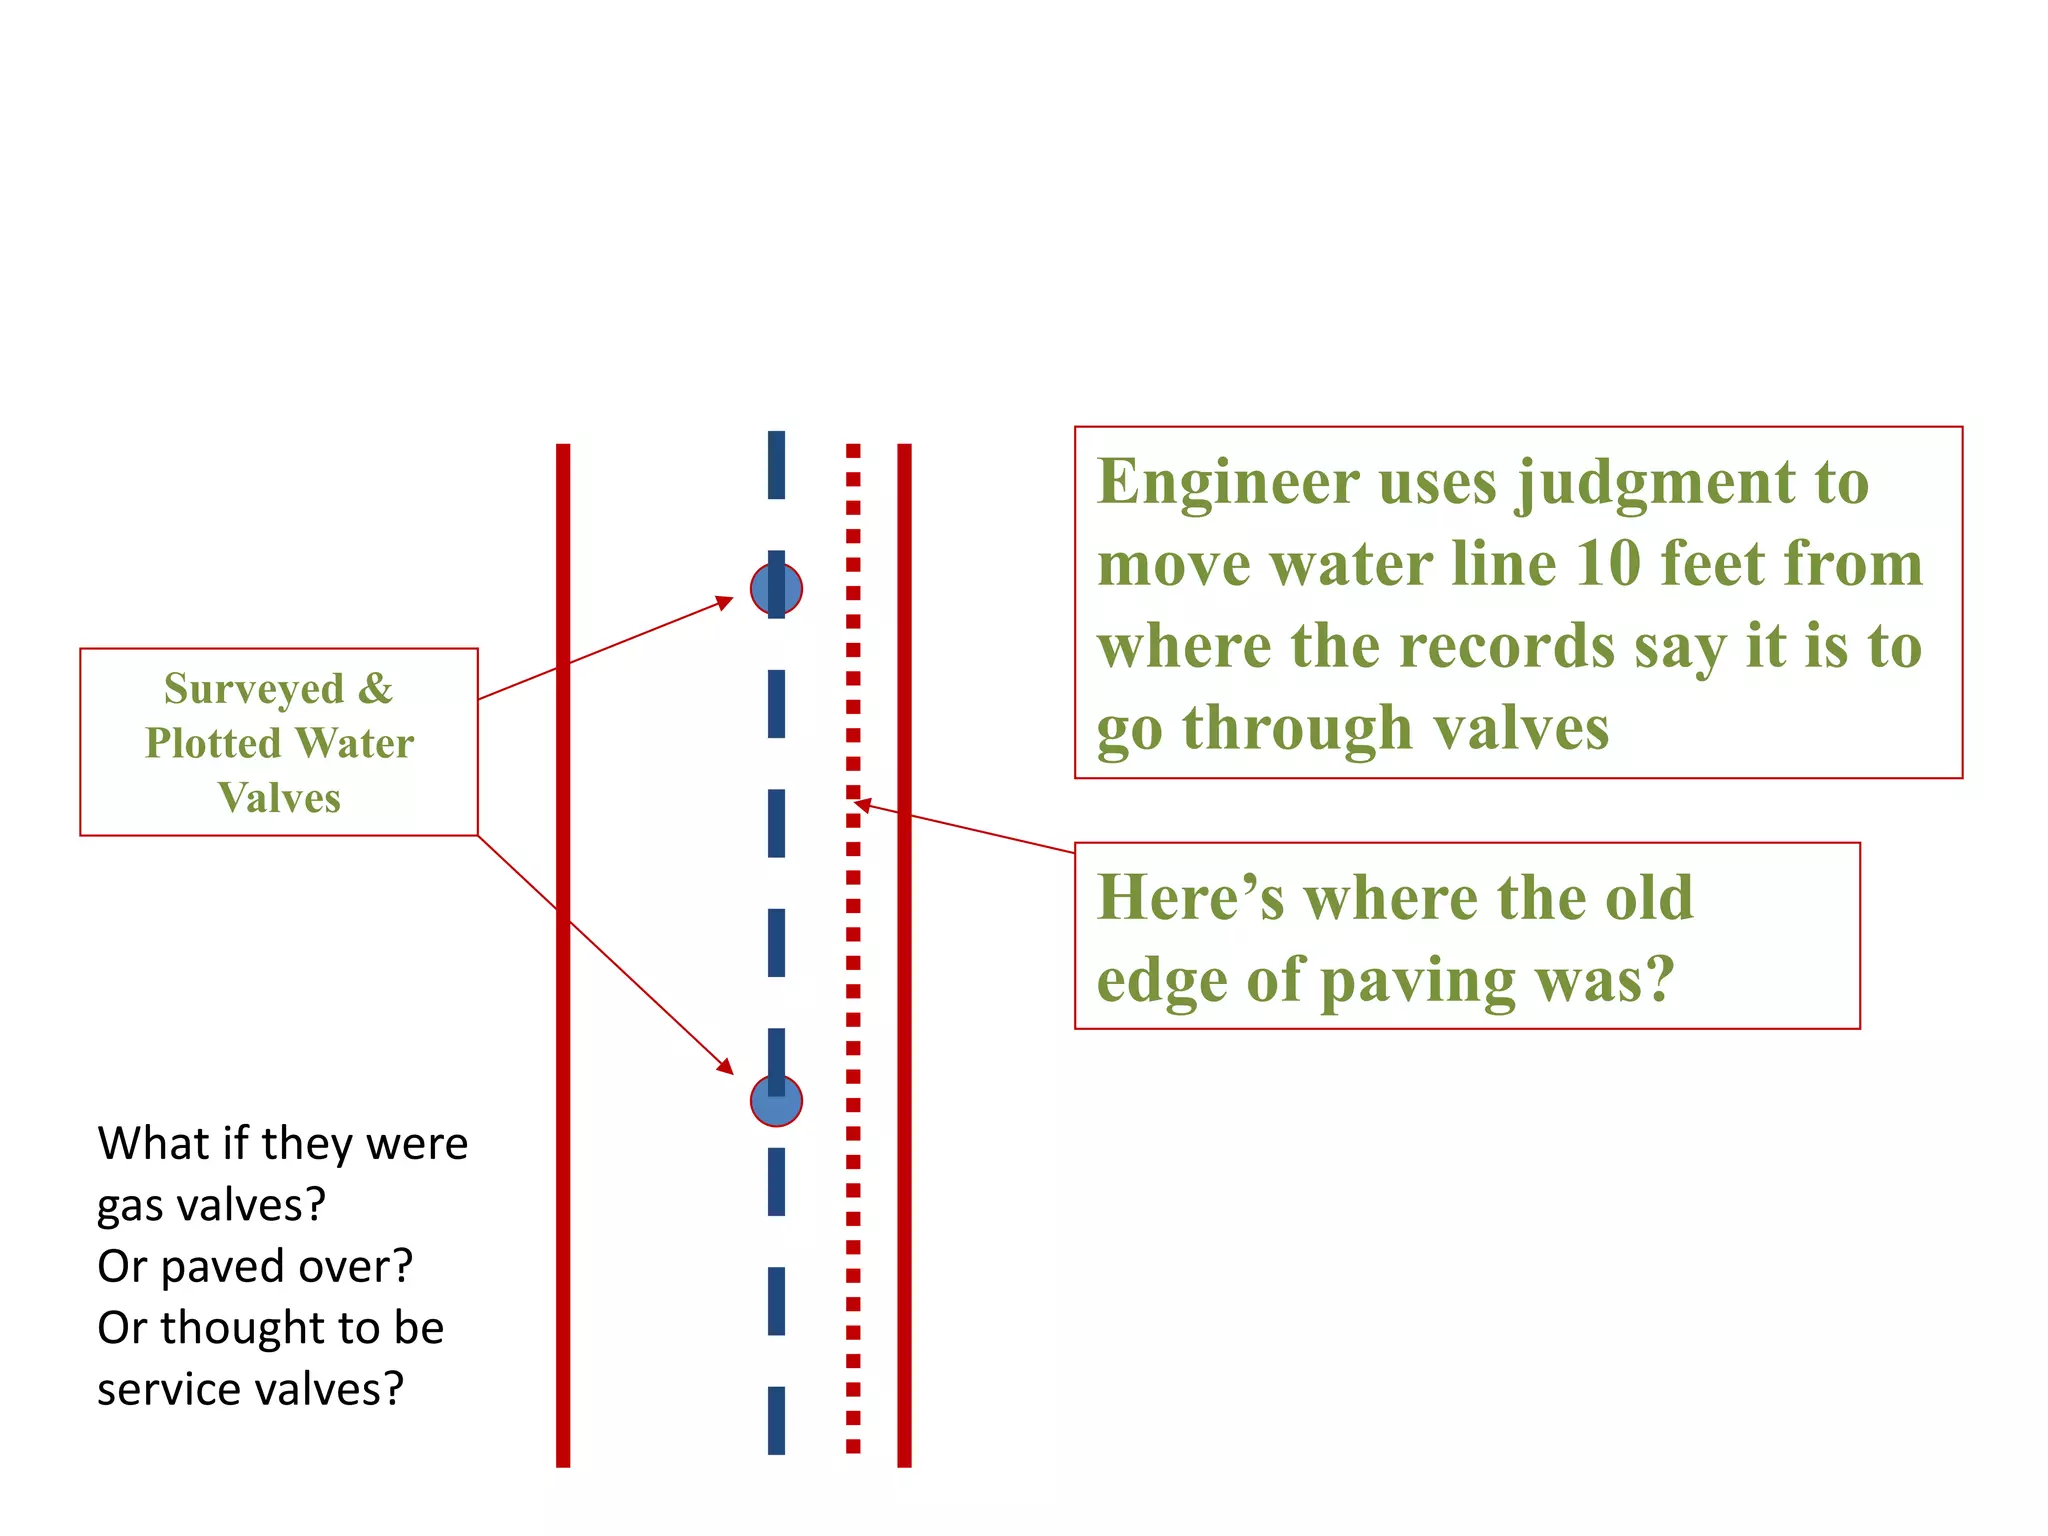

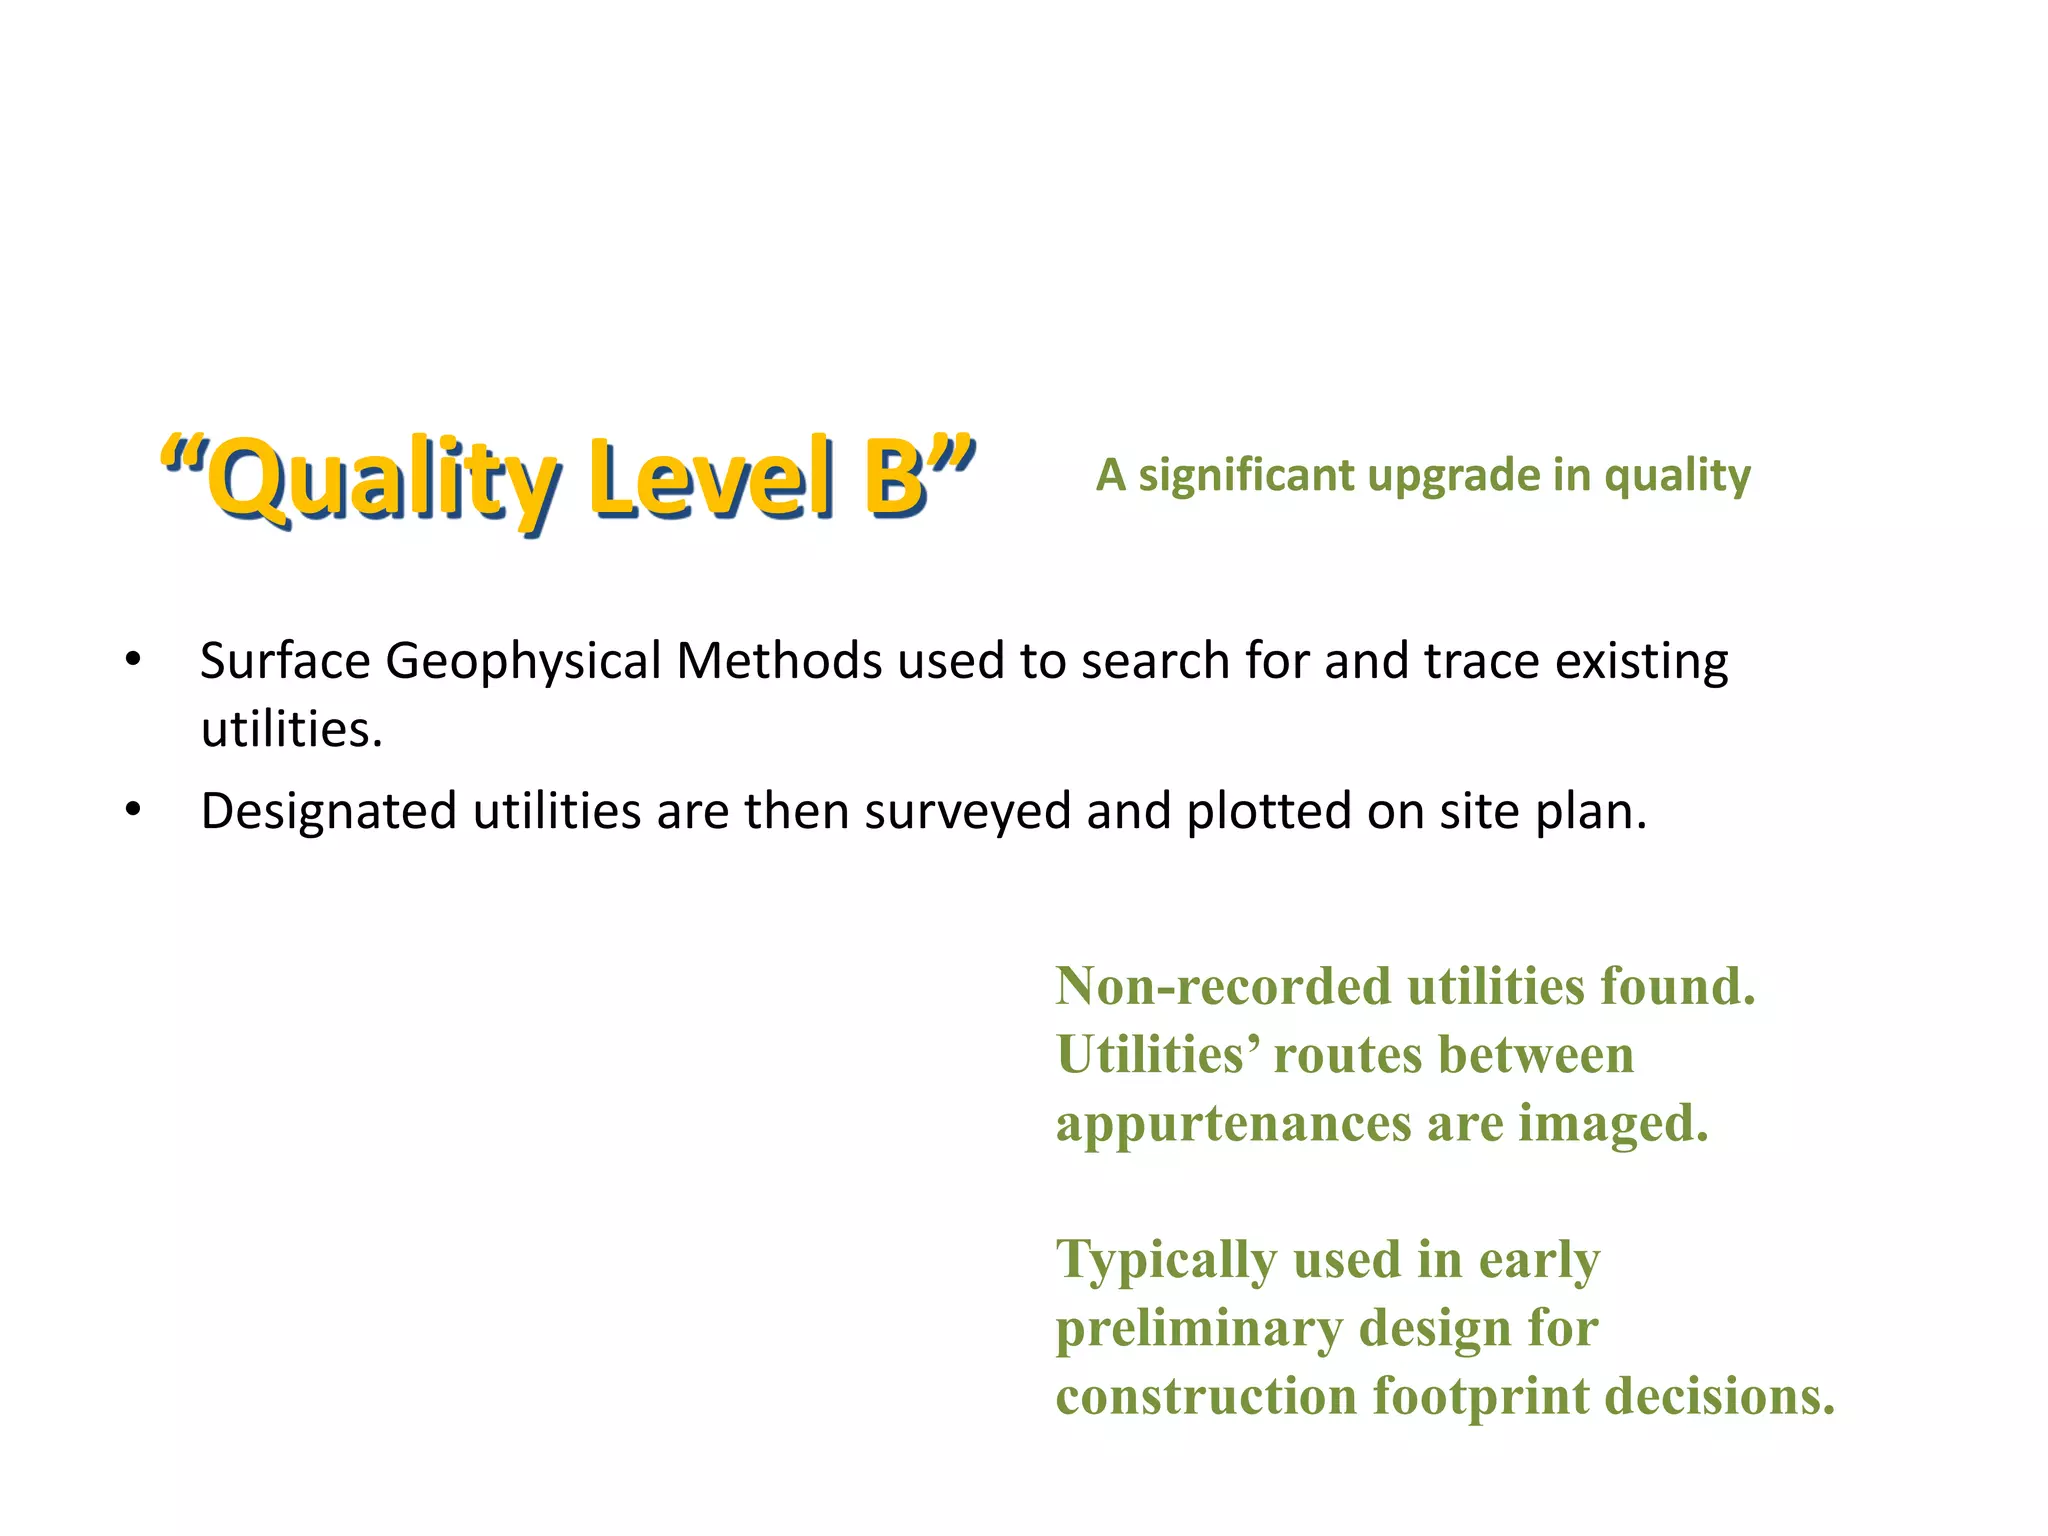

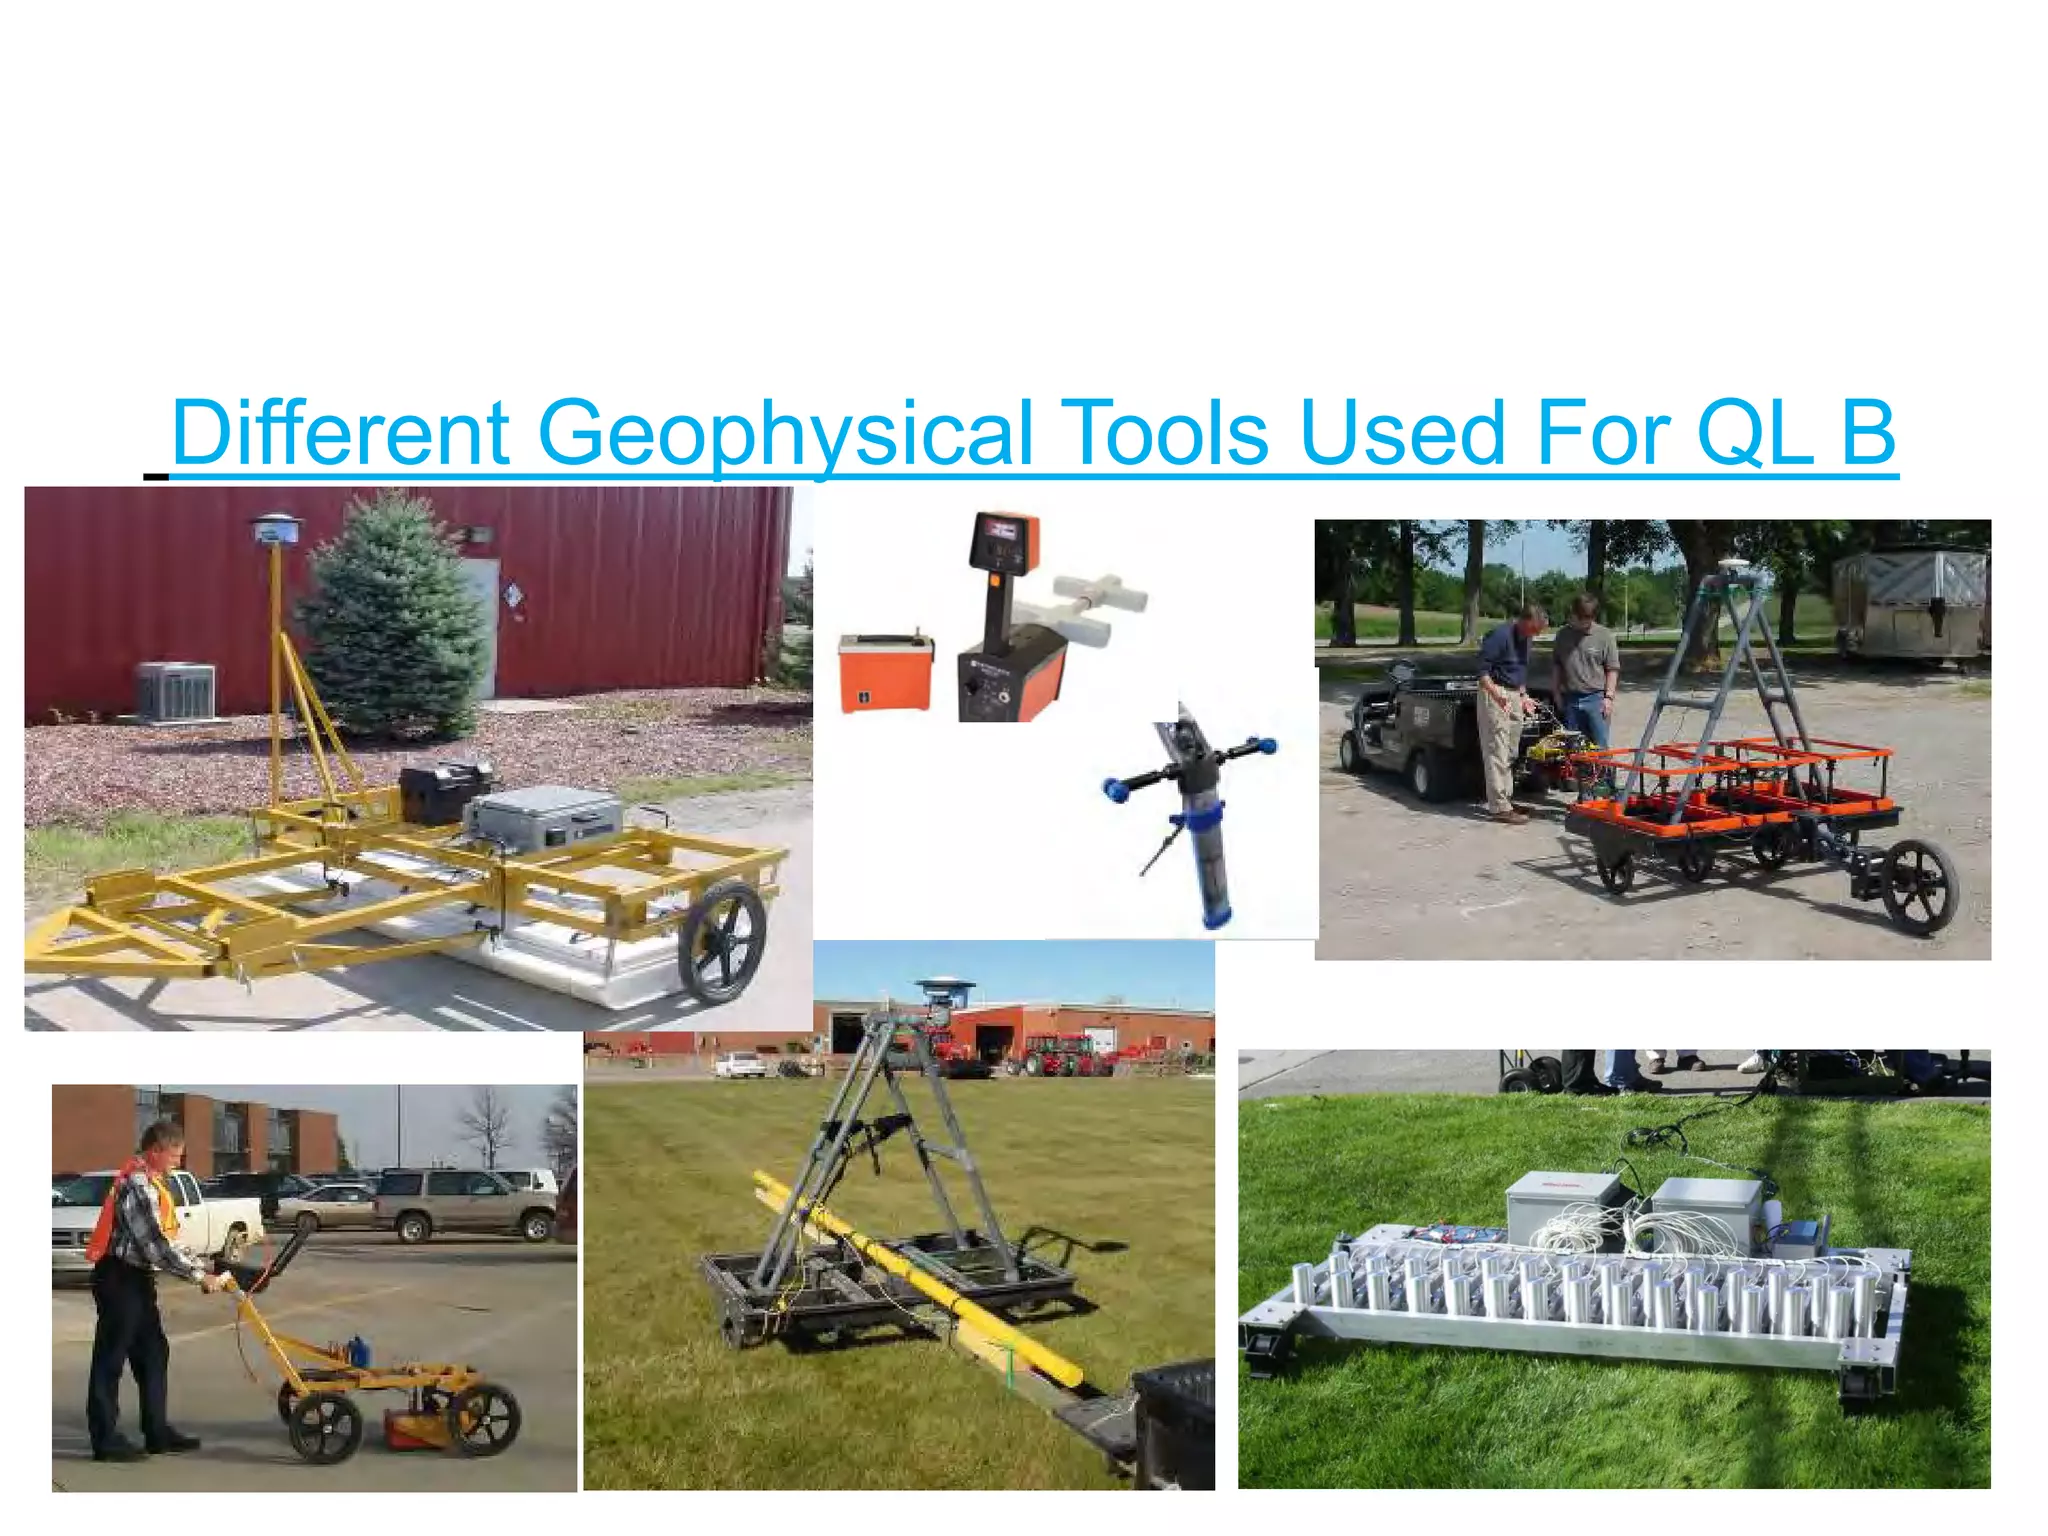


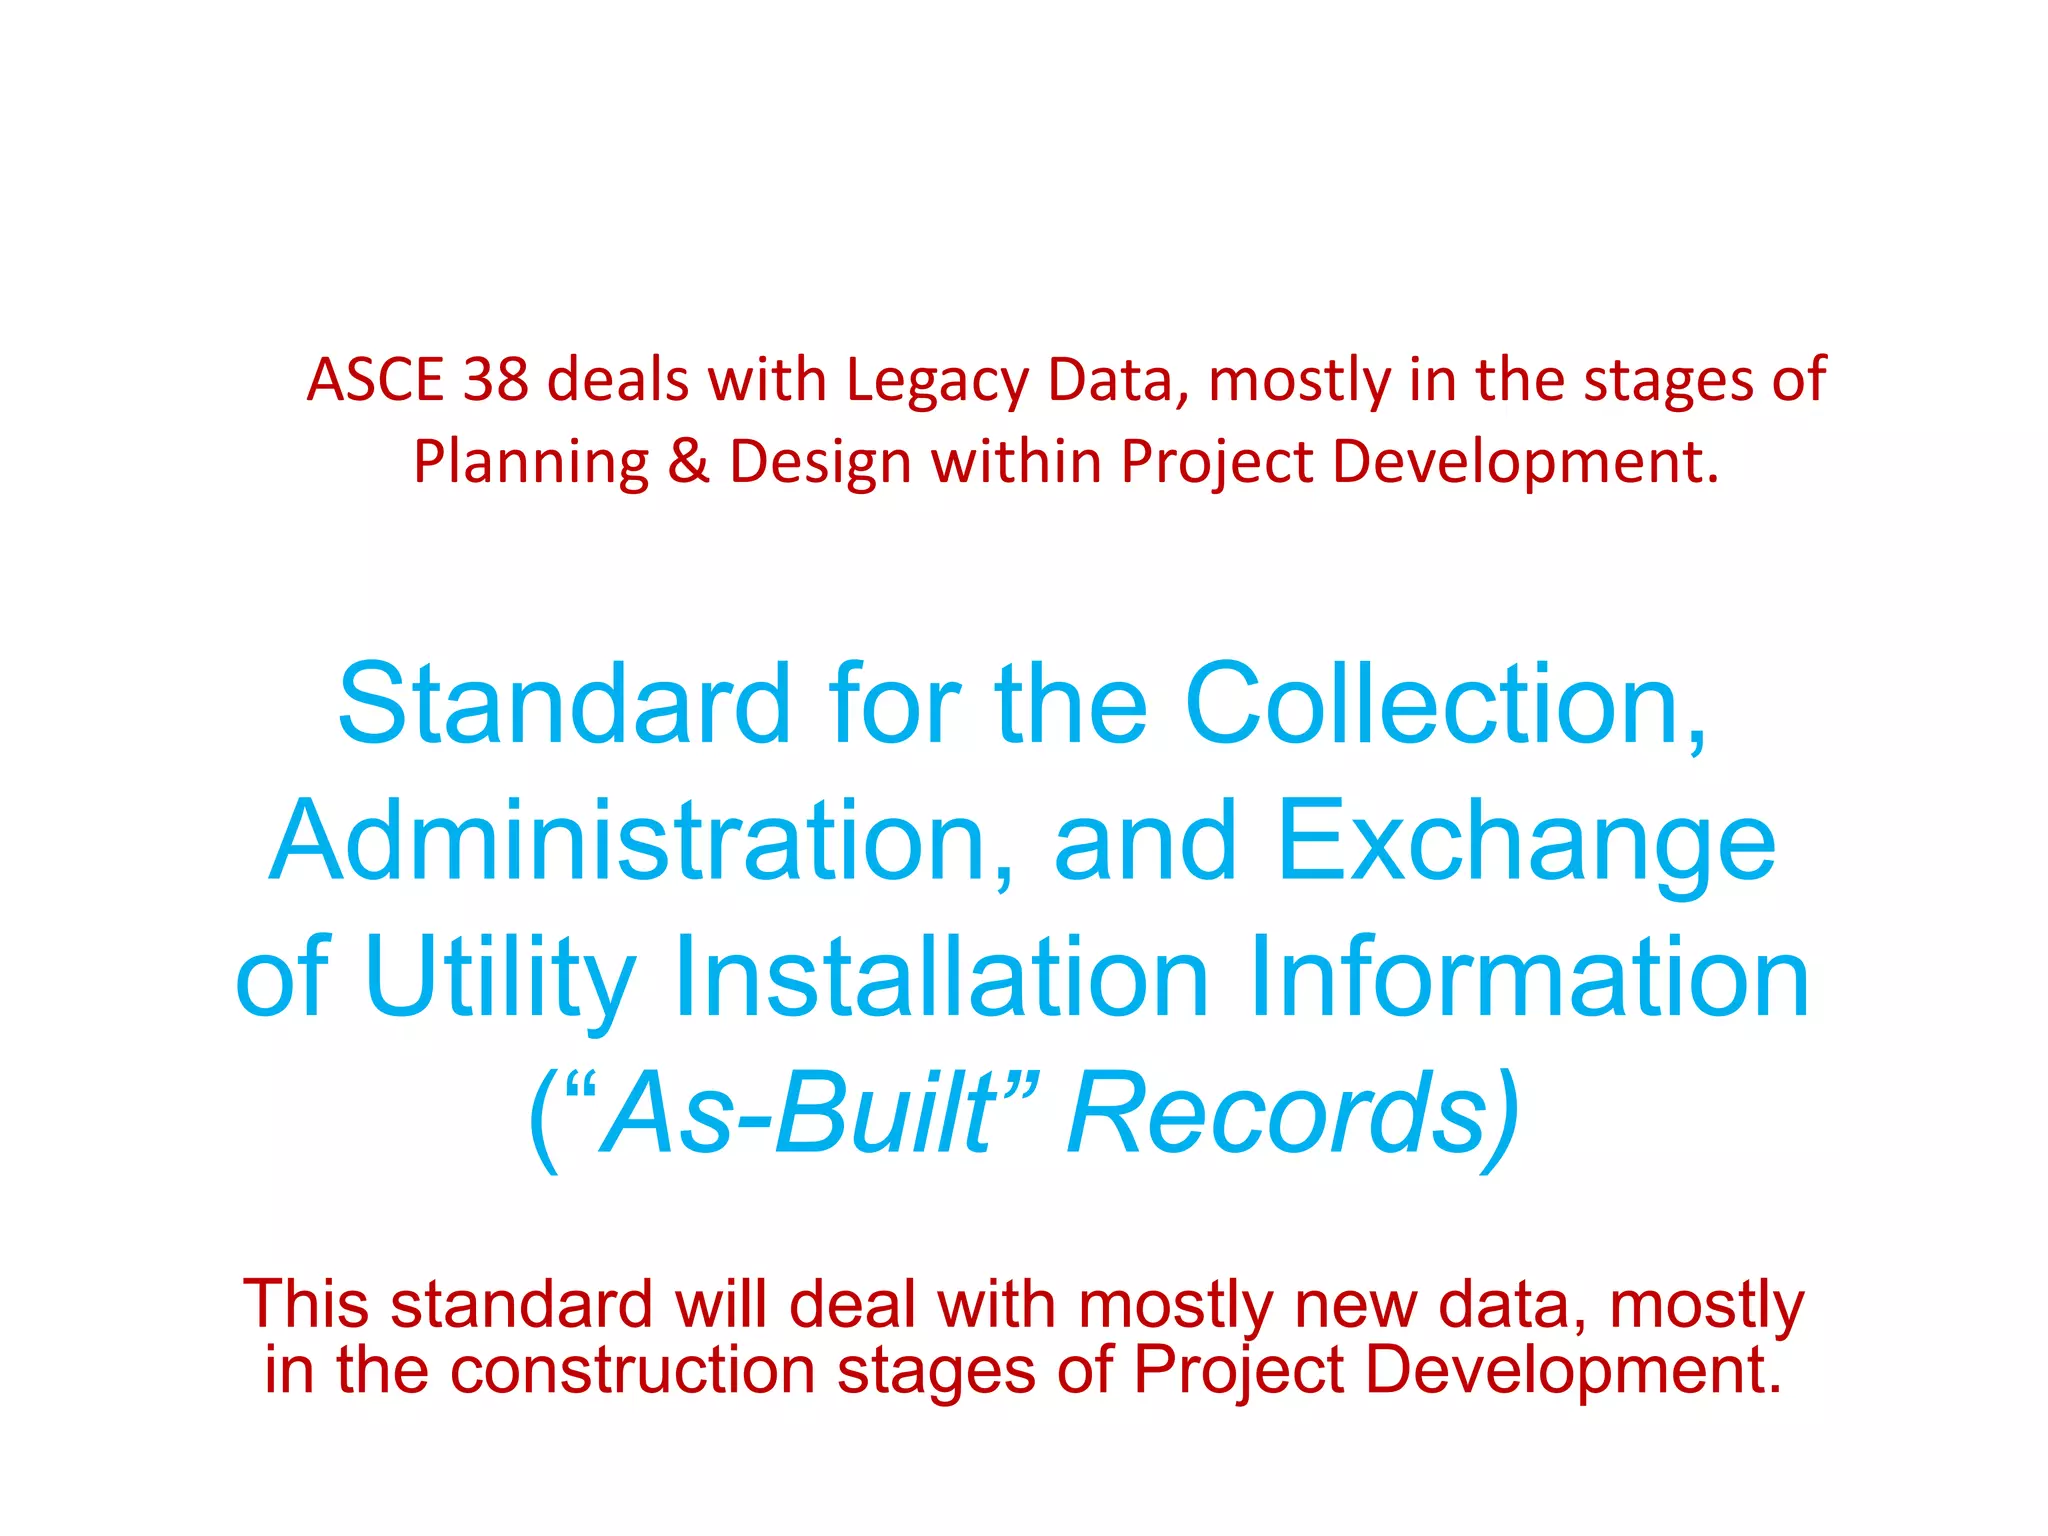


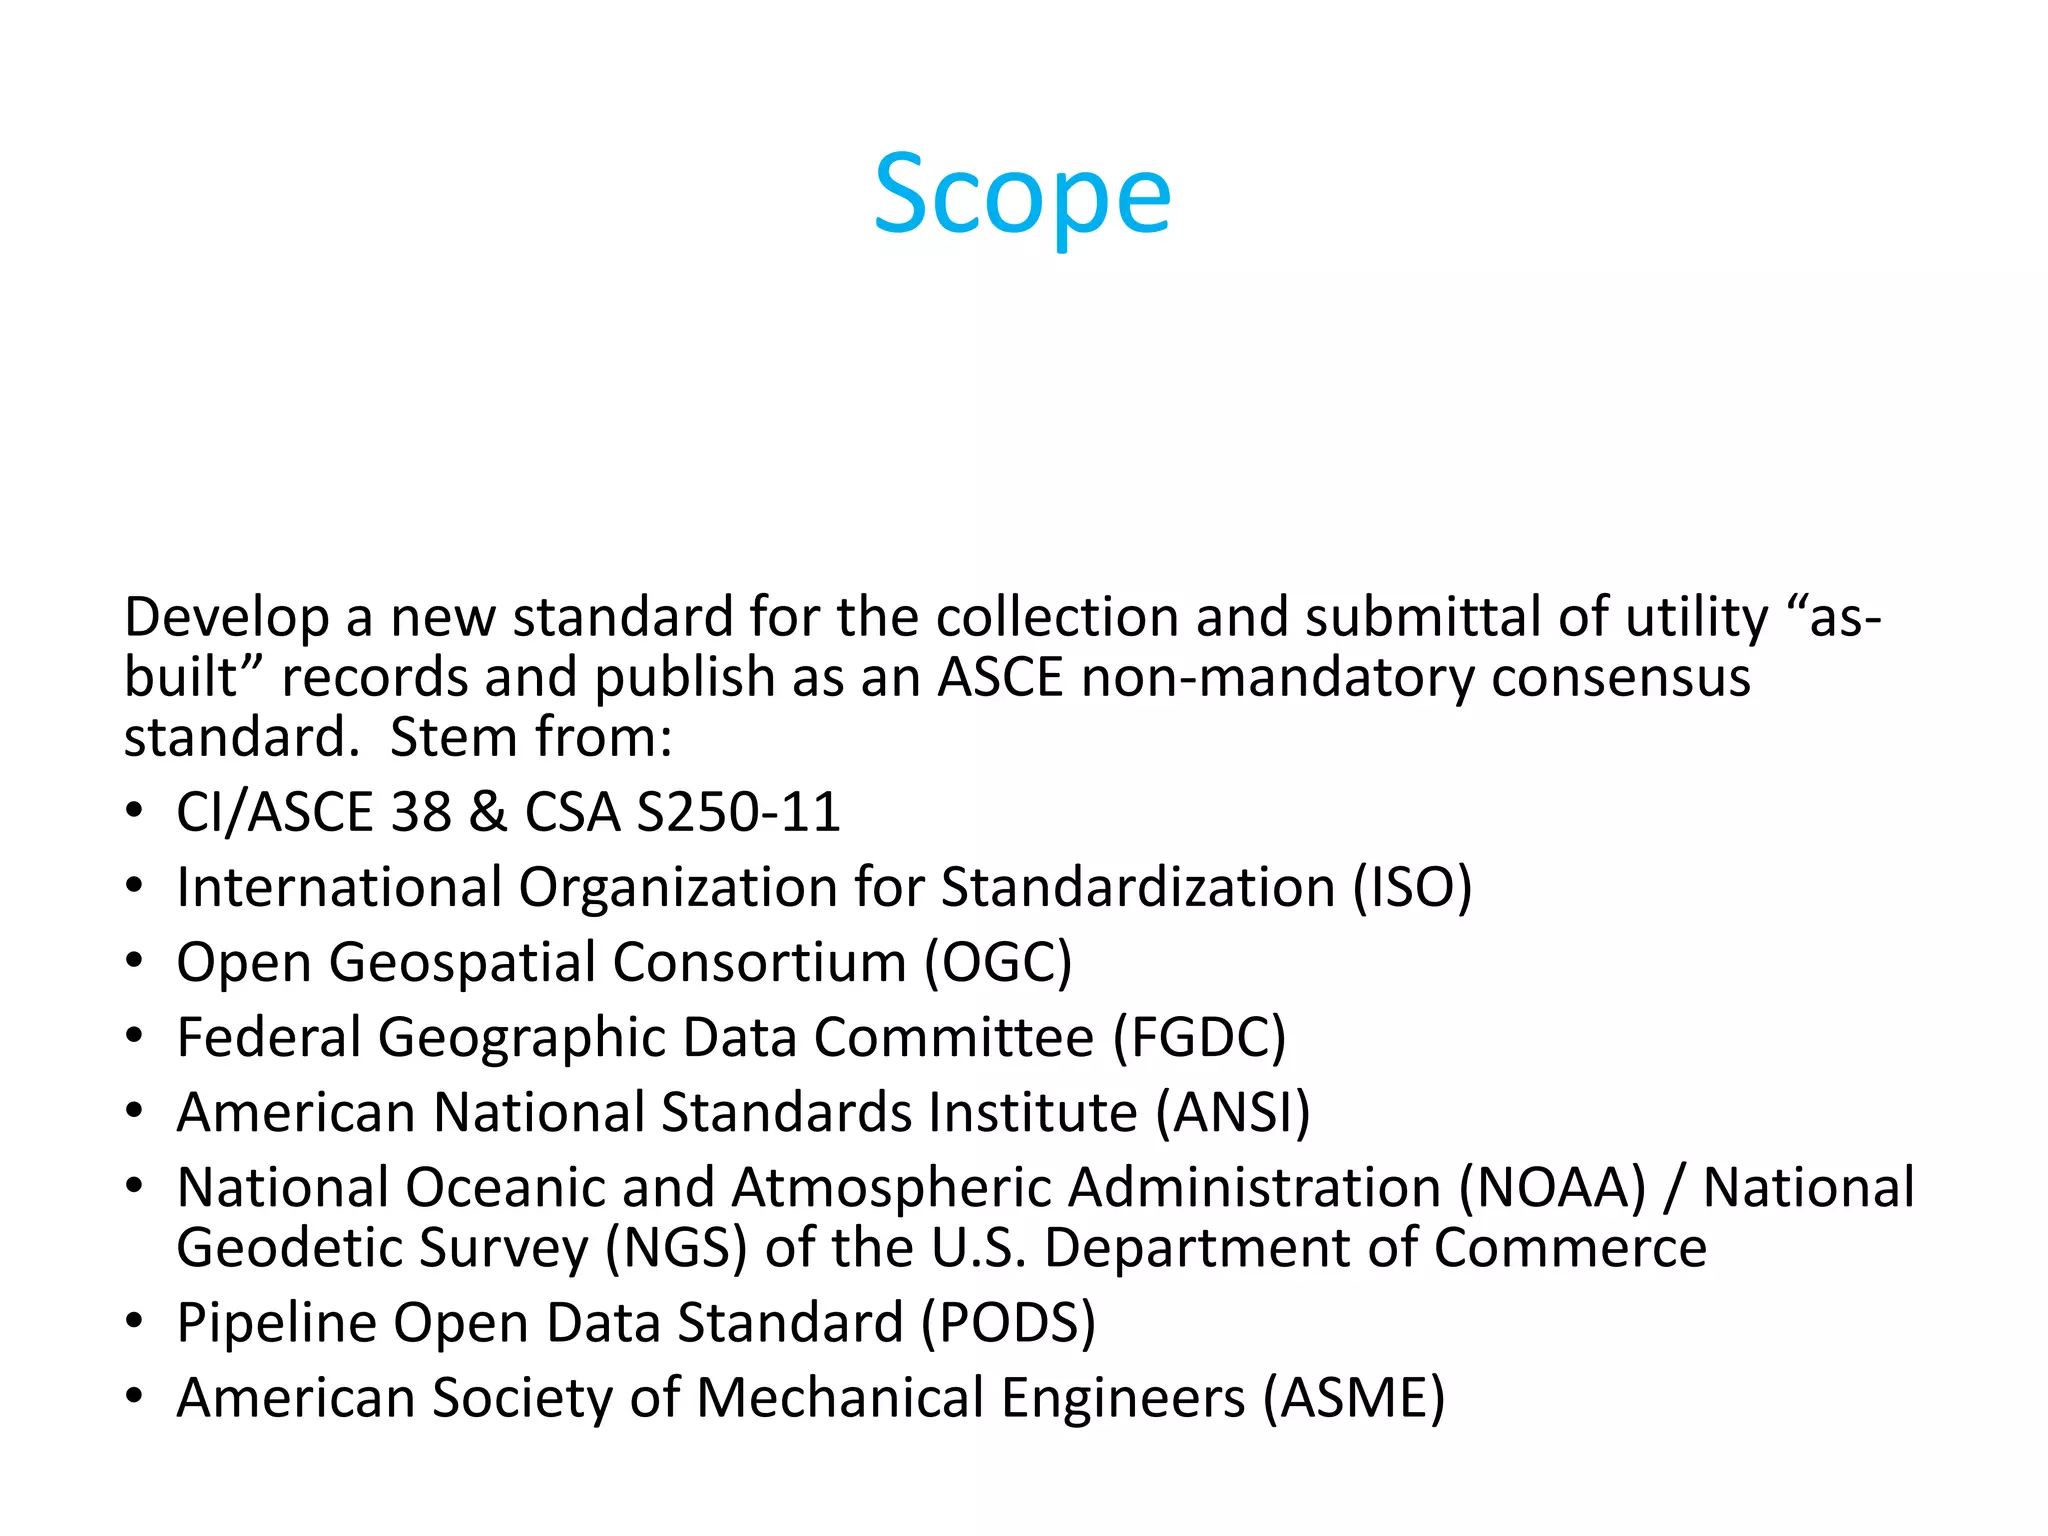


This document provides an overview of ASCE Utility Standards and subsurface utility engineering (SUE). It discusses: - The chair and involvement of Jim Anspach in several ASCE committees related to utility standards. - The large network of underground utilities in the US and challenges with incomplete or inaccurate legacy utility records. - The evolution of SUE from early practices of relying on limited records to modern techniques like surface geophysics and ground truthing utilities. - The development and importance of ASCE 38 in standardizing how utilities are depicted and classified by quality level, protecting engineers and allowing stakeholders to manage risks. - Other initiatives to further standardize utility mapping and "as-built" documentation through


![10 Geometric Design of Railway Track [Horizontal Alignment] (Railway Engineer...](https://cdn.slidesharecdn.com/ss_thumbnails/geometricdesignofrailwaytrack-i-200415171932-thumbnail.jpg?width=640&height=640&fit=bounds)


