The State of Orange County's Infrastructure - 2016 Report Card
•Download as PPSX, PDF•
1 like•536 views

The document provides an overview of the 2016 Orange County Infrastructure Report Card produced by the American Society of Civil Engineers. It discusses the importance of the report card in planning for the future and informing the public. Key points include that over 100 volunteers assessed 12 infrastructure categories and gave most a grade of C or D due to historical underfunding. The report highlights billions needed annually to address deficiencies. It emphasizes the importance of local funding and control to best maintain infrastructure.

Recommended
More Related Content
What's hot
What's hot (19)
Viewers also liked
Viewers also liked (19)
Similar to The State of Orange County's Infrastructure - 2016 Report Card
Similar to The State of Orange County's Infrastructure - 2016 Report Card (20)
More from American Society of Civil Engineers, Orange County Branch
More from American Society of Civil Engineers, Orange County Branch (12)
Recently uploaded
Recently uploaded (20)
The State of Orange County's Infrastructure - 2016 Report Card
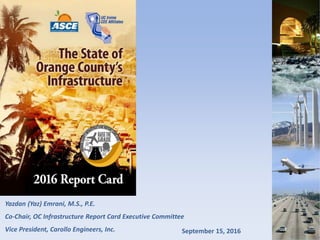
- 1. Yazdan (Yaz) Emrani, M.S., P.E. Co-Chair, OC Infrastructure Report Card Executive Committee Vice President, Carollo Engineers, Inc. September 15, 2016
- 2. A Little Bit of Background Fourth Time Around: 2002, 2005, 2010, & 2016 Professional Association: American Society of Civil Engineers, OC Branch Academics: UCI Civil & Environmental Engineering Affiliates Volunteer Effort - Over 100 Individuals Individuals: Engineers, public agency managers, business leaders, environmentalists
- 3. Why is a Report Card Important? Self-Imposed, not mandated by anyone The Power of Honest Self-Appraisal To Properly Plan for the Future Fully Inform the Public & Policy Makers Establish Community Expectations Embolden Policy Makers Have a Uniform & Consistent Message
- 4. Historical Reluctance to Fund Infrastructure Renewal “Out of Sight, Out of Mind” Attitude Leads to Two Bad Outcomes: Unexpected Failures Major Rate Increases
- 5. Because… Municipalities and Other Public Agencies Cannot Afford the Problems and Risks Associated with... High-Cost Emergencies & Damage Repairs System Failures & Liability Claims Customer Outrage from Service Outages
- 6. A damaged 5-foot sewer pipe collapsed and spilled a total of about 2.4 million gallons of untreated waste into the Los Angeles River and has forced the closure of all beaches in Long Beach and Seal Beach.
- 7. Impartial Analysis & Independent Review 12 Standing Chapter Committees 12 Review Committees Executive Committee for continuity and executive summary Results reported openly and transparently
- 8. Evaluation Criteria General condition of the infrastructure Capacity vs. Demand Operation and functionality Sustainability (Resources & Funding) Security Estimated Cost
- 9. “Report Card” as the Paradigm Good News: simple and familiar Easy and quick to understand Useful for Spotting Overall Trends Sound bites are what we’re used to Bad News: Lumps too much and misses details A grade isn’t enough to tell the story Read the grade and read the report & Create your own City Report Card
- 10. Report Cards CA-2012 National- 2013 Aviation C+ D Bridges C- C+ Drinking Water C D Energy D+ Ports B- C Roads C- D Schools D Transit C- D Wastewater C+ D Inland Waterways D- Solid Waste B C+ Parks D- Rail C+ Levees D D- Hazardous Waste D Dams D Urban Runoff D+ GPA C D+ Annual Investment Needs: $ 2.3 B (Does not include Oil, Electric Power, or Natural Gas)
- 12. “Report Card” as the Paradigm A grade isn’t enough to tell the story Read the grade and read the report & Create your own City Report Card
- 13. Aviation: A- JWA excellent condition. Little repair backlog Fee-based income & other sources cover costs 10.8 million passenger capacity at JWA 25 million passenger demand by 2020 Must use other airports High speed rail to regional airports is the solution
- 14. Electric Power: C- SCE, SDG&E and Anaheim serve OC CPUC regulates them Reliability through interties, repairs and standards Much better than average reliability CPUC-approved rate increases insufficient System is aging with inadequate replacement rates Condition and reliability will degrade in next 5 years
- 15. Flood Control: C- 380 miles of flood control channels, 114 miles of levees, 34 retarding basins, 15 dams and 13 pump stations Available funding is decreasing Costs for projects are increasing Mitigation costs rival project costs $2.7 billion in unmet capital needs 90 years to address backlog with existing spending rates
- 16. Ground Transportation: C Ground Transportation Components: Local Streets and Highways Bridges Transit & Rail $4.0 billion since 1990 Measure M gave major transportation system upgrades Measure M2 generates about $300 million/year. FAST provides $155 million/year 30% of pavement is poor or very poor OC Funding shortfall: $585 million/year
- 17. Natural Gas: B- The natural gas system provides the fuel for home heating, cooking, manufacturing, generating electricity, powering trucks and buses throughout Southern California including in Orange County. We have the nation’s largest natural gas distribution utility, Southern California Gas, with 21.6 million consumers through 5.9 million meters in more than 500 communities. The infrastructure is regulated by the California Public Utilities Commission (CPUC) and follows State and Federal pipeline safety and other regulations to meet the CPUC’s requirements.
- 18. Oil: B- Orange County’s 2.5 million vehicles are consuming about 3 million gallons of transportation fuels a day. California is an energy “island”. Orange County receives 100% of its transportation fuel needs from three transportation fuel manufacturing centers on the West Coast: Pacific Northwest, San Francisco, and Los Angeles.
- 19. Parks, Recreation, and Environment: C+ This is the same grade as the 2010 report as the condition and capacity of parks, recreation and environment facilities have been relatively steady in the past five year. Currently, Orange County operates a total of 22 regional parks. Additionally, each of the 34 cities within Orange County operates and maintains local parks within its jurisdiction. While some existing facilities have been upgraded in the past few years, there are still larger challenges for the state’s parks because of the current California drought, slow recession recovery, insufficient funding, and growing population.
- 20. School Facilities: C+ 500,000 students, 600 schools, 28 districts Enrollment leveling or shrinking helps overcrowding O&M funding is lagging $525 million in deferred maintenance and getting worse Condition of school facilities are degrading Schools are in financial freefall
- 21. Solid Waste: B Robust disposal and recycling system 65% recycling rate meets State’s AB 939 Tipping fees match capital & operating costs Capacity meets demand Long-term sustainability is likely
- 22. Surface Water Quality: D+ Untreated polluted urban runoff drains to streams & beaches Regional Water Quality Control Board regulations require major improvements Stormwater management is not considered a utility. As such, projects, programs, and services that protect and improve surface water quality must compete for general fund dollars. New community habits and source control essential to clean up urban runoff
- 23. Wastewater: B Water conservation=less wastewater Less sewage spills since 2010 because of better maintenance and FOG control (WDR Order) 1940s & 1950s sewers need replacement Wastewater treatment plants in good shape and in compliance Most cities and special districts have dedicated enterprise funds for sewers and treatment plants Continued improvement in future
- 24. Water Supply: B In-County systems in good shape Income sufficient to support capital, O&M Conservation, recycling and desalination increasing and essential Drought is a major issue. 50% of OC’s water comes from Colorado River and State Water Project State-wide reliability is degrading.
- 25. This is not good, is it?? We must aim to remedy these problems in the short term. Emergency repairs can cost anywhere from 5- 16 times more than on-time and preventive maintenance Repairs get worse over time, not better. We can’t afford to keep kicking the can down the road.
- 26. So, What’s the Solution? 1. The “Self-Help” Model 2. Pay As You Go 3. Public Private Partnership (PPP) 4. Environmental Streamlining 5. Optimized Decision Making Tools/ Principles of Effective Asset Management
- 27. An Observation about OC Infrastructure Orange County Infrastructure is at its best with local initiatives, local ownership, local control, local public support and local funding.
- 28. 10 Ways for YOU to make a difference! 1) Read the Report Card 2) Tell a colleague about this discussion 3) Make this a topic of dinner conversation 4) Subscribe to infrastructure newsletters 5) Add infrastructure topics to your meetings 6) Ask us to speak at your meetings 7) Assign this issue to someone in your office 8) Join our efforts, speak for us 9) Call or visit an elected public official 10) Support local, State and Federal officials who support infrastructure renewal. Ask them to make infrastructure an election issue.
- 29. “Just invest in those infrastructure that you want to keep!!!”