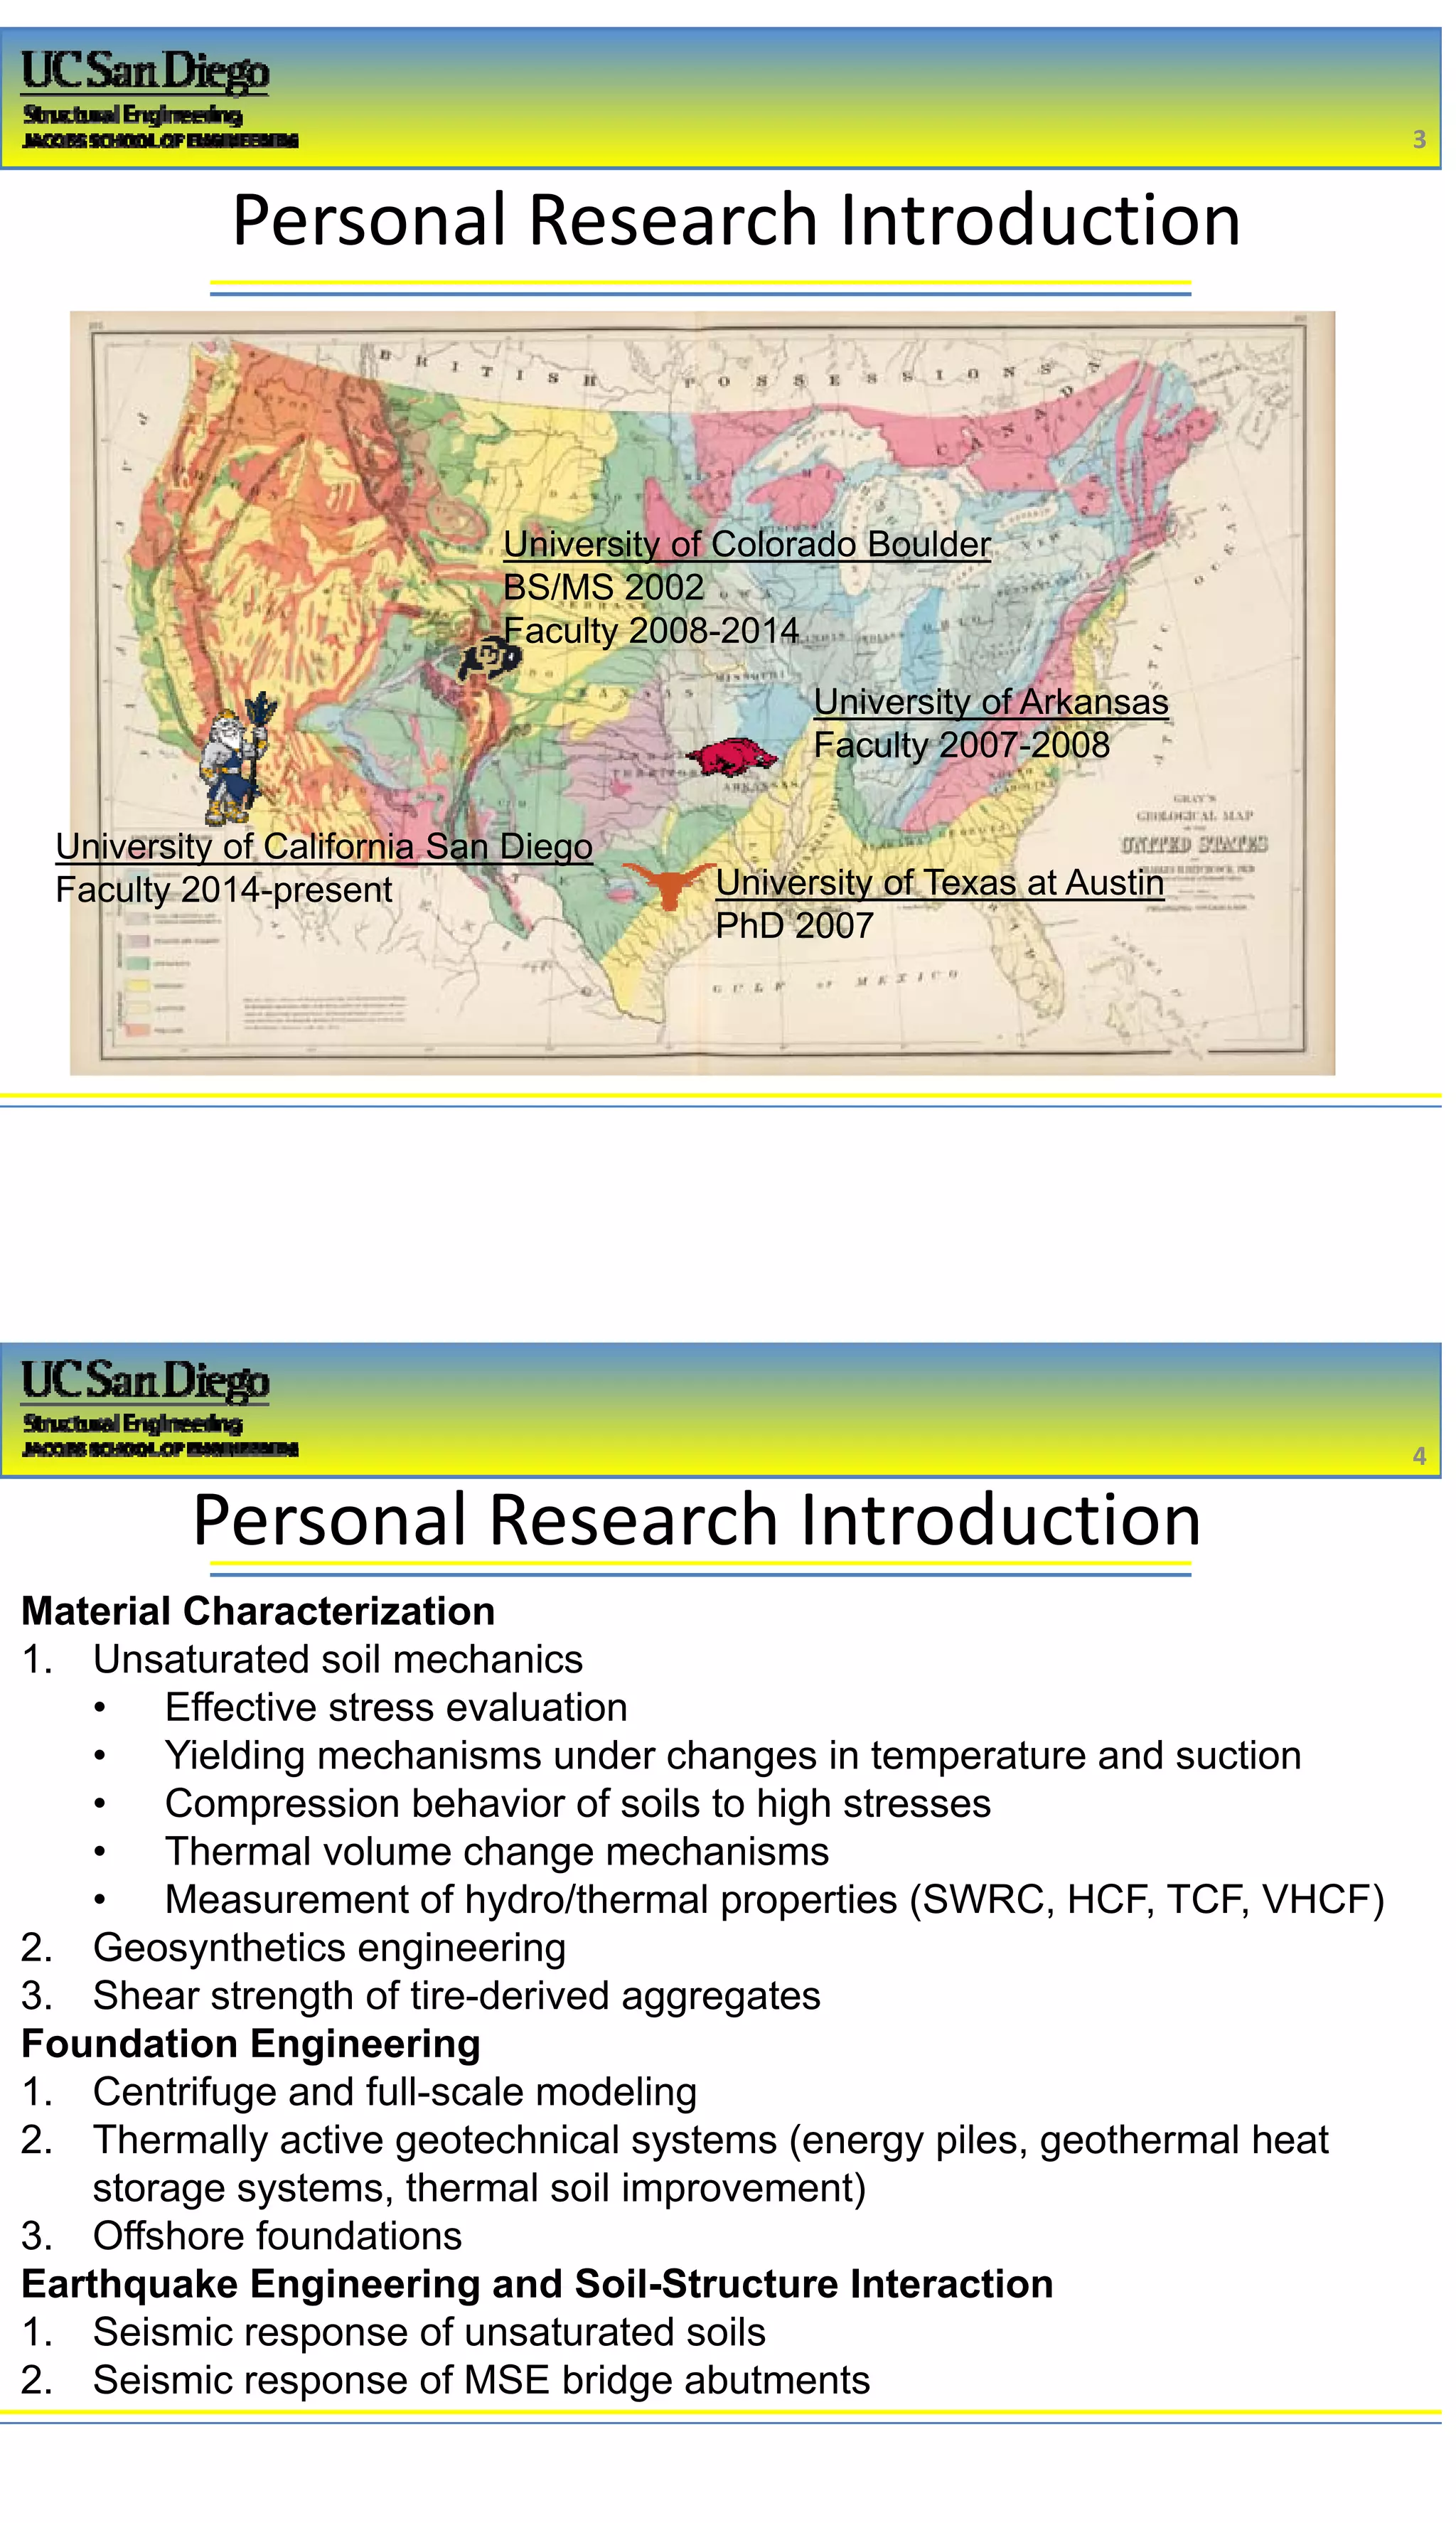
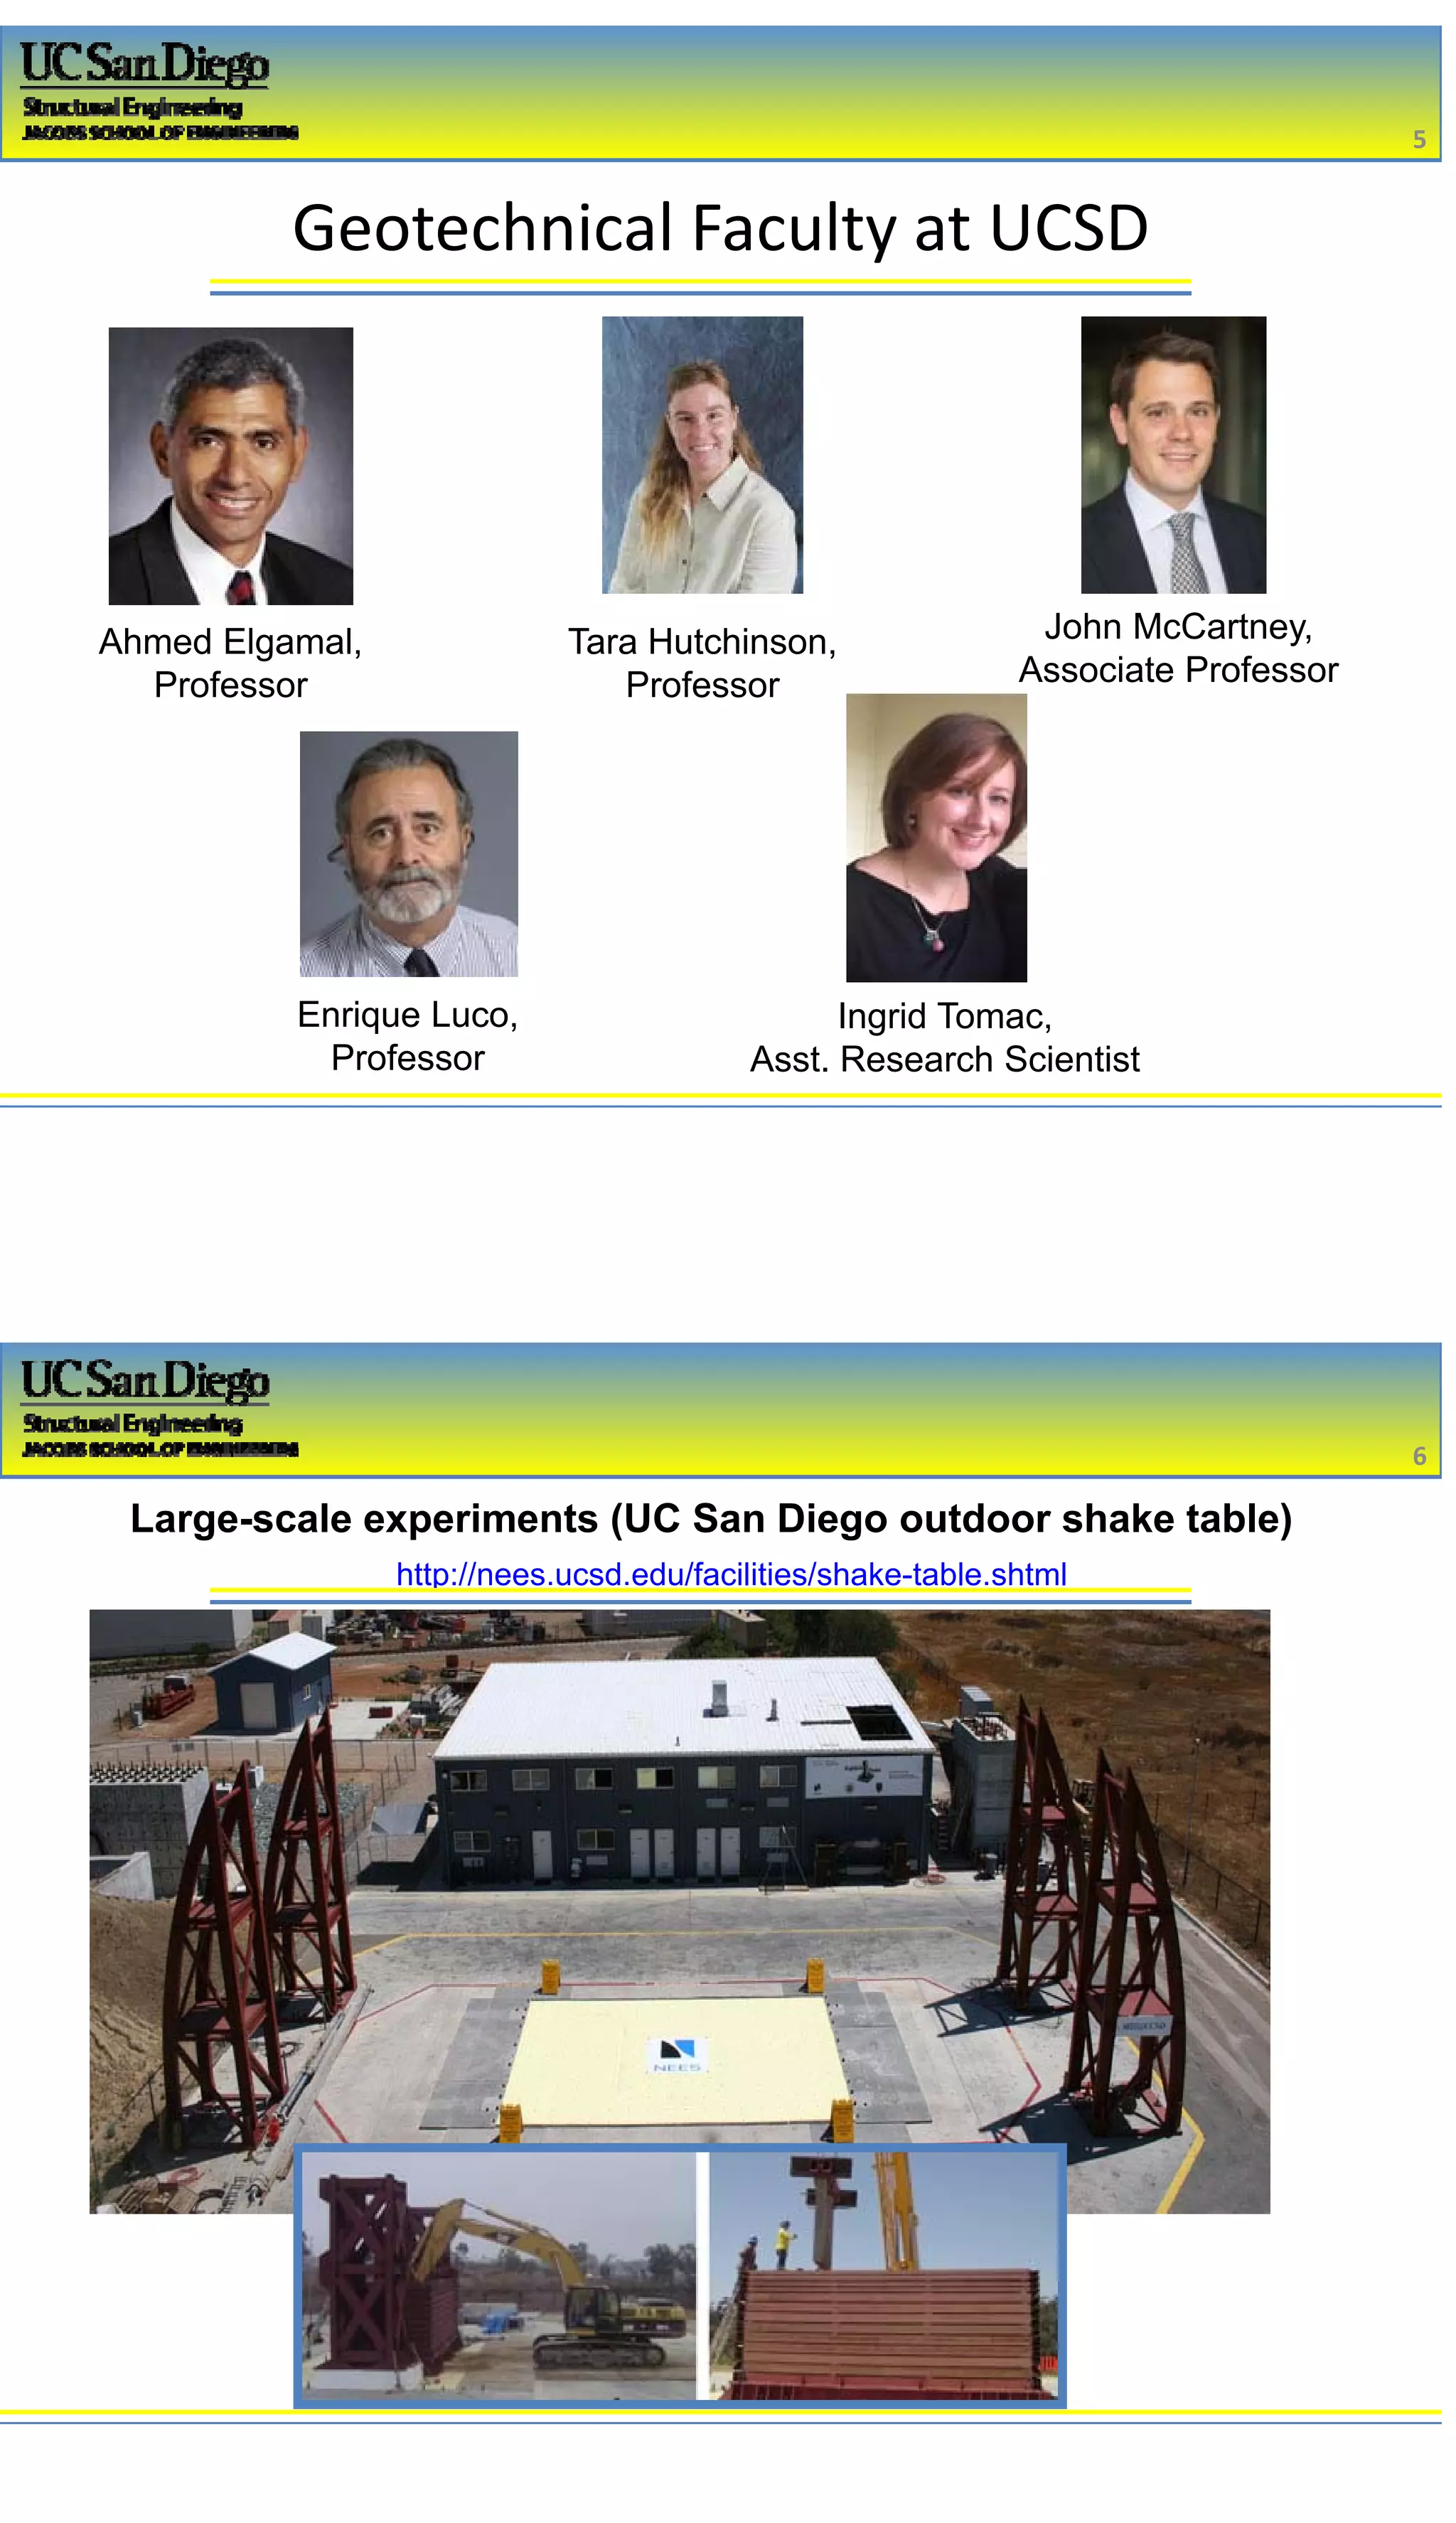
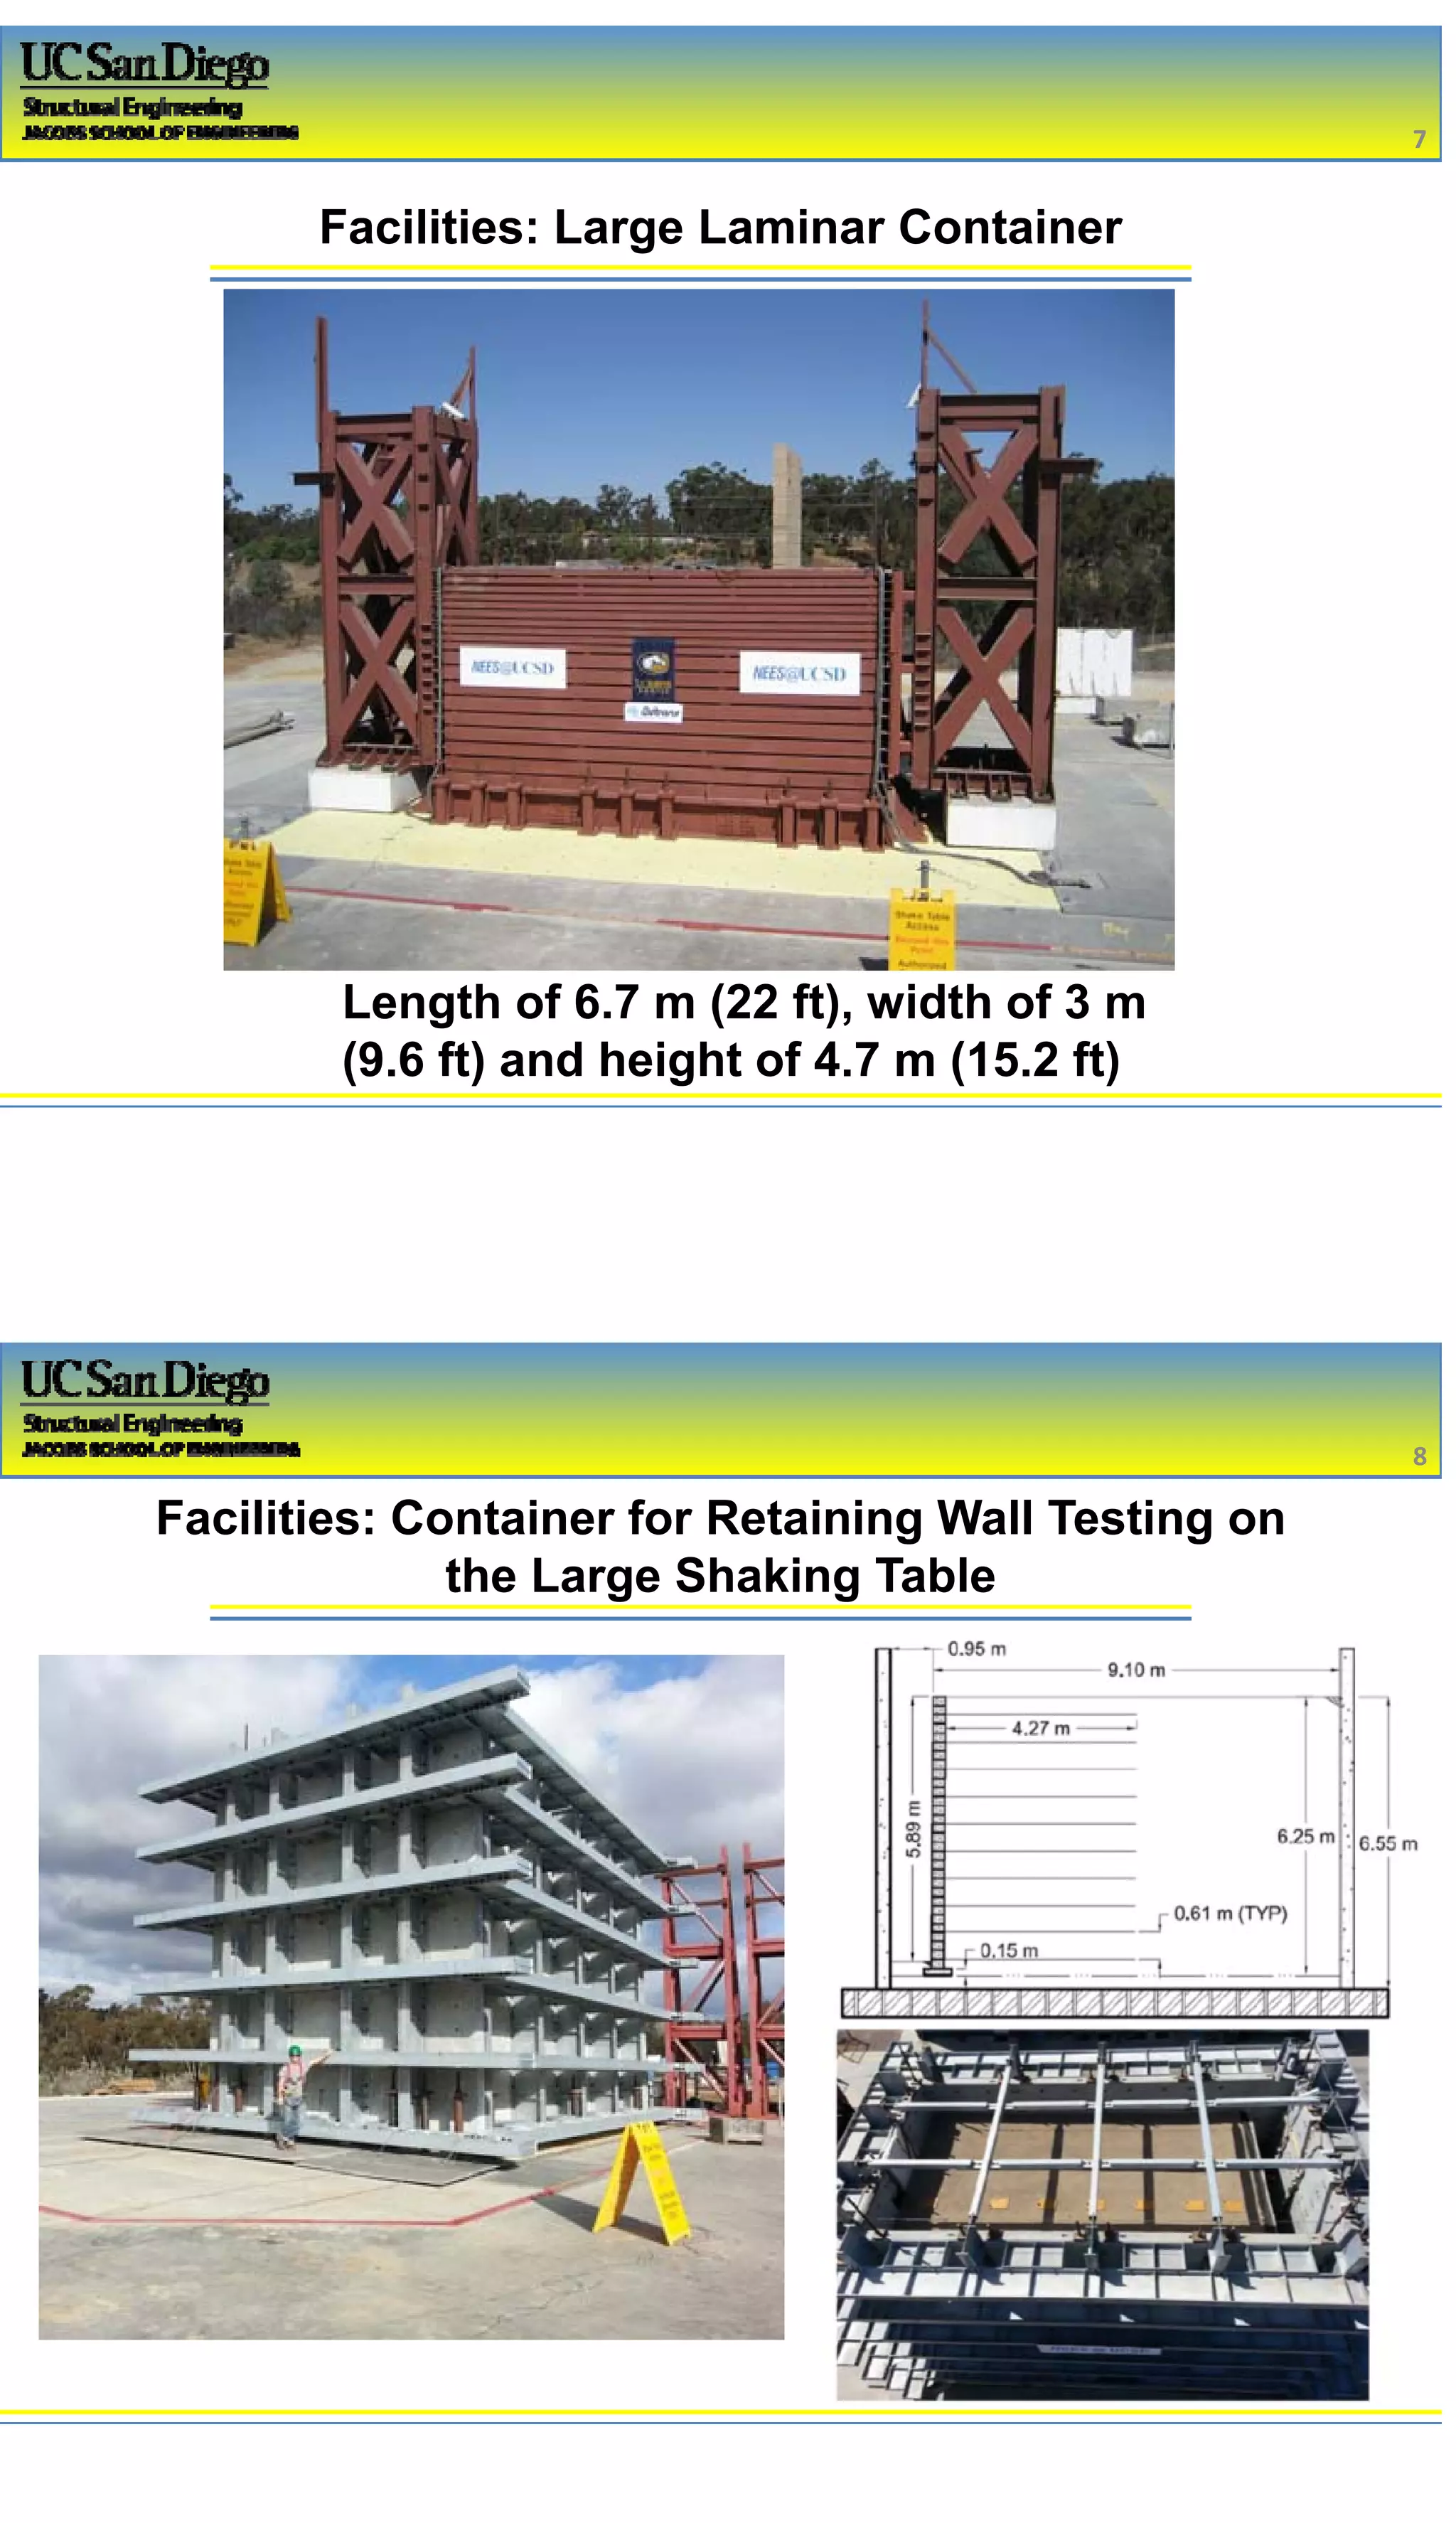
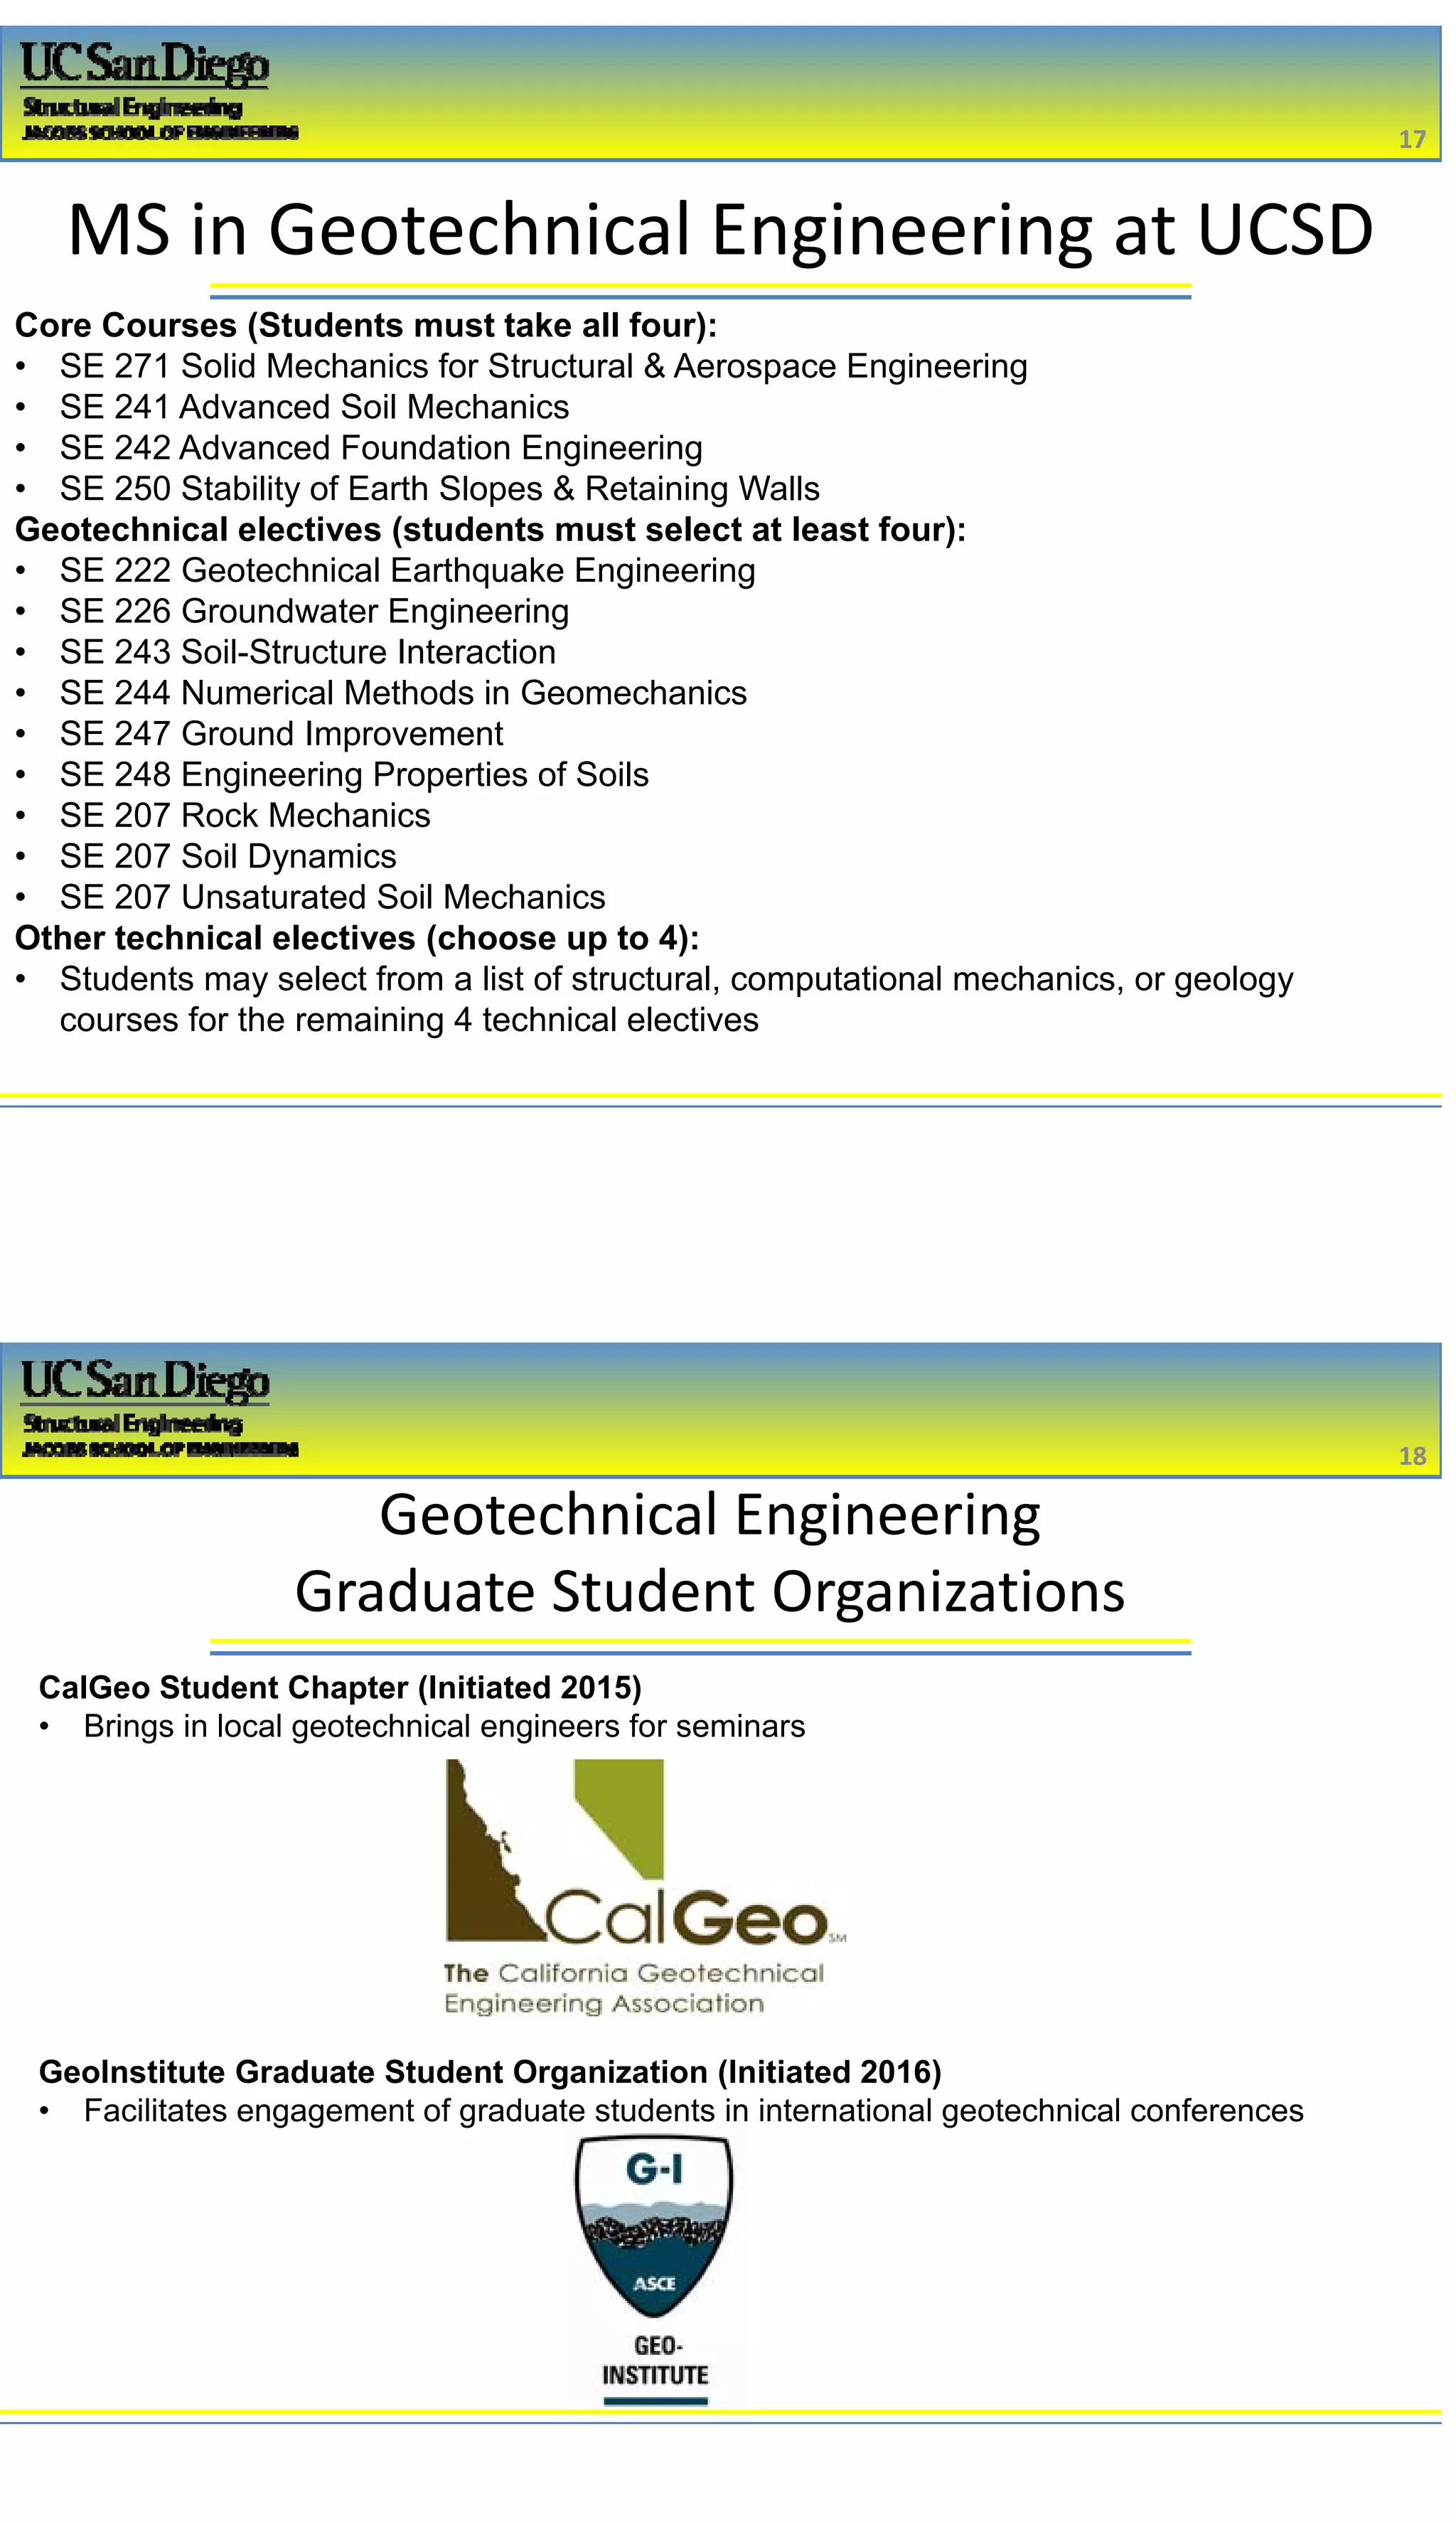
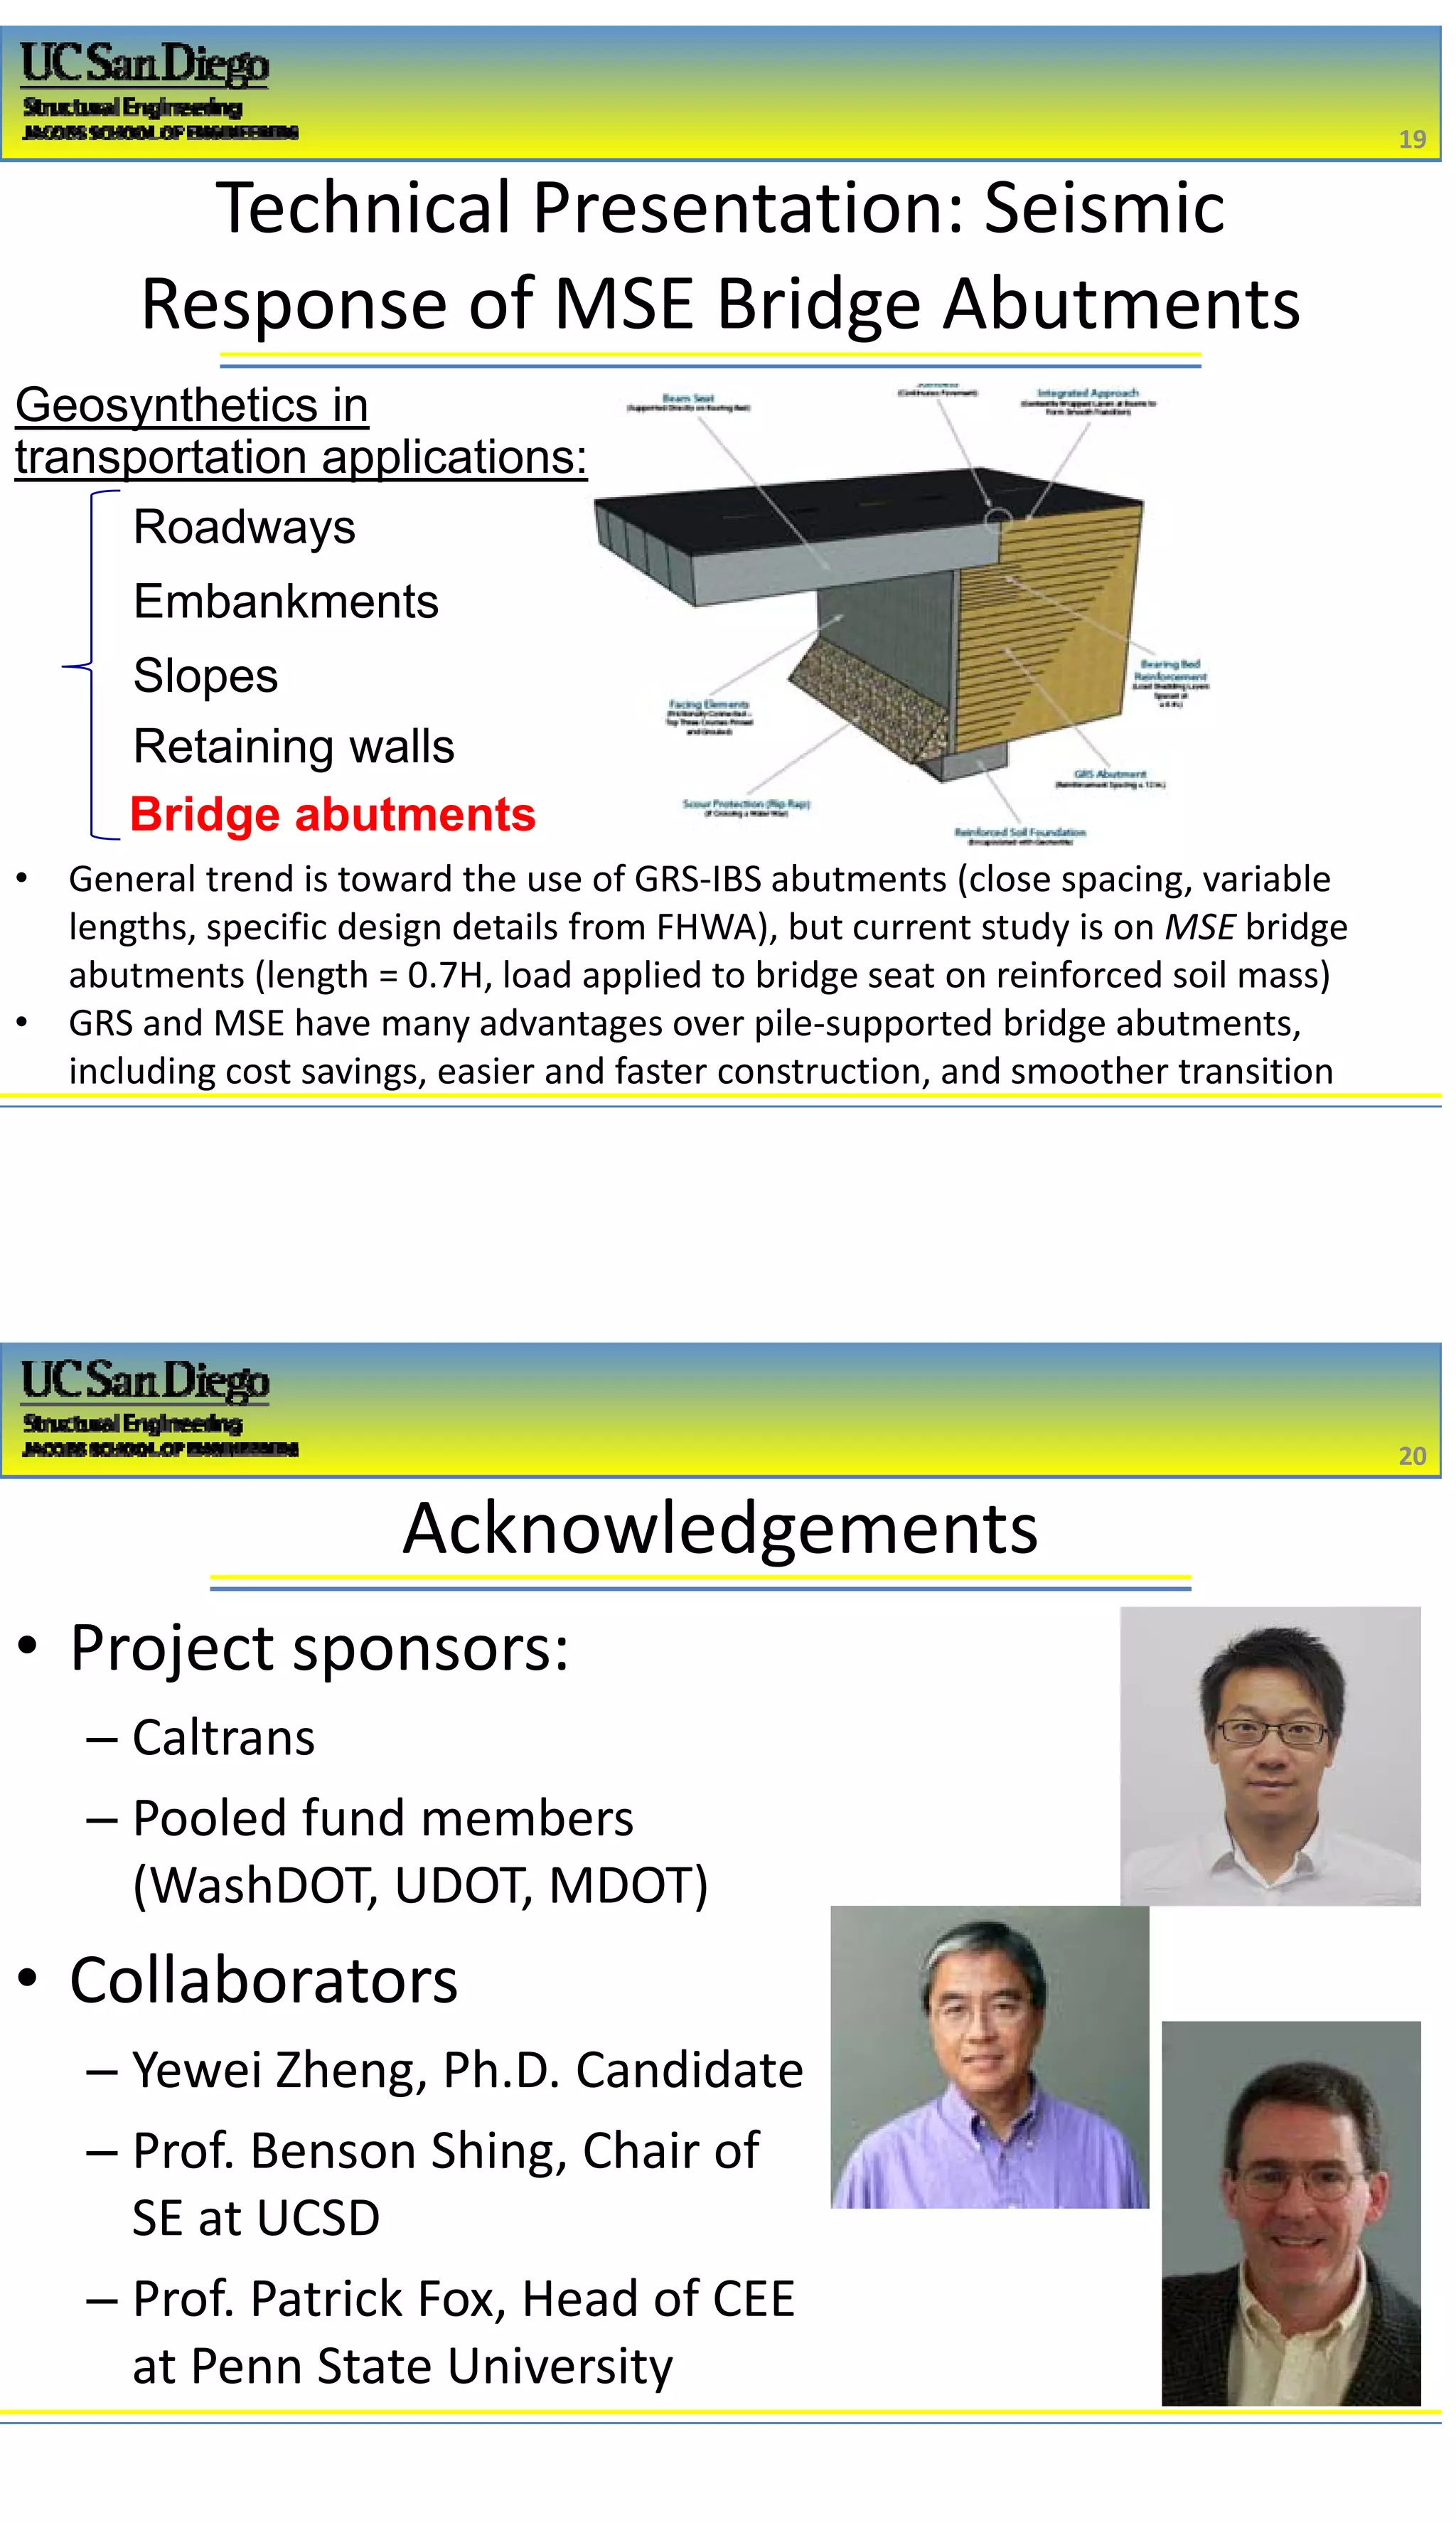
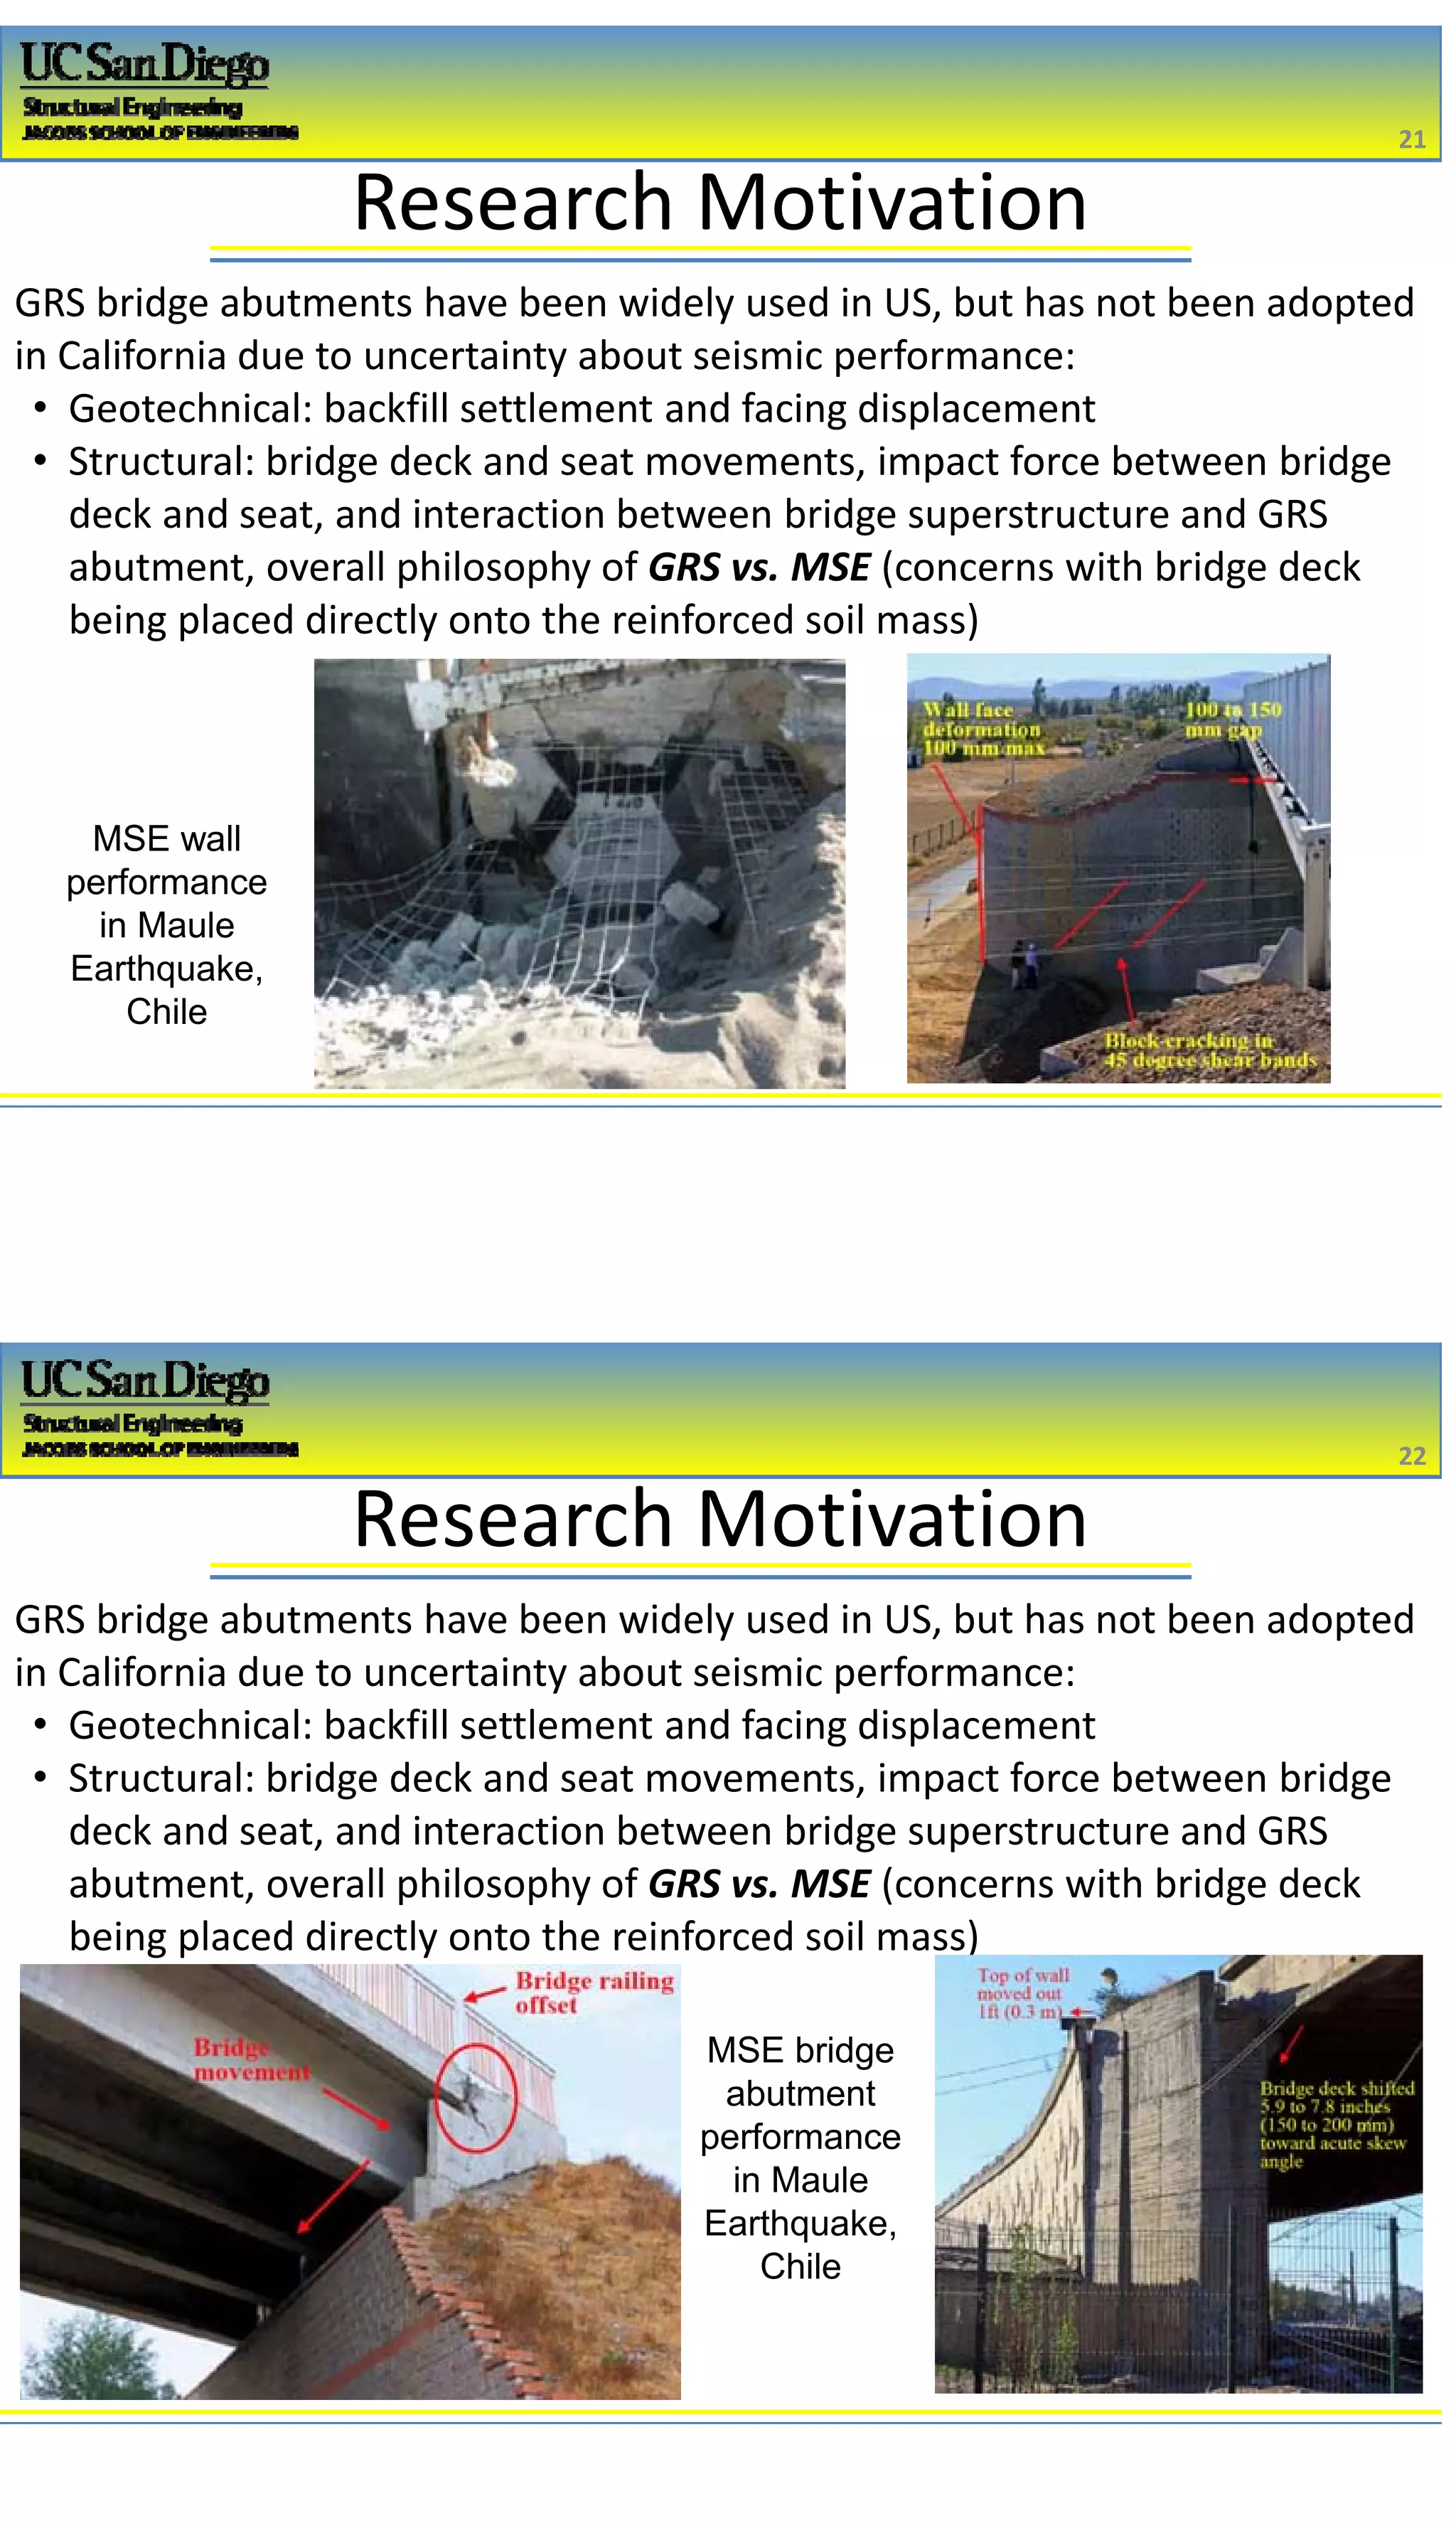
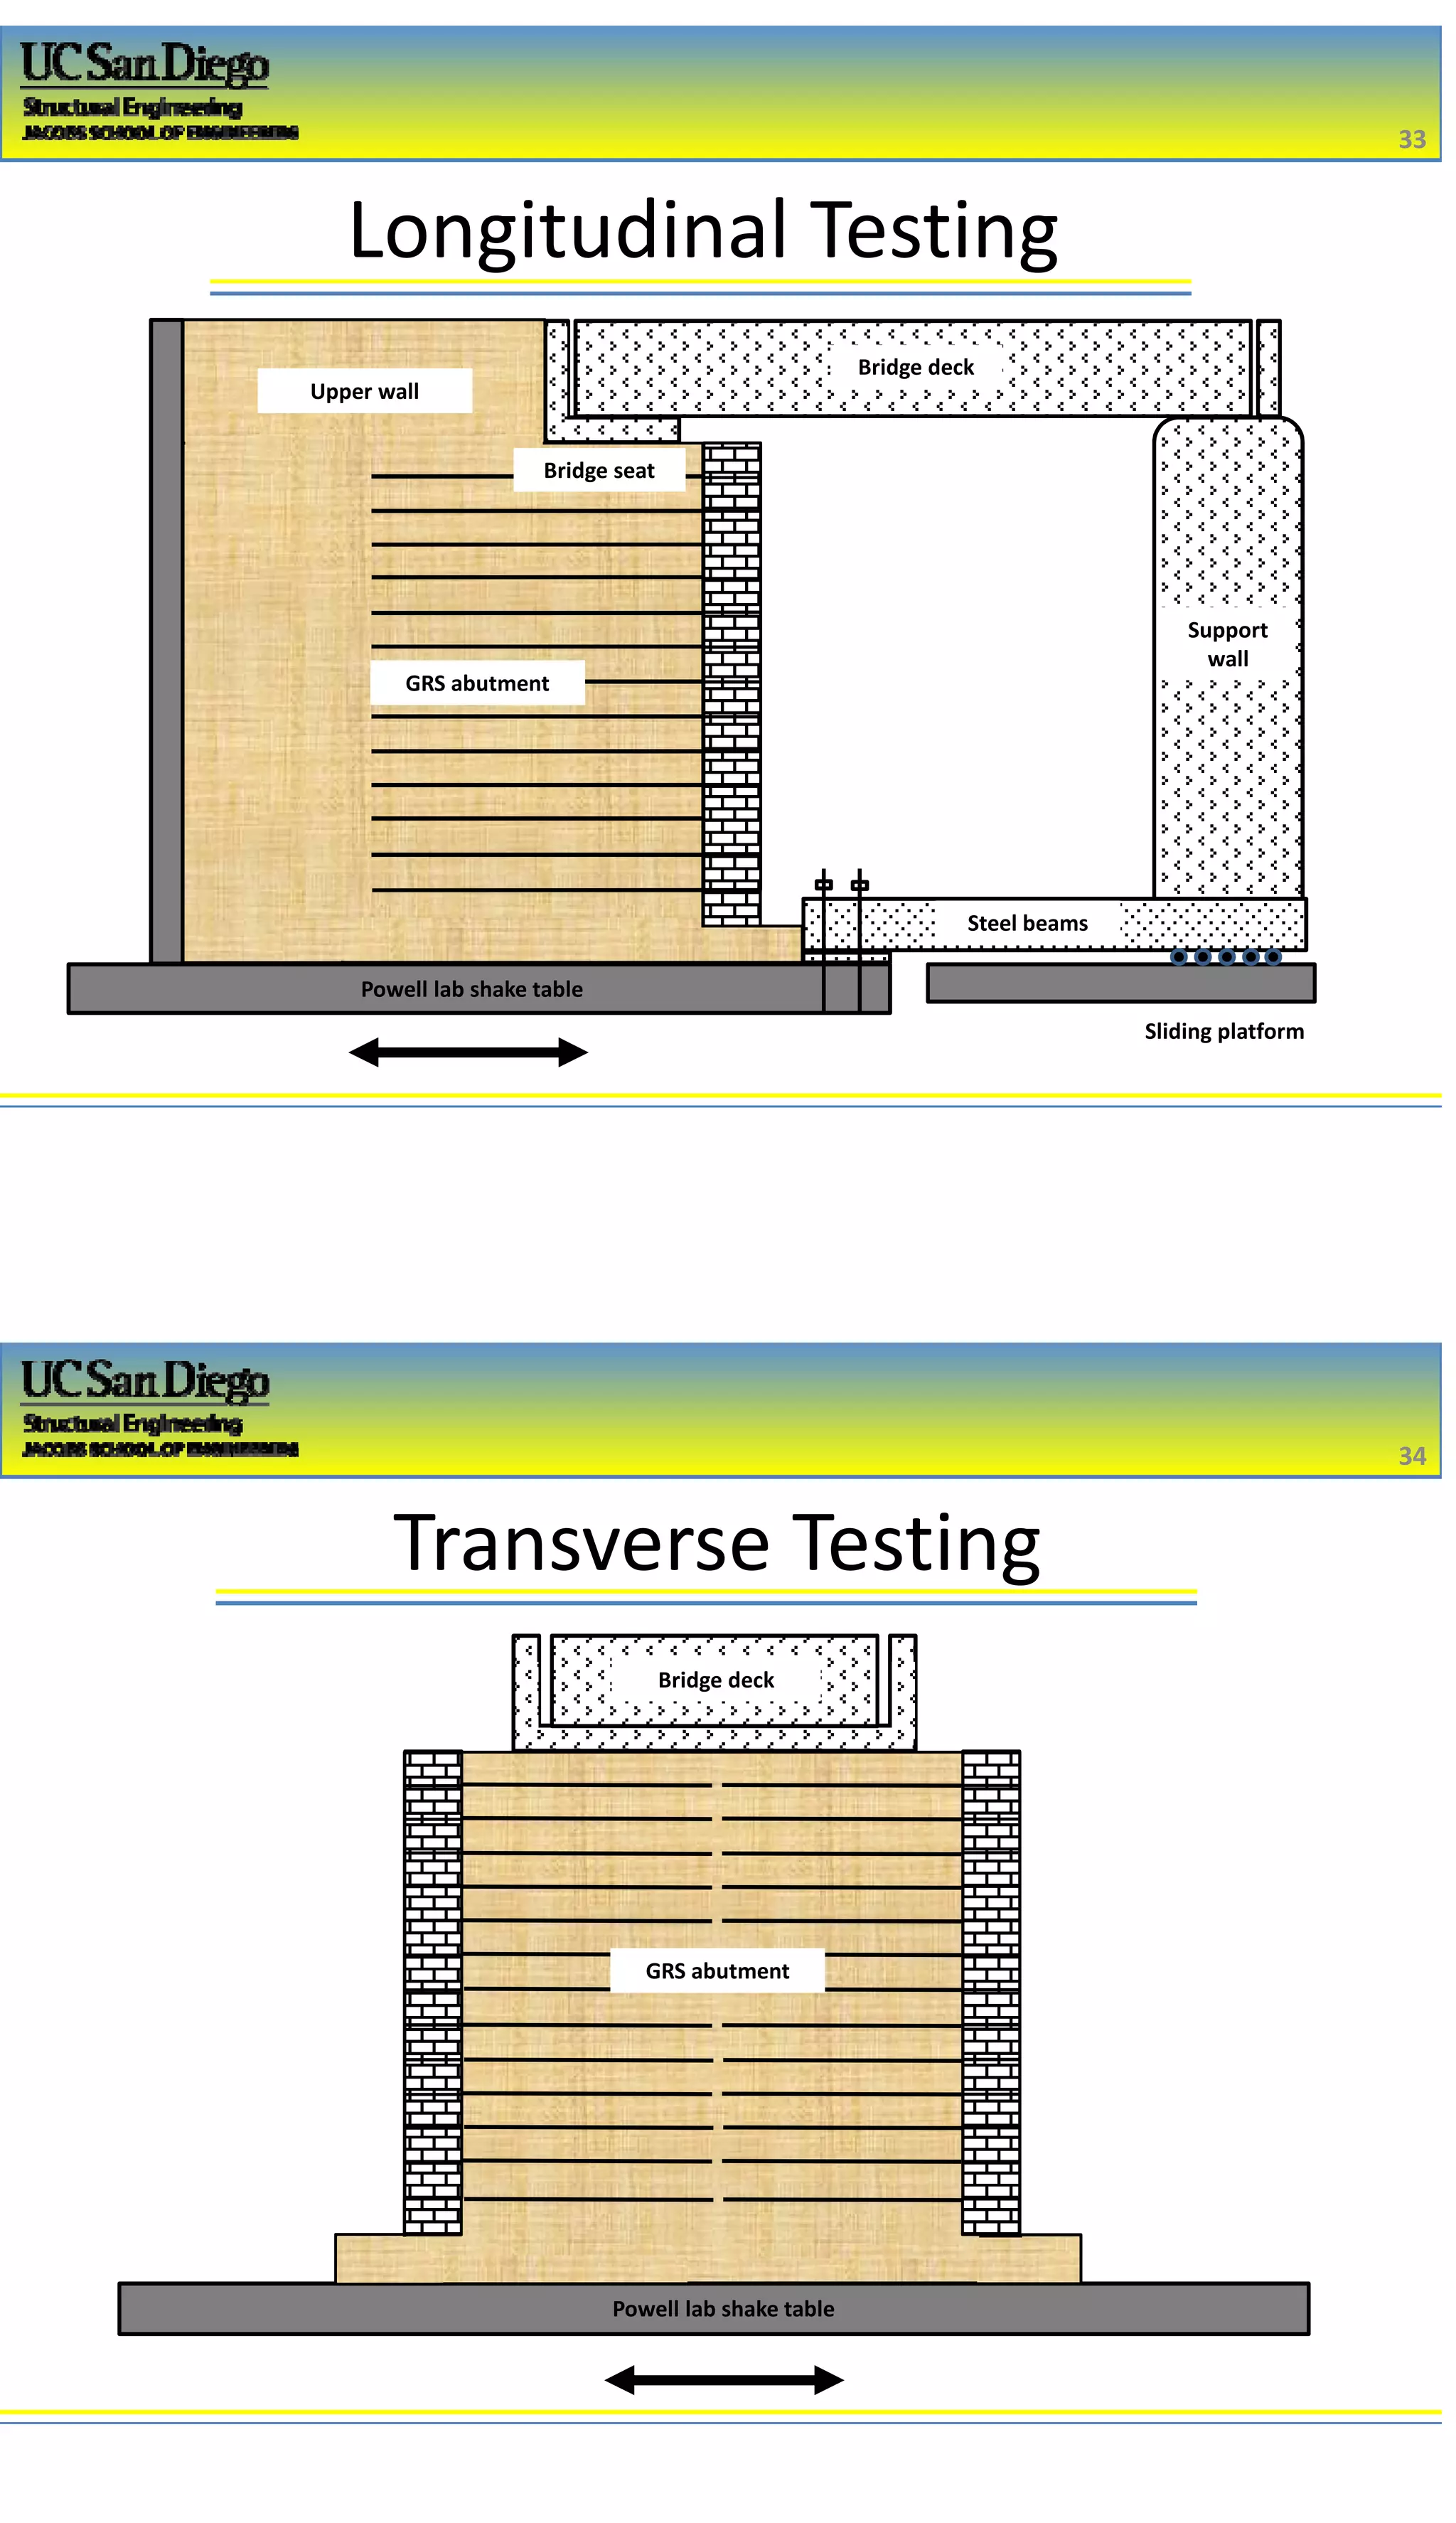
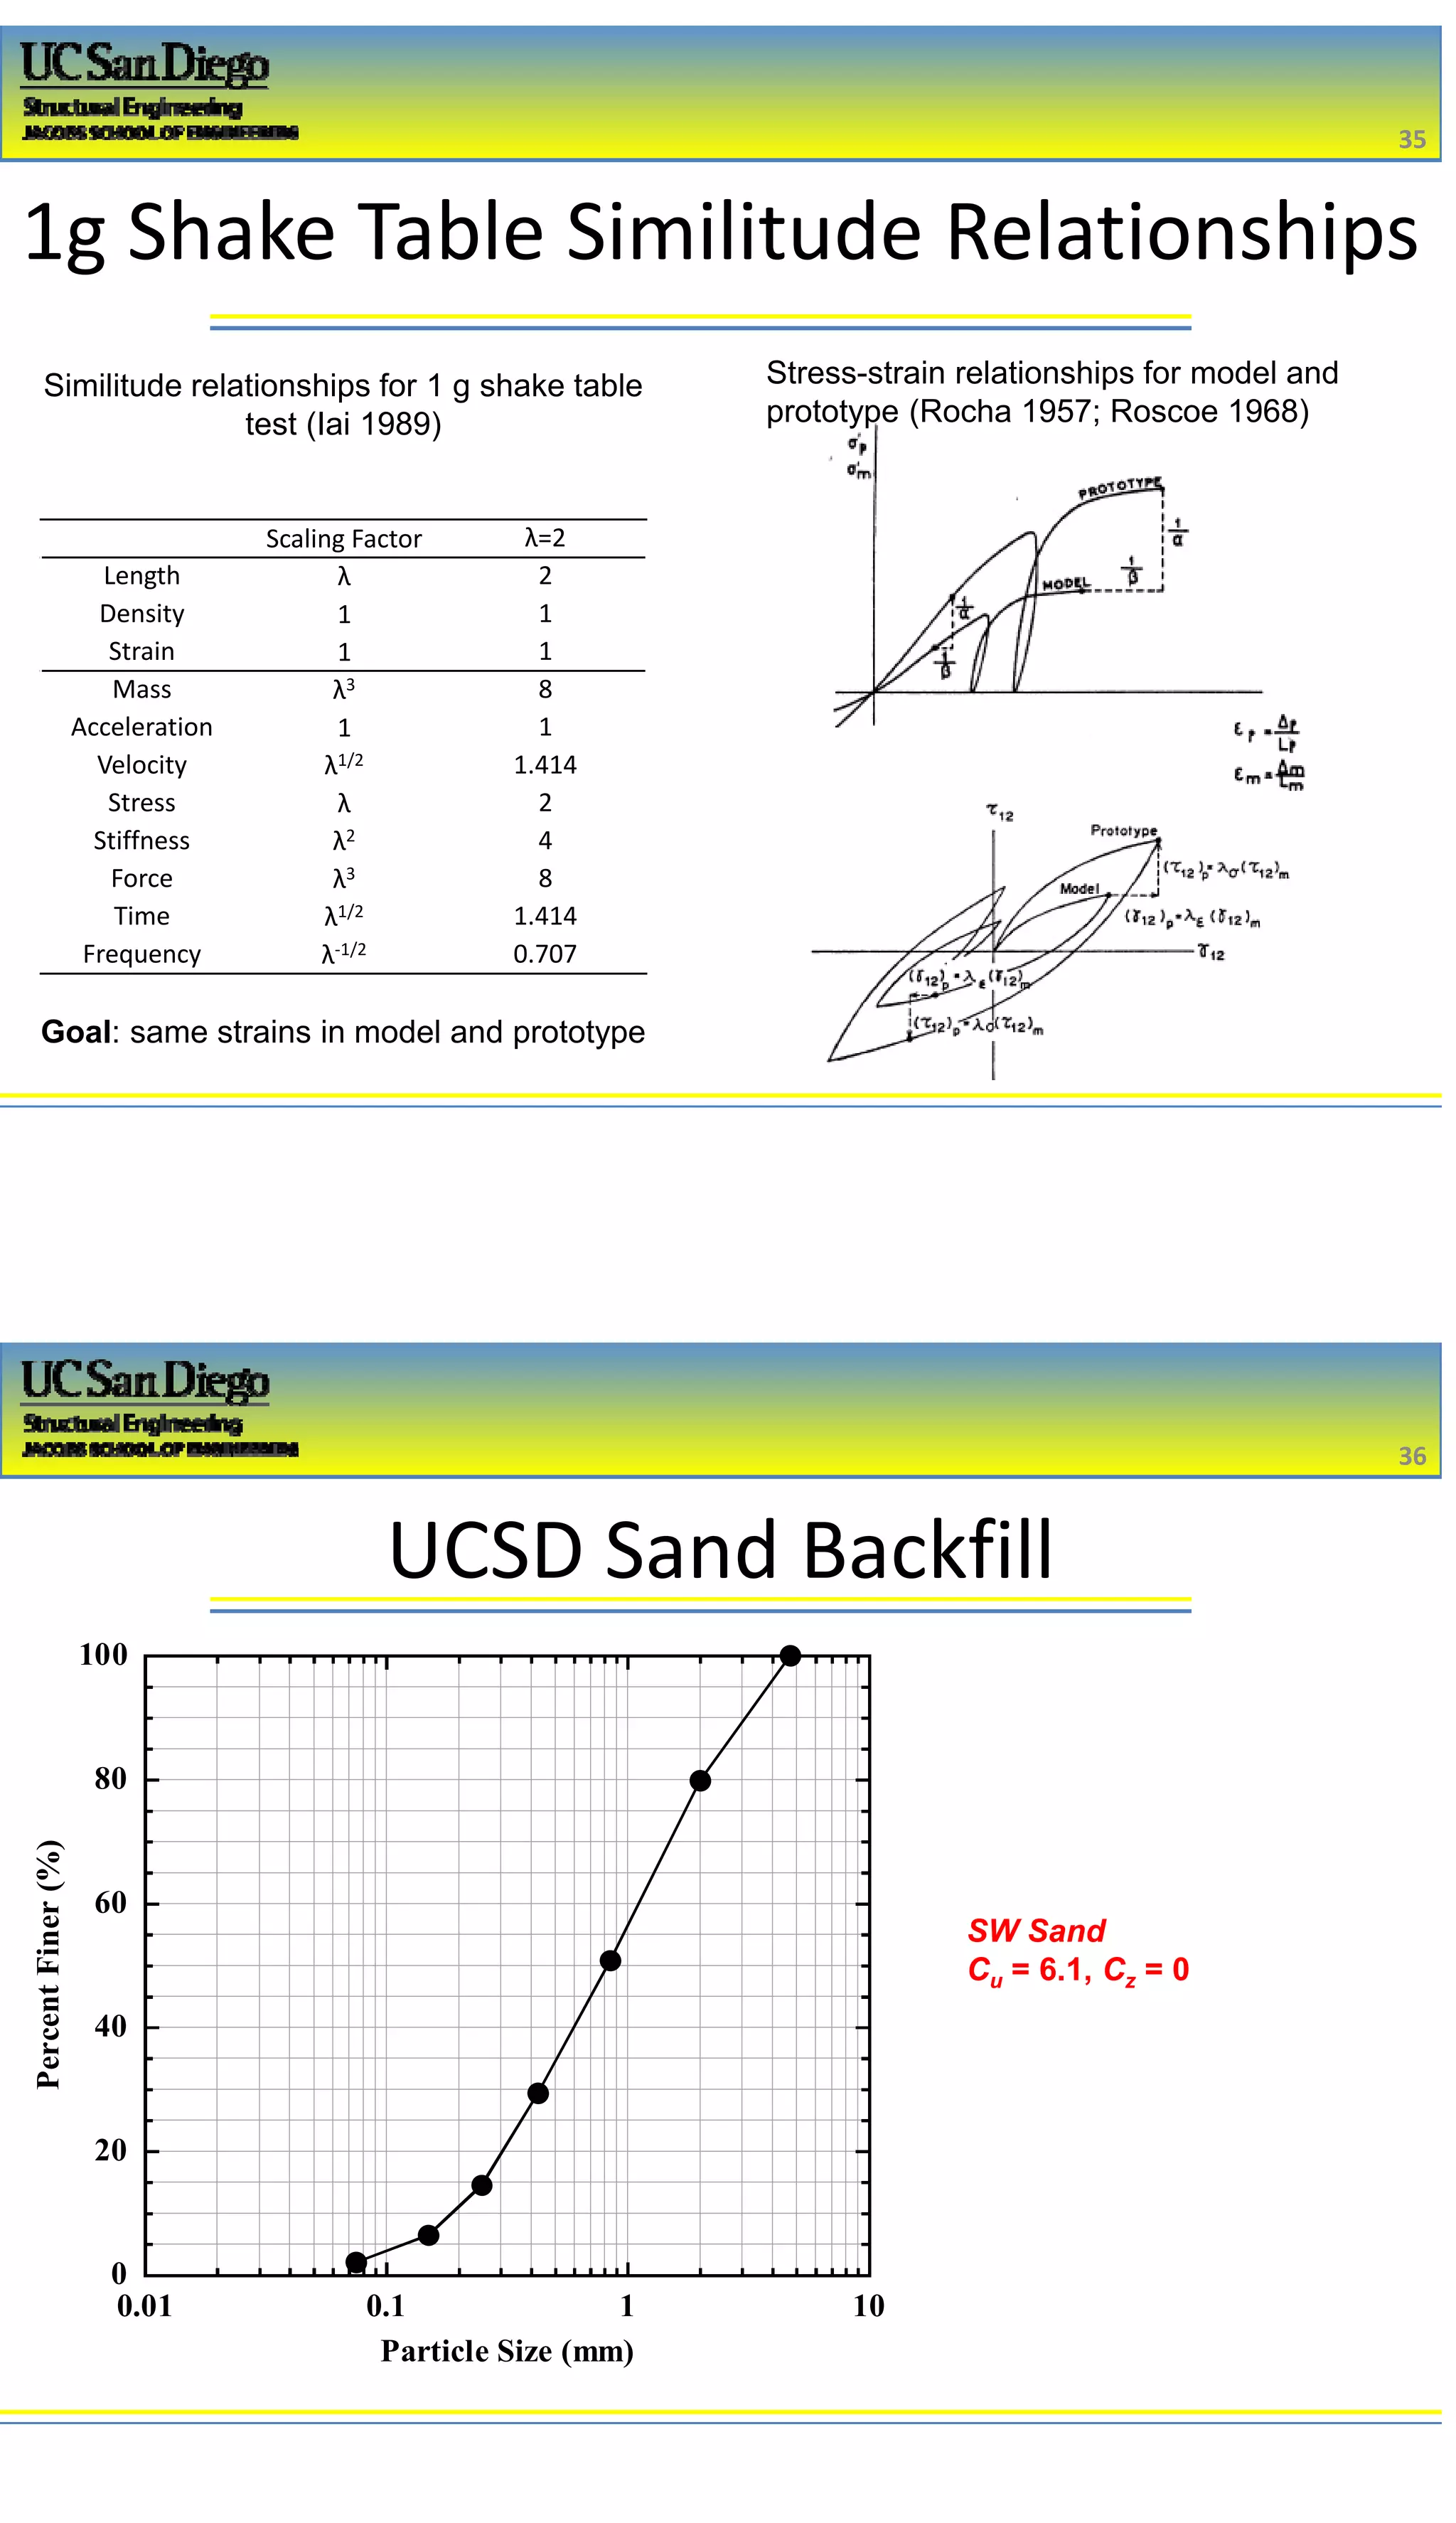
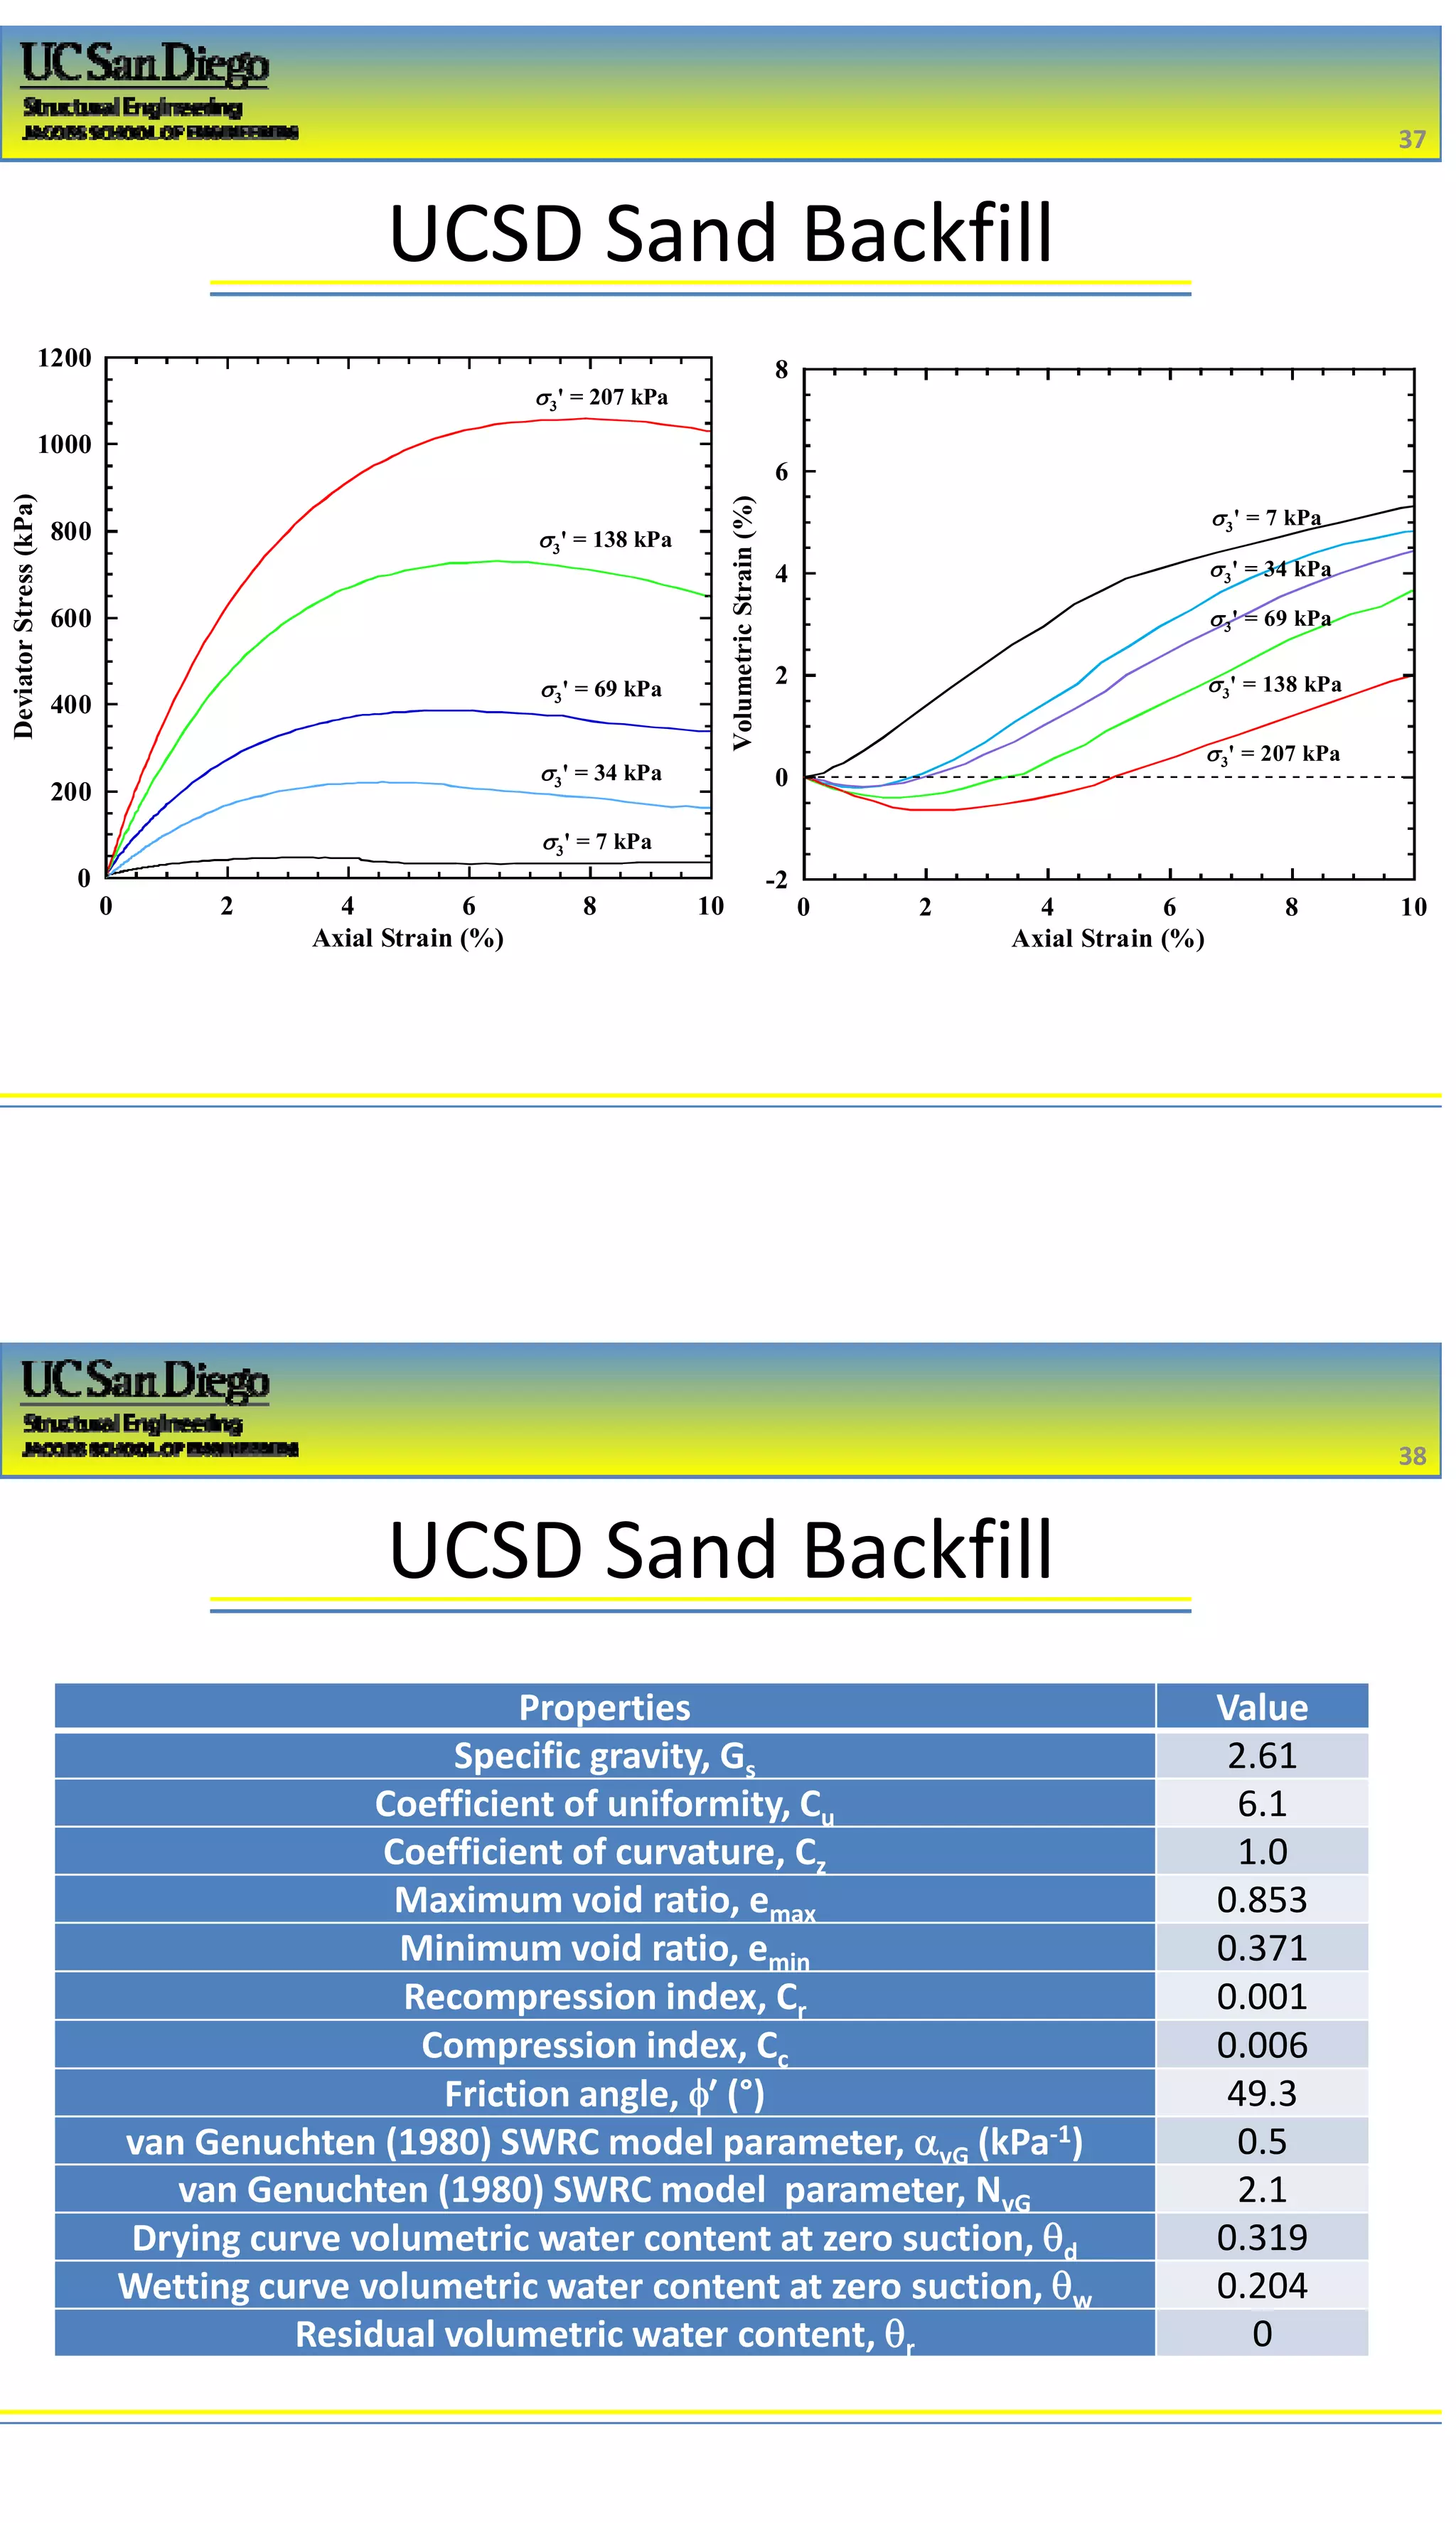
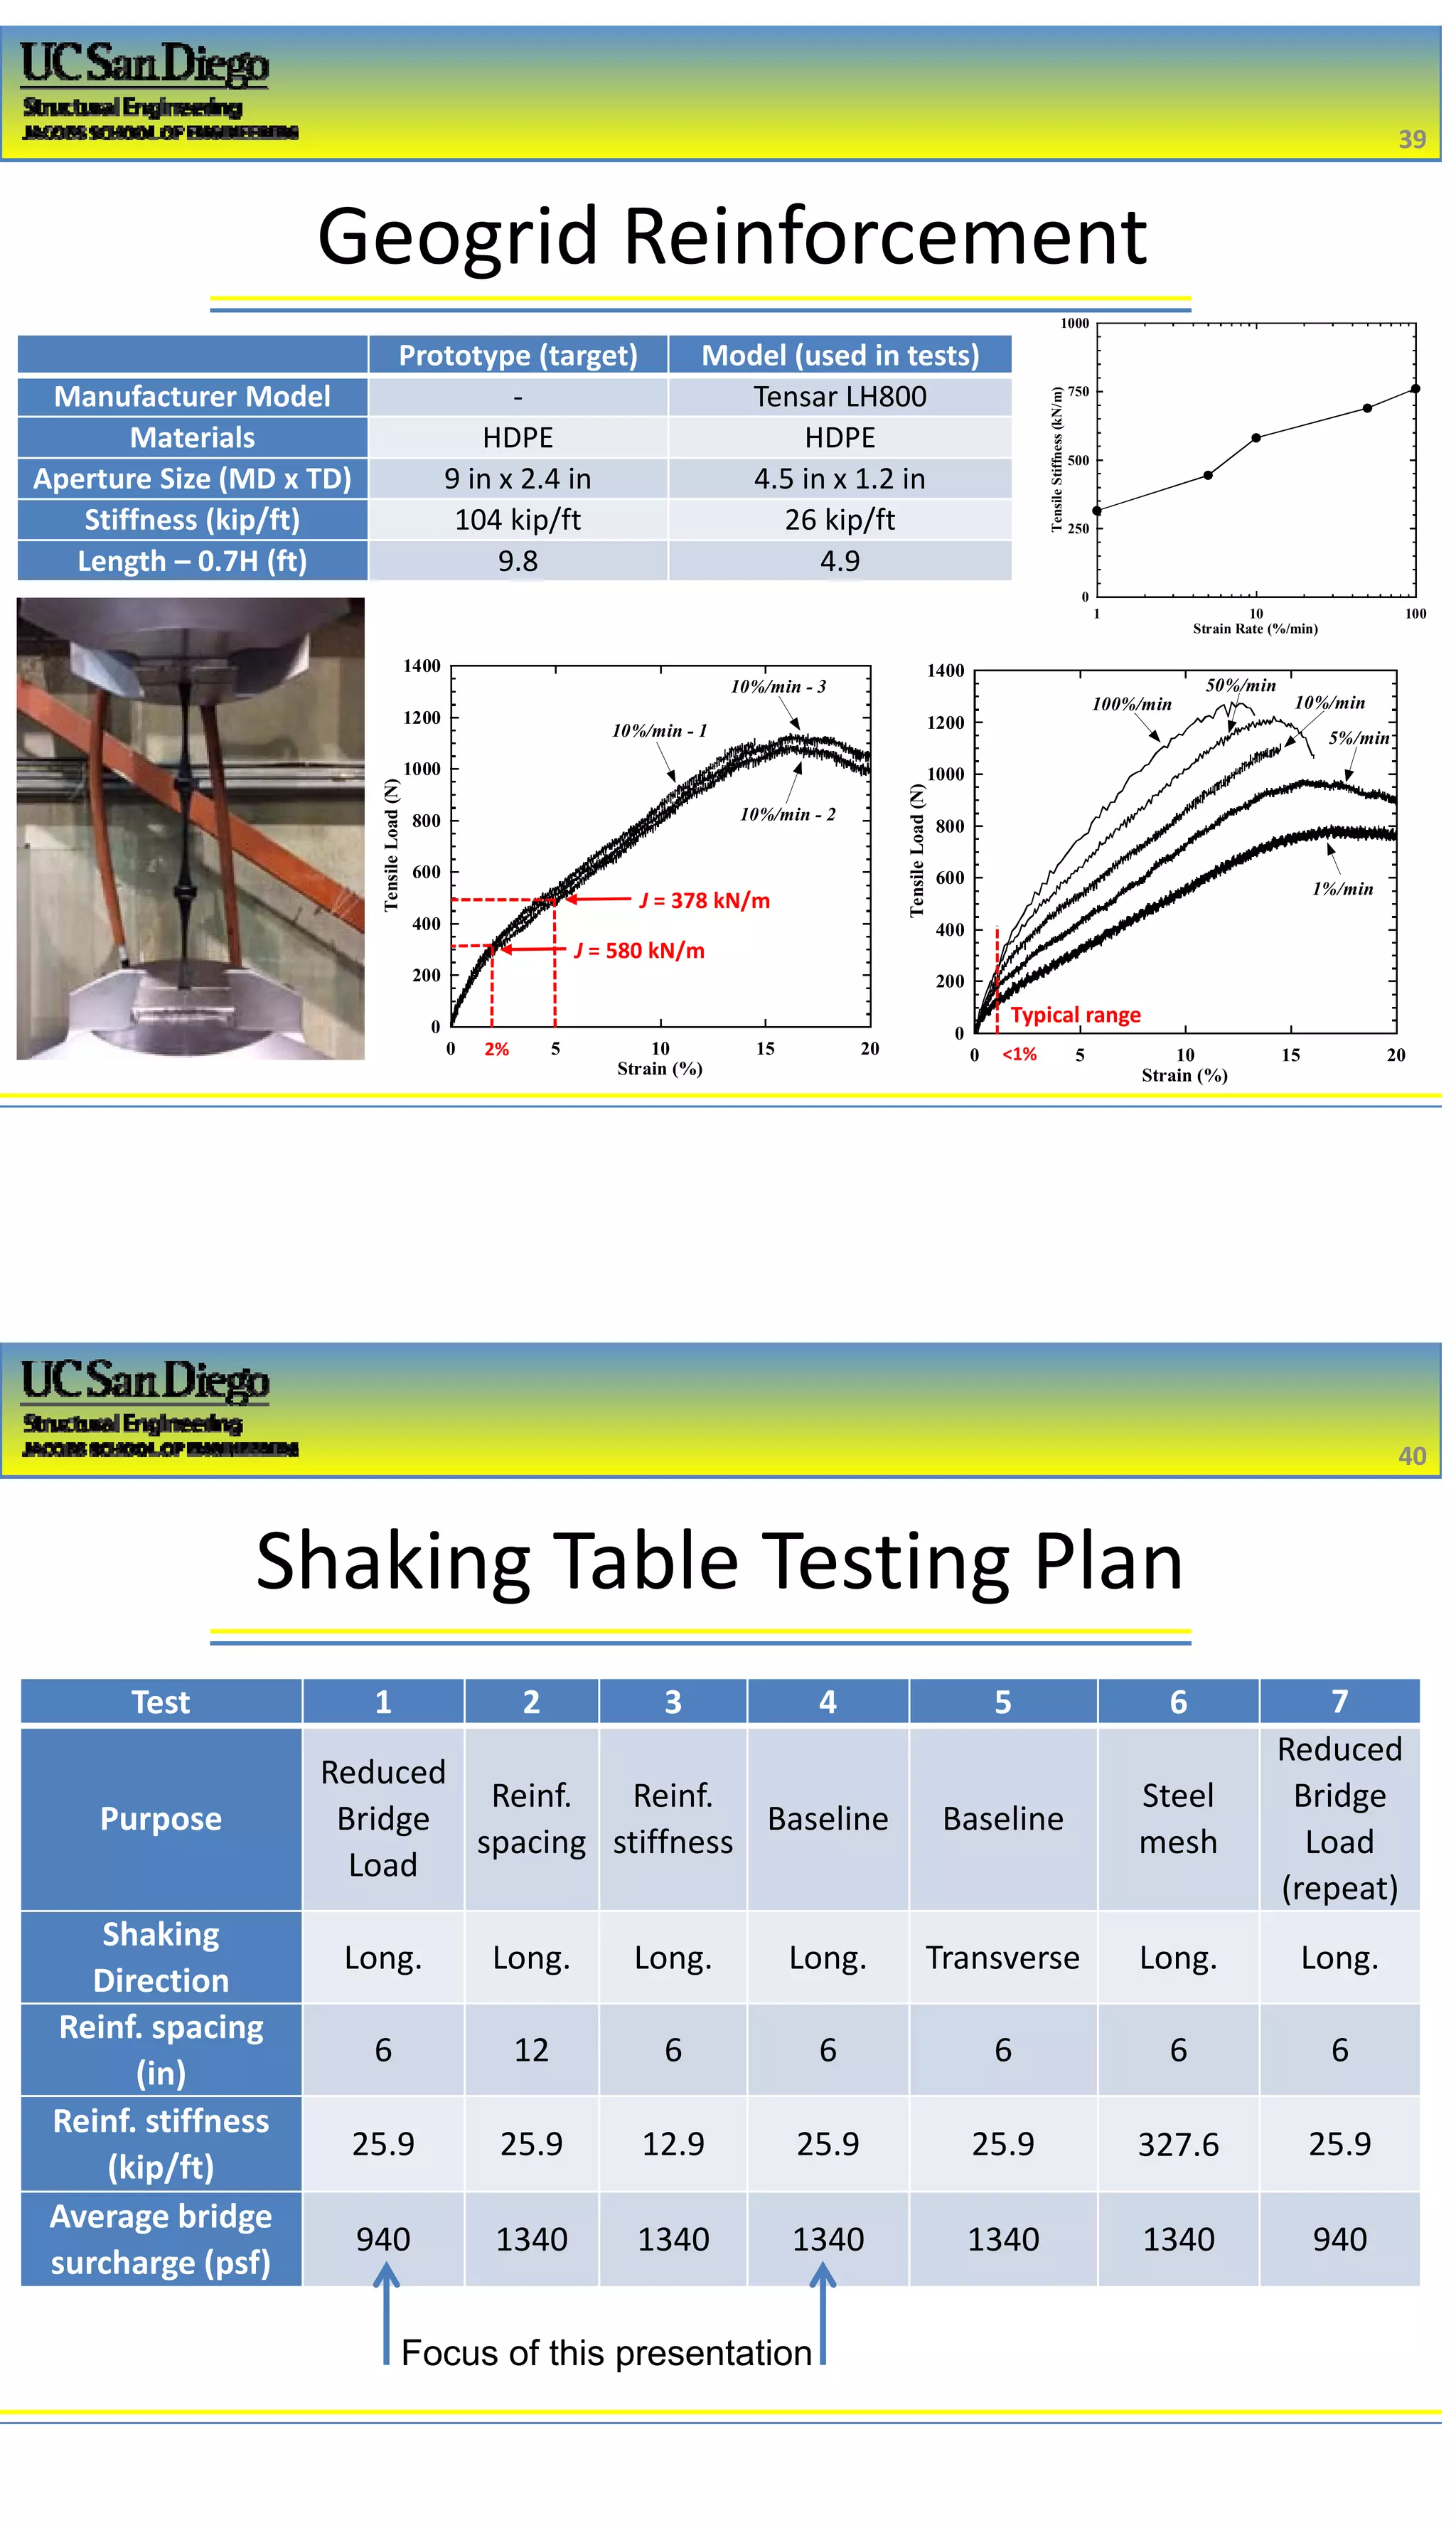
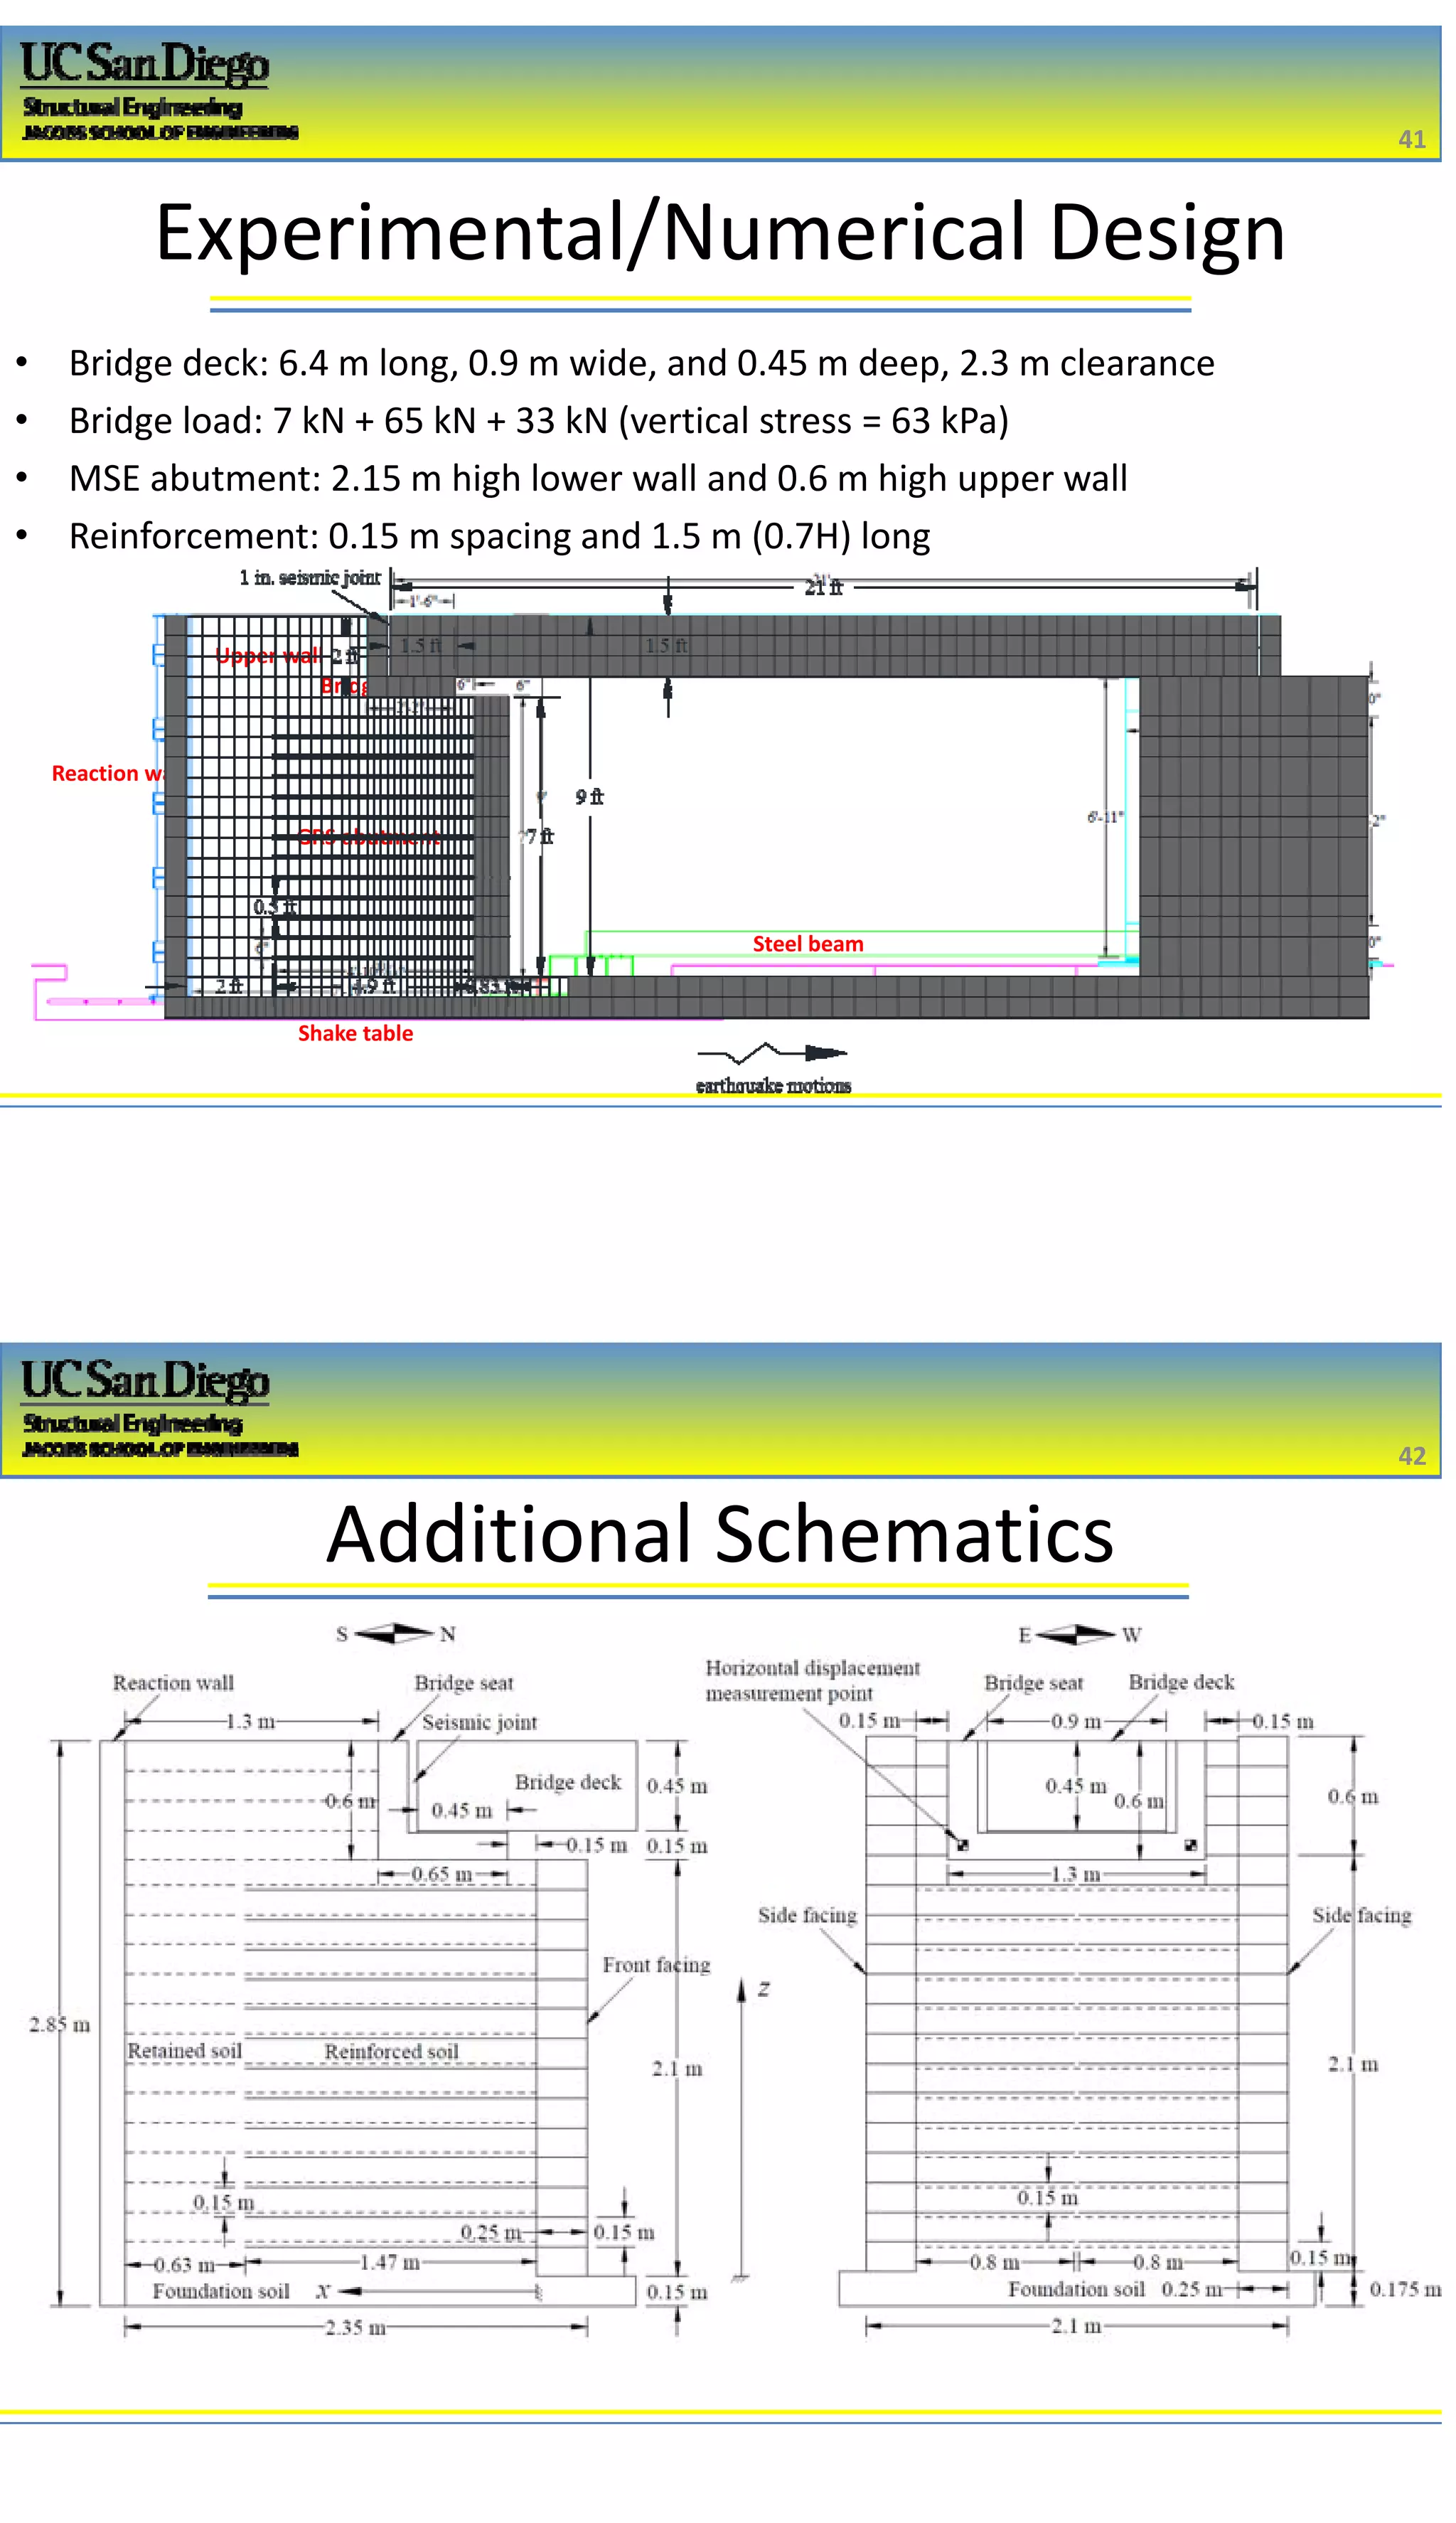
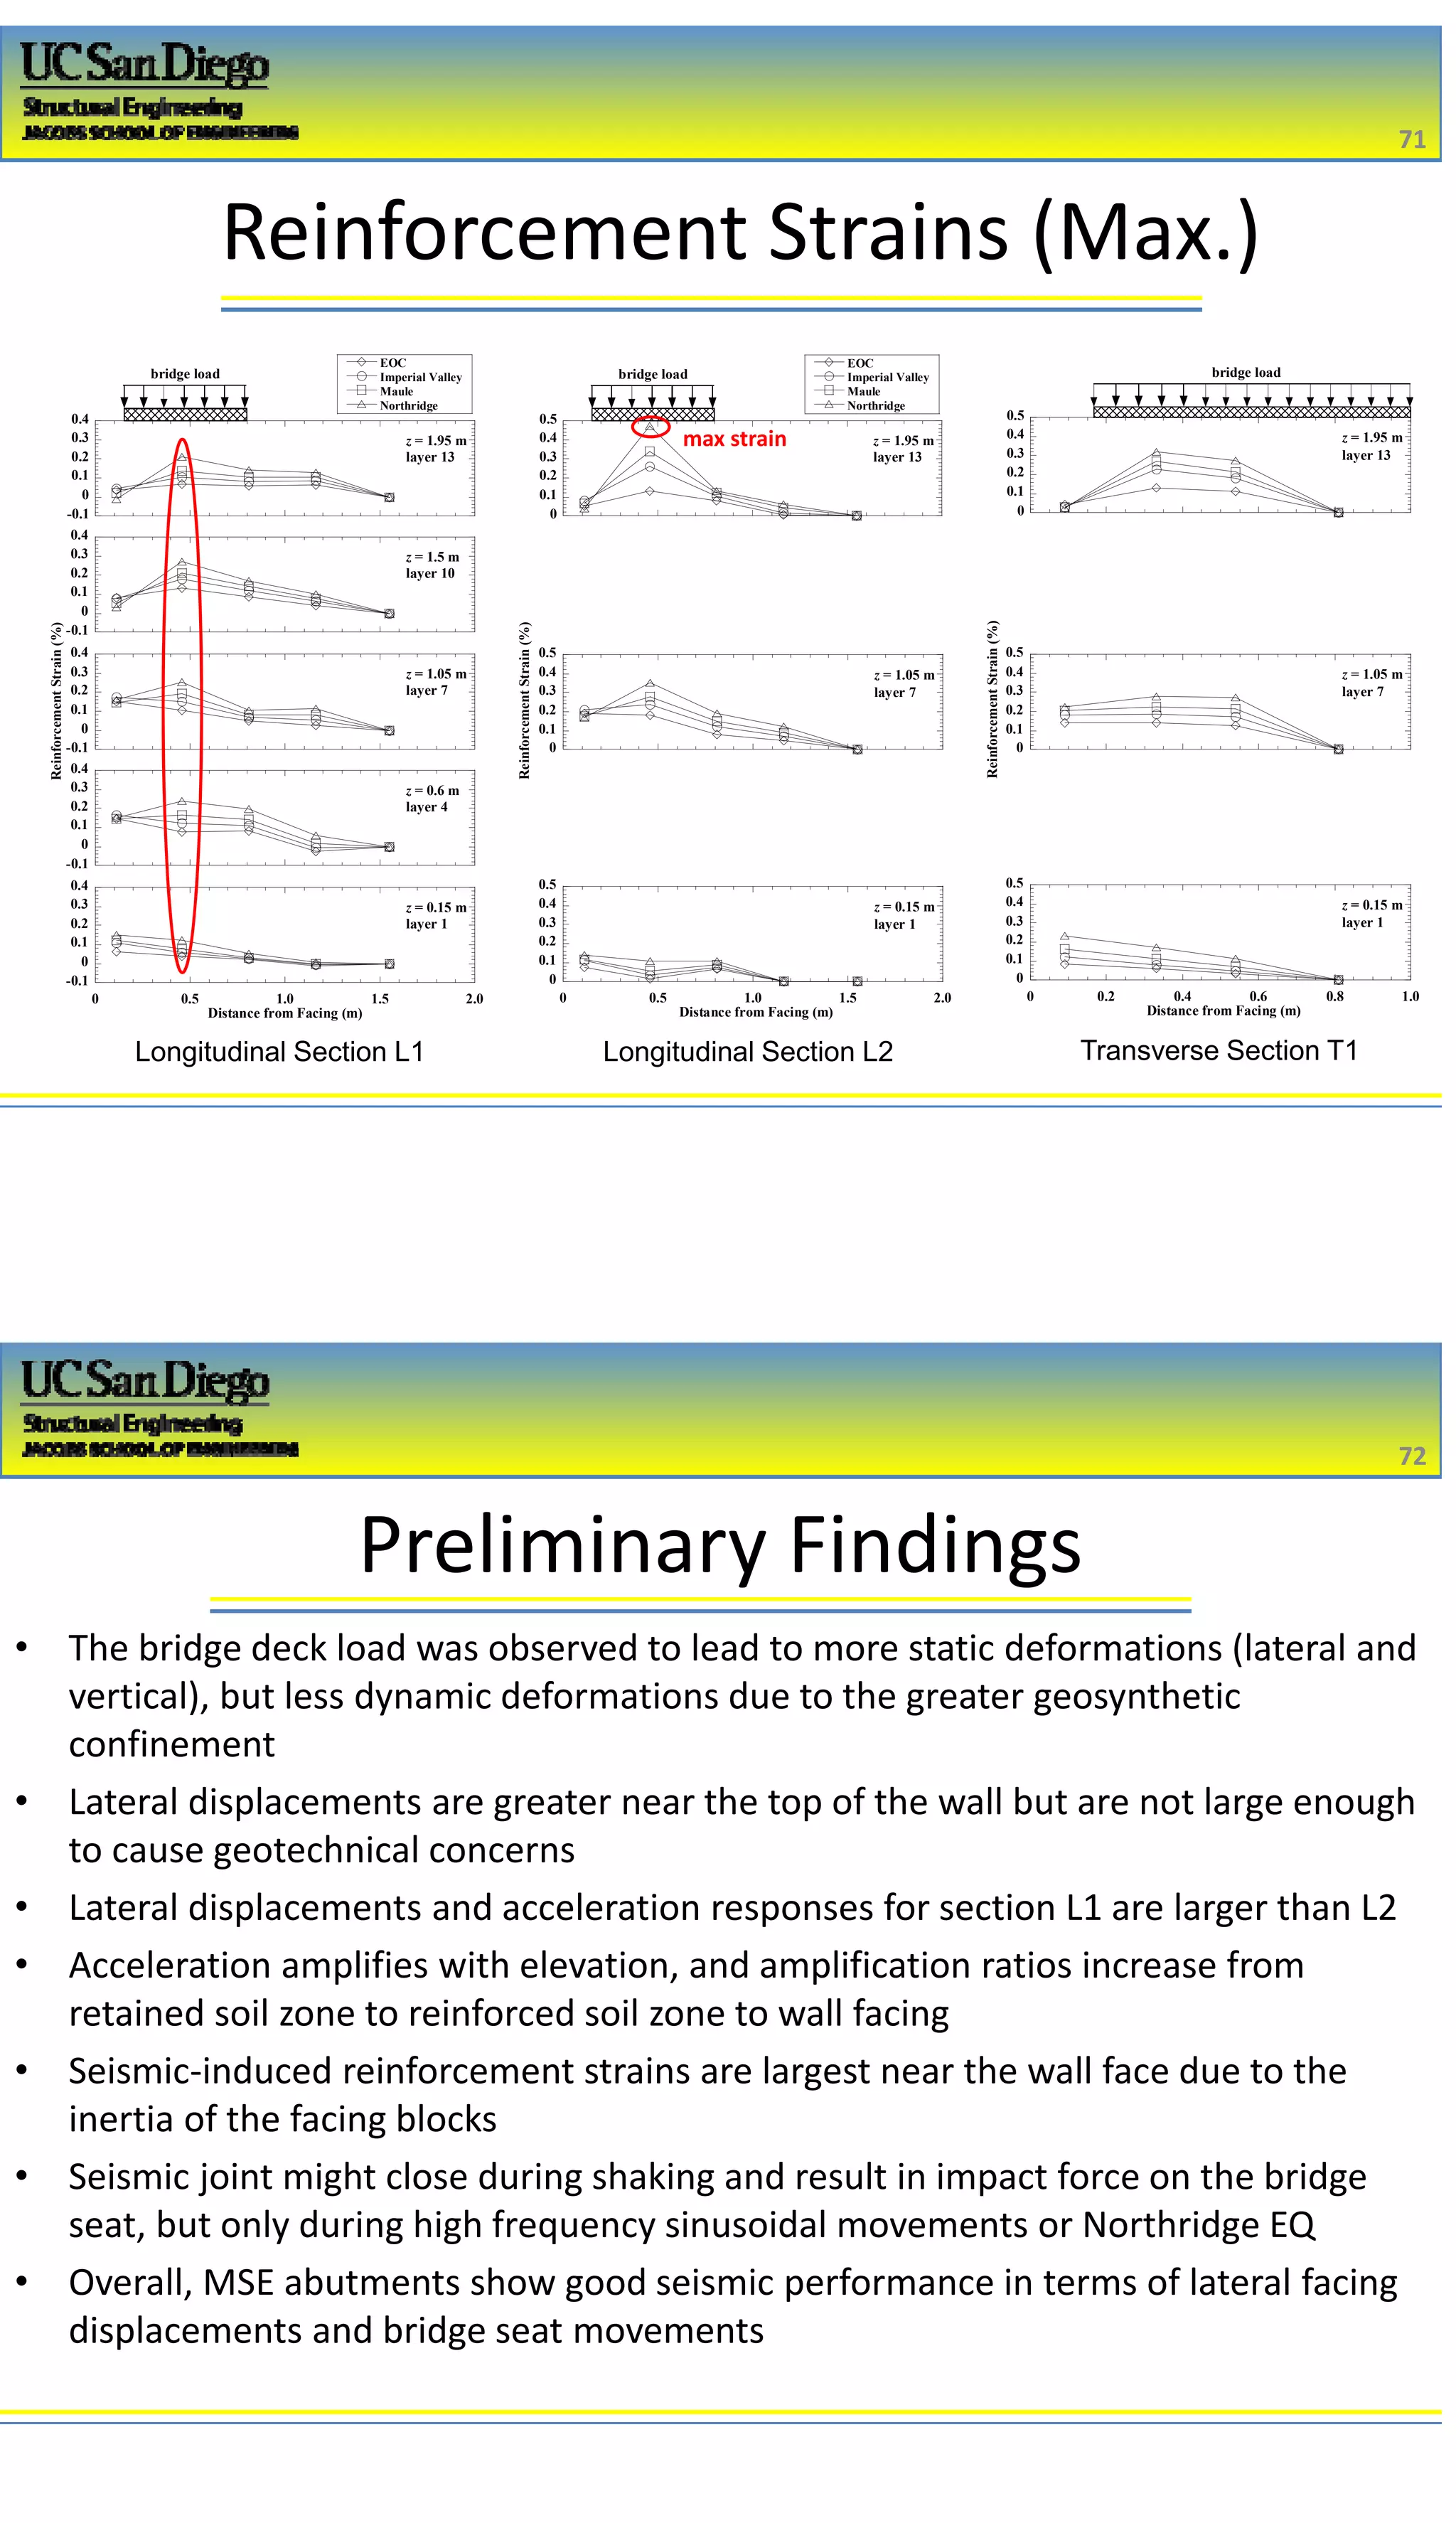
Presentation by Professor John S. McCartney, PhD, PE, an Associate Professor at UCSD, Department of Structural Engineering, for the Geo Institute of ASCE Orange County Section.
2. 2/16/2017
2
3
Personal Research Introduction
University of Colorado Boulder
BS/MS 2002
Faculty 2008-2014
University of Arkansas
Faculty 2007-2008
University of California San Diego
Faculty 2014-present University of Texas at Austin
PhD 2007
Personal Research Focus
Material Characterization
1. Unsaturated soil mechanics
• Effective stress evaluation
• Yielding mechanisms under changes in temperature and suction
• Compression behavior of soils to high stresses
• Thermal volume change mechanisms
• Measurement of hydro/thermal properties (SWRC, HCF, TCF, VHCF)
2. Geosynthetics engineering
3. Shear strength of tire-derived aggregates
Foundation Engineering
1. Centrifuge and full-scale modeling
2. Thermally active geotechnical systems (energy piles, geothermal heat
storage systems, thermal soil improvement)
3. Offshore foundations
Earthquake Engineering and Soil-Structure Interaction
1. Seismic response of unsaturated soils
2. Seismic response of MSE bridge abutments
4
4
Personal Research Introduction
4. 2/16/2017
4
Length of 6.7 m (22 ft), width of 3 m
(9.6 ft) and height of 4.7 m (15.2 ft)
Facilities: Large Laminar Container
7
Facilities: Container for Retaining Wall Testing on
the Large Shaking Table
8
5. 2/16/2017
5
Facilities: Powell Laboratory Shake Table
9
UCSD South Powell Structural Lab
Shake Table:
• Dimension: 10 ft. x 16 ft.
• Shaking DOF: 1D in N‐S direction
• Maximum gravity load: 80 kips
• Dynamic stroke: ± 6 in.
• Dynamic capacity: 90 kips
• Large laminar container
Facilities: Large Soil Pit for Foundation Testing
9m-deep soil pit and
reaction wall for
foundation testing
Earth moving equipment:
Bobcat, compactor, backhoe, crane
10
6. 2/16/2017
6
Facilities: Full-Scale Soil-Borehole Thermal Energy
Storage System
11
0
5
10
15
20
25
30
35
Thermal energy (GJ)
Solar
Borehole Array
Actidyn Model C61-3
Capacity: 50 g-ton Nominal radius: 1.70m Max. acc.: 130g
UCSD Facilties: Geotechnical Centrifuge
12
7. 2/16/2017
7
Facilities: Update of the Geotechnical Centrifuge
New features:
• Data acquisition system and actuators
• Containers (laminar, 3 clay tanks)
• Shaking table
• Control room
13
UCSD Element‐Scale Geotechnical Laboratory
14
Stress path triaxial
testing setup
Standard soil
characterization
equipment
8. 2/16/2017
8
UCSD Element‐Scale Geotechnical Laboratory
15
Geosynthetic pullout box
Large-scale direct shear/simple
shear device for shear strength of
large particle materials (tire
derived aggregates)
MS in Geotechnical Engineering at UCSD
Goals:
• Provide advanced degree option for students seeking to specialize in geotechnical
engineering
• Meet demand of local employers and interest of current undergraduate students
• Build links to practice for students only interested in MS
• Provide a recruiting tool for top MS students to continue for a PhD in
geotechnical engineering
• Facilitate completion of MS coursework in 4 quarters plus a summer
• Leverage and build upon existing courses in the department
• Build upon existing strengths: earthquake engineering, soil-structure interaction,
computational geotechnics, and large-scale evaluation of geotechnical systems
Program:
• The M.S. degree program includes required core courses and technical electives
• M.S. students must complete 48 units of graduate credits for graduation (12 courses)
• Suggested focus sequences:
• Geotechnical engineering and geomechanics
• Geotechnical earthquake engineering
• Soil-structure interaction
16
9. 2/16/2017
9
MS in Geotechnical Engineering at UCSD
Core Courses (Students must take all four):
• SE 271 Solid Mechanics for Structural & Aerospace Engineering
• SE 241 Advanced Soil Mechanics
• SE 242 Advanced Foundation Engineering
• SE 250 Stability of Earth Slopes & Retaining Walls
Geotechnical electives (students must select at least four):
• SE 222 Geotechnical Earthquake Engineering
• SE 226 Groundwater Engineering
• SE 243 Soil-Structure Interaction
• SE 244 Numerical Methods in Geomechanics
• SE 247 Ground Improvement
• SE 248 Engineering Properties of Soils
• SE 207 Rock Mechanics
• SE 207 Soil Dynamics
• SE 207 Unsaturated Soil Mechanics
Other technical electives (choose up to 4):
• Students may select from a list of structural, computational mechanics, or geology
courses for the remaining 4 technical electives
17
Geotechnical Engineering
Graduate Student Organizations
CalGeo Student Chapter (Initiated 2015)
• Brings in local geotechnical engineers for seminars
GeoInstitute Graduate Student Organization (Initiated 2016)
• Facilitates engagement of graduate students in international geotechnical conferences
18
10. 2/16/2017
10
Technical Presentation: Seismic
Response of MSE Bridge Abutments
Roadways
Slopes
Embankments
Retaining walls
Bridge abutments
• General trend is toward the use of GRS‐IBS abutments (close spacing, variable
lengths, specific design details from FHWA), but current study is on MSE bridge
abutments (length = 0.7H, load applied to bridge seat on reinforced soil mass)
• GRS and MSE have many advantages over pile‐supported bridge abutments,
including cost savings, easier and faster construction, and smoother transition
19
19
Geosynthetics in
transportation applications:
Acknowledgements
20
20
• Project sponsors:
– Caltrans
– Pooled fund members
(WashDOT, UDOT, MDOT)
• Collaborators
– Yewei Zheng, Ph.D. Candidate
– Prof. Benson Shing, Chair of
SE at UCSD
– Prof. Patrick Fox, Head of CEE
at Penn State University
11. 2/16/2017
11
Research Motivation
GRS bridge abutments have been widely used in US, but has not been adopted
in California due to uncertainty about seismic performance:
• Geotechnical: backfill settlement and facing displacement
• Structural: bridge deck and seat movements, impact force between bridge
deck and seat, and interaction between bridge superstructure and GRS
abutment, overall philosophy of GRS vs. MSE (concerns with bridge deck
being placed directly onto the reinforced soil mass)
21
21
MSE wall
performance
in Maule
Earthquake,
Chile
Research Motivation
GRS bridge abutments have been widely used in US, but has not been adopted
in California due to uncertainty about seismic performance:
• Geotechnical: backfill settlement and facing displacement
• Structural: bridge deck and seat movements, impact force between bridge
deck and seat, and interaction between bridge superstructure and GRS
abutment, overall philosophy of GRS vs. MSE (concerns with bridge deck
being placed directly onto the reinforced soil mass)
22
22
MSE bridge
abutment
performance
in Maule
Earthquake,
Chile
12. 2/16/2017
12
Literature Review – Static Performance
• Lee and Wu (2004) reviewed several case studies of in‐
service GRS abutments and reported satisfactory
performance under service load conditions
• Adams et al. (2011) reported excellent performance for five
in‐service GRS‐IBS abutments
• Field and laboratory static loading tests indicate that the
GRS piers and abutments had satisfactory performance
under design loads and relatively high load‐bearing
capacity (Adams 1997; Gotteland et al. 1997; Ketchart and
Wu 1997; Wu et al. 2001, 2006; Adams et al. 2011; Nicks et
al. 2013)
23
23
Literature Review – Seismic Performance
• El‐Emam and Bathurst (2004, 2005, 2007) performed a series of
shake table tests on reduced‐scale GRS walls with a full‐height
rigid facing panel
• Ling et al. (2005, 2012) conducted full‐scale shake table tests on
GRS walls with modular block facing using fine sand and silty sand
as backfill soils
• Yen et al. (2011) found that GRS abutments performed well from
post‐earthquake reconnaissance for 2010 Maule Earthquake
• Helwany et al. (2012) conducted large‐scale shake table tests on a
GRS abutment and found that it can sustain sin motion up to 1g
without significant distresses
24
24
13. 2/16/2017
13
Literature Review – Seismic Performance
References
Height
(m)
Facing Backfill Reinforcement
Input
motion
Findings
El‐Emam and
Bathurst
(2004, 2005,
2007)
1.0
rigid
panel
sand
polyester
geogrid
sinusoidal
facing lateral displacement could be
reduced by using smaller facing
panel mass, inclined facing panels,
longer reinforcement, stiffer
reinforcement, and smaller vertical
reinforcement spacing
Ling et al.
(2005, 2012)
2.8
modular
block
sand/silty
sand
polyester
geogrid
earthquake
longer reinforcement at top layer
and smaller reinforcement vertical
spacing improved seismic
performance; vertical acceleration
has little influence; apparent
cohesion improved seismic
performance
Helwany et al.
(2012)
3.6
modular
block
sand
woven
geotextile
sinusoidal
GRS abutment remained functional
under sinusoidal motions up to 1.0 g
25
25
Project Objectives
• Investigate performance of MSE abutments for service limit
state, strength limit state, and extreme event limit state (seismic
loading)
• Approaches:
• Numerical simulations using FLAC2D and FLAC3D
• ½ scale experimental physical modeling
• Improve design guidelines for external and internal stability of
MSE bridge abutments for static and seismic loading
0 ~ 200 kPa 200 ~ > 1000 kPa extreme loadings
service limit strength limit extreme event limit
26
26
25. 2/16/2017
25
Estimates of Apparent Cohesion in Backfill
49
49
0
0.5
1.0
1.5
2.0
2.5
0 2 4 6 8 10
Elevation,z(m)
Gravimetric Water Content (%)
S = wGs/e
0.0
0.2
0.4
0.6
0.8
1.0
1.2
0.1 1.0 10.0 100.0 1000.0
Degree of saturation, S
Suction, ψ (kPa)
Drying
Wetting
e = 0.50
n = 0.33
p = 0
relative density = 60%
α = 0.85
N = 1.80
α = 0.65
N = 1.80
res
res
e
S
SS
S
1
vG
vG NN
vGeS
1
1
1
Apparent Cohesion
50
50
0
0.5
1.0
1.5
2.0
2.5
0 2 4 6 8 10 12 14
Drying
Wetting
Elevation,z(m)
Apparent Cohesion (kPa)
f = ’tan’ = (Se)tan’
’ = (-ua)+s
’ = (-ua)+
’ = (-ua)+Se
’ = (Se)
SWRC is needed for to estimate
the apparent cohesion, but
otherwise the material properties
for saturated/dry soil can be used
Apparent cohesion changes with
wetting/drying:
Effective stress:
26. 2/16/2017
26
Concept of Applied Shaking Motions
51
51
-0.4
-0.3
-0.2
-0.1
0
0.1
0.2
0.3
0.4
0 5 10 15 20 25 30 35 40
Original
Scaled
Acceleration(g)
Time (s)
-150
-100
-50
0
50
100
150
0 5 10 15 20 25 30 35 40
Original
Scaled
Displacement(mm)
Time (s)
• Frequency of motion is
reduced by √2, which
shortens the duration
• Acceleration amplitude
stays the same
• Displacement
amplitude is scaled by
half
Typical Response Spectrum of Applied Motion
52
52
0
0.2
0.4
0.6
0.8
1.0
1.2
0.1 1 10
Target input
Shaking table
PsuedoSpectralAcceleration(g)
Frequency (Hz)
1940 Imperial Valley Motion (El
Centro Station): 5% damping
27. 2/16/2017
27
Applied Shaking Motions
Shaking
Number
Motion
Maximum
Acceleration (g)
Maximum
Displacement
(mm)
Control Mode
1 White Noise 0.1 26.1 Acceleration
2 1940 Imperial Valley 0.31 66 Displacement
3 White Noise 0.1 26.1 Acceleration
4 2010 Maule 0.40 109 Displacement
5 White Noise 0.1 26.1 Acceleration
6 1994 Northridge 0.58 88.7 Displacement
7 White Noise 0.1 26.1 Acceleration
8 Sin @ 0.5 Hz 0.05 50 Displacement
9 Sin @ 1 Hz 0.1 25 Displacement
10 Sin @ 2 Hz 0.2 12.5 Displacement
11 Sin @ 5 Hz 0.25 2.5 Displacement
12 White Noise 0.1 26.1 Acceleration
53
53
Applied Shaking Motions
• White noise – characterize frequencies
• Earthquake motions (frequencies scaled)
1. 1940 Imperial Valley (El Centro) – PGA = 0.31 g/ PGD = 66 mm
2. 2010 Maule (Concepcion) – PGA = 0.40 g/ PGD = 109 mm
3. 1994 Northridge (Newhall) – PGA = 0.58 g/ PGD = 89 mm
• Sinusoidal motions (0.5, 1, 2, and 5 Hz)
-0.4
-0.3
-0.2
-0.1
0
0.1
0.2
0.3
0.4
0 4 8 12 16 20 24 28
Acceleration(g)
Time (s)
-100
-50
0
50
100
0 4 8 12 16 20 24 28
Displacement(mm)
Time (s)
-60
-40
-20
0
20
40
60
0 5 10 15 20 25 30 35 40
Displacement(mm)
Time (s)
-3
-2
-1
0
1
2
3
0 5 10 15 20 25 30 35 40
Displacement(mm)
Time (s)
0.5 Hz 5 Hz
Imperial Valley ‐ AccelerationImperial Valley ‐ Displacement
54
54
28. 2/16/2017
28
Bridge Seat Settlements
Test 4, Maule Earthquake
SE SW
NE
NW
Bridge Seat Instrumentation
55
55
Confinement of the soil at
the back of the wall (south)
leads to less variable
strains during shaking
-2
0
2
4
6
8
10
0 20 40 60 80 100
NW
NE
SW
SE
Settlement(mm)
Time (s)
-2
0
2
4
6
8
10
0 20 40 60 80 100
Settlement(mm)
Time (s)
Bridge Seat Settlements
Test
Vertical
Stress
(kPa)
Residual Bridge Seat Settlements (mm)
Bridge Deck
Placement
Imperial
Valley
Motion
Maule
Motion
Northridge
Motion
Test 1
(reduced
load)
44 1.4 2.7 2.5 ‐
Test 4
(baseline)
63 2.1 1.5 1.5 2.1
Note: Values are incremental for each testing stage, and are
the average of the settlements of the four corners
56
56
29. 2/16/2017
29
Lateral Facing Displacements
• Lateral face displacements generally increase with elevation
• Residual displacements are incremental for each shaking event
• Maximum dynamic lateral facing displacements are greater than residual values
57
57
0
0.5
1.0
1.5
2.0
0 1 2 3 4 5 6
EOC - Abutment
Imperial Valley - Residual
Imperial Valley - Max
Maule - Residual
Maule - Max
Elevation,z(m)
Lateral Facing Displacement (mm)
Lateral Facing Displacements
• Displacements for L1 are larger than L2 despite greater confinement in L1
• Displacements are larger for the Northridge Earthquake, which has larger PGA
• Displacements for T1 are larger than L1 and L2
0
0.5
1.0
1.5
2.0
0 0.5 1.0 1.5 2.0
L1
L2
T1
Elevation(m)
Lateral Facing Displacement (mm)
0
0.5
1.0
1.5
2.0
0 1 2 3 4 5
L1
L2
T1
Elevation(m)
Lateral Facing Displacement (mm)
Test 4 - Imperial Valley Motion Test 4 - Northridge Motion
58
58
31. 2/16/2017
31
Acceleration Amplification
• Acceleration amplification increases with elevation
• Amplification ratios increase from retained soil zone to reinforced soil zone to wall facing
• Amplification ratios are larger for L1 than L2
Imperial Valley Earthquake
0
0.5
1.0
1.5
2.0
0.8 1.0 1.2 1.4 1.6 1.8
L1 - Wall Facing
L1 - Reinforced Soil Zone
L1 - Retained Soil Zone
L2 - Reinforced Soil Zone
L2 - Retained Soil Zone
Elevation(m)
Acceleration Amplification Ratio
61
61
Bridge Seat and Deck Accelerations
-0.8
-0.6
-0.4
-0.2
0
0.2
0.4
0.6
0.8
0 4 8 12 16 20 24 28
Bridge Seat
Bridge Deck
Acceleration(g)
Time (s)
Imperial Valley Earthquake
Bridge deck:
Max acceleration = 0.53 g
Amplification ratio = 1.29
Bridge seat:
Max acceleration = 0.64 g
Amplification ratio = 1.56
62
62
32. 2/16/2017
32
Bridge Seat and Deck Accelerations
63
63
0
5
10
15
20
25
0 5 10 15 20 25
Bridge deck/shaking table
Bridge seat/shaking table
FourierAmplitude
Frequency (Hz)
Bridge Seat and Deck Movements
64
64
-16
-12
-8
-4
0
4
8
12
16
0 20 40 60 80 100
East
West
HorizontalDisplacement(mm)
Time (s)
-16
-12
-8
-4
0
4
8
12
16
0 20 40 60 80 100
HorizontalDisplacement(mm)
Time (s)
Test 4 – Maule Motion
33. 2/16/2017
33
Bridge Seat and Deck Movements
65
65
-16
-12
-8
-4
0
4
8
12
16
0 20 40 60 80 100
RelativeHorizontalDisplacement(mm)
Time (s)
Test 4 – Maule Motion
Bridge Seat and Deck Movements
-30
-20
-10
0
10
20
30
0 4 8 12 16 20 24 28
RelativeDisplacement(mm)
Time (s)
Relative Displacement
(mm)
1940 Imperial Valley 2010 Maule 1994 Northridge
Residual 2.1 1.4 ‐4.3
Maximum ‐ 6.8/8.3 ‐9.7/9.8 ‐30/20.6
Test 4 Bridge deck sliding relative to bridge seat (relative displacement)
Northridge Earthquake
seismic joint closed
moving away from
bridge seat
moving towards
bridge seat
seismic joint
remained open
66
66
34. 2/16/2017
34
Seismic Joint Closure
0
10
20
30
40
50
60
0 4 8 12 16 20 24 28
SeismicJointSize(mm)
Time (s)
Northridge Earthquake
closed
remained open
67
67
Horizontal Contact Forces: Earthquake
-100
-50
0
50
100
0 4 8 12 16 20 24 28
Load Cell - East
Load Cell - West
HorizontalContactForce(kN)
Time (s)
Horizontal contact forces for the Northridge Earthquake, Test 4
68
68
35. 2/16/2017
35
Reinforcement Strains
69
69
0
0.05
0.10
0.15
0.20
Top
Bottom
x = 0.46 m, z = 1.875 m
0
0.05
0.10
0.15
0.20
Top
Bottom
ReinforcementStrain(%)
x = 0.46 m, z = 0.975 m
0
0.05
0.10
0.15
0.20
0 4 8 12 16 20 24 28
Top
Bottom
Time (s)
x = 0.46 m, z = 0.075 m
Test 4 1940 Imperial Valley Motion
Reinforcement
Strains
70
70
Test 4 1940 Imperial Valley Motion
bridge load
0
0.1
0.2
0.3
Initial
Maximum
Minimum
Residual
z = 1.95 m
layer 13
0
0.1
0.2
0.3
z = 1.50 m
layer 10
0
0.1
0.2
0.3
ReinforcementStrain(%)
z = 1.05 m
layer 7
0
0.1
0.2
0.3
z = 0.60 m
layer 4
0
0.1
0.2
0.3
0 0.5 1.0 1.5 2.0
z = 0.15 m
layer 1
Distance from Facing, x (m)
36. 2/16/2017
36
Reinforcement Strains (Max.)
Longitudinal Section L1
bridge load
ReinforcementStrain(%)
0
0.1
0.2
0.3
0.4
0.5
EOC
Imperial Valley
Maule
Northridge
z = 1.95 m
layer 13
0
0.1
0.2
0.3
0.4
0.5
z = 1.05 m
layer 7
0
0.1
0.2
0.3
0.4
0.5
0 0.5 1.0 1.5 2.0
z = 0.15 m
layer 1
Distance from Facing (m)
bridge load
-0.1
0
0.1
0.2
0.3
0.4
EOC
Imperial Valley
Maule
Northridge
z = 1.95 m
layer 13
-0.1
0
0.1
0.2
0.3
0.4
z = 1.5 m
layer 10
-0.1
0
0.1
0.2
0.3
0.4
ReinforcementStrain(%)
z = 1.05 m
layer 7
-0.1
0
0.1
0.2
0.3
0.4
z = 0.6 m
layer 4
-0.1
0
0.1
0.2
0.3
0.4
0 0.5 1.0 1.5 2.0
z = 0.15 m
layer 1
Distance from Facing (m)
bridge load
ReinforcementStrain(%)
0
0.1
0.2
0.3
0.4
0.5
z = 1.95 m
layer 13
0
0.1
0.2
0.3
0.4
0.5
z = 1.05 m
layer 7
0
0.1
0.2
0.3
0.4
0.5
0 0.2 0.4 0.6 0.8 1.0
z = 0.15 m
layer 1
Distance from Facing (m)
Longitudinal Section L2 Transverse Section T1
max strain
71
71
Preliminary Findings
• The bridge deck load was observed to lead to more static deformations (lateral and
vertical), but less dynamic deformations due to the greater geosynthetic
confinement
• Lateral displacements are greater near the top of the wall but are not large enough
to cause geotechnical concerns
• Lateral displacements and acceleration responses for section L1 are larger than L2
• Acceleration amplifies with elevation, and amplification ratios increase from
retained soil zone to reinforced soil zone to wall facing
• Seismic‐induced reinforcement strains are largest near the wall face due to the
inertia of the facing blocks
• Seismic joint might close during shaking and result in impact force on the bridge
seat, but only during high frequency sinusoidal movements or Northridge EQ
• Overall, MSE abutments show good seismic performance in terms of lateral facing
displacements and bridge seat movements
72
72