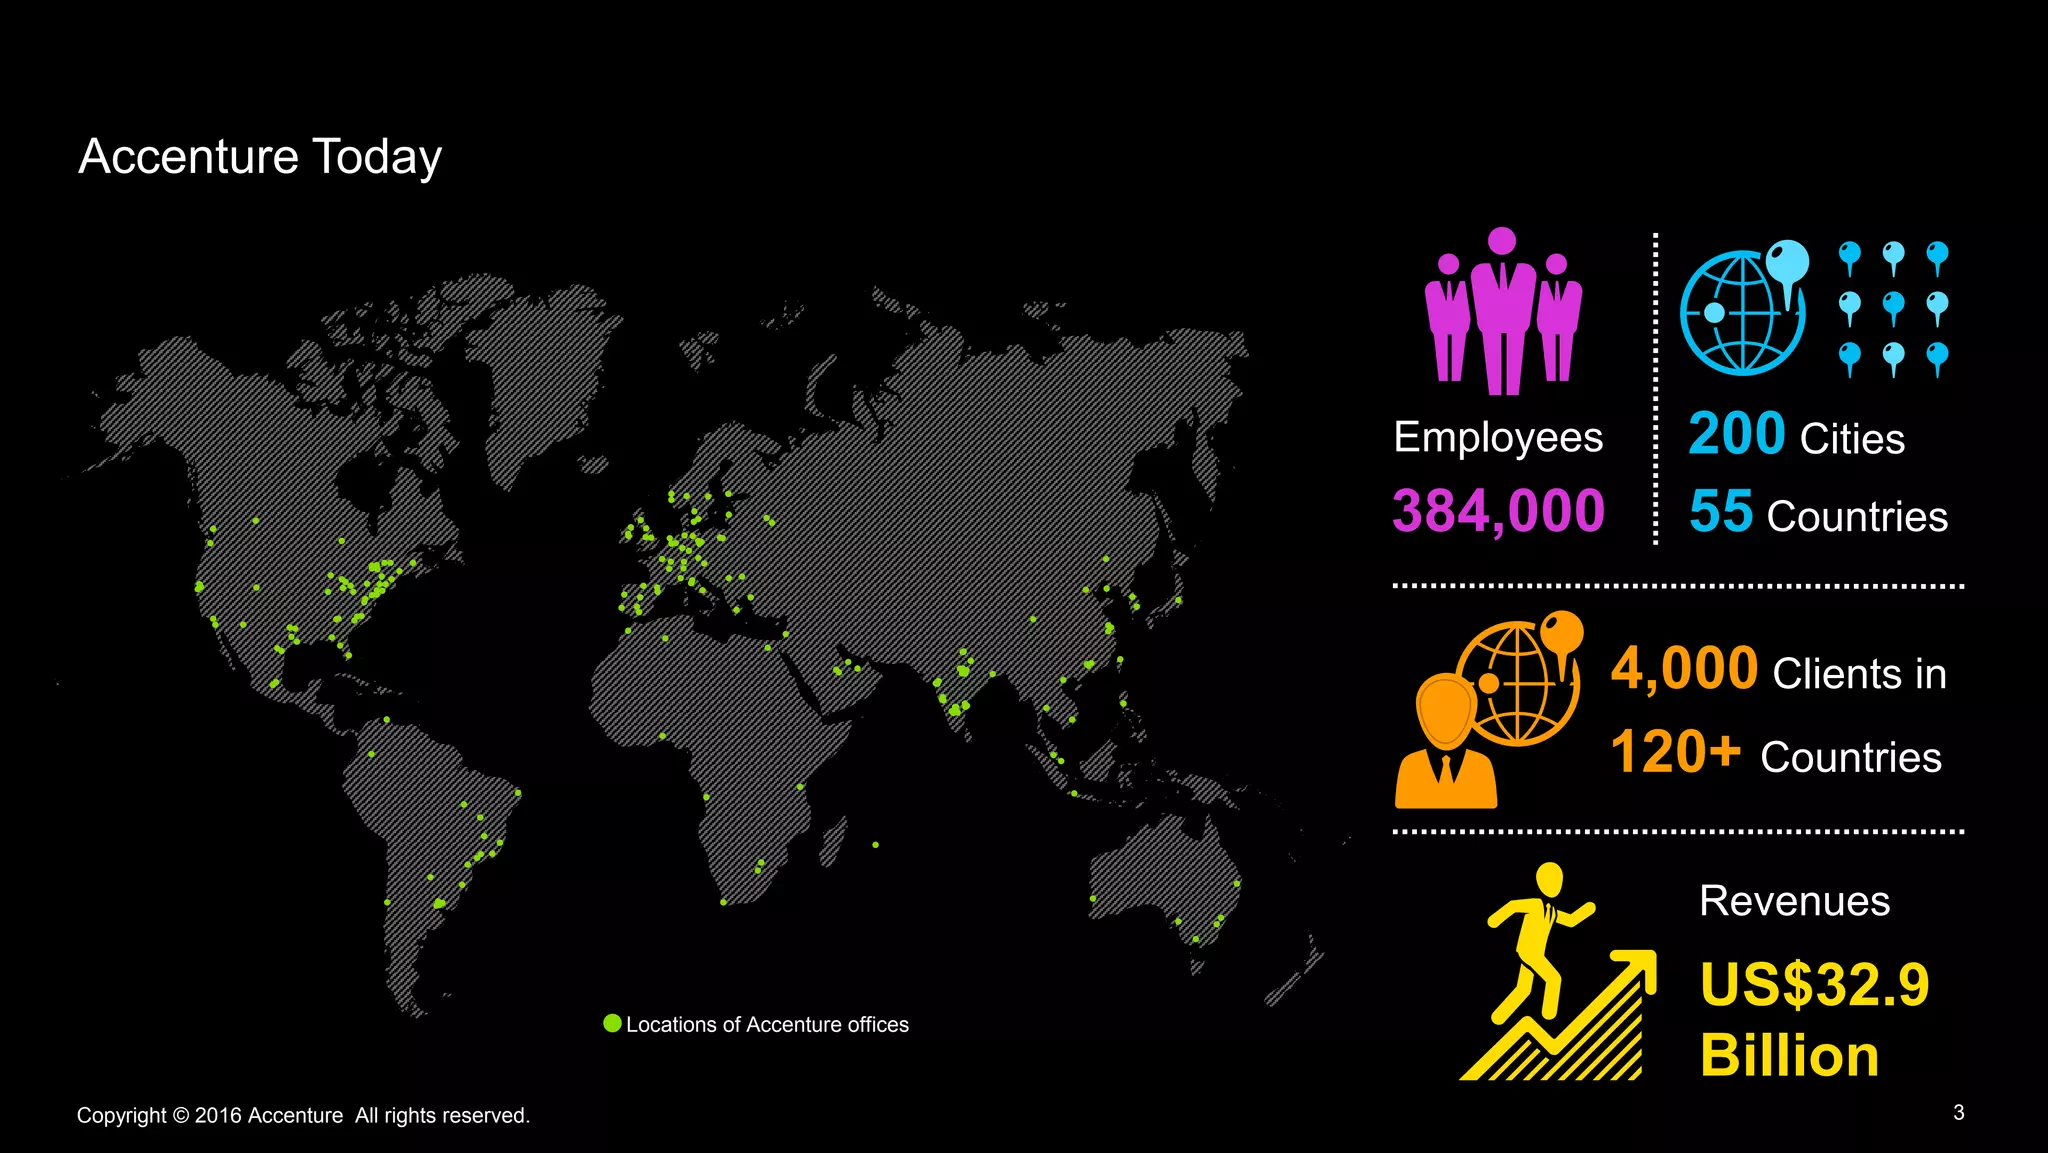
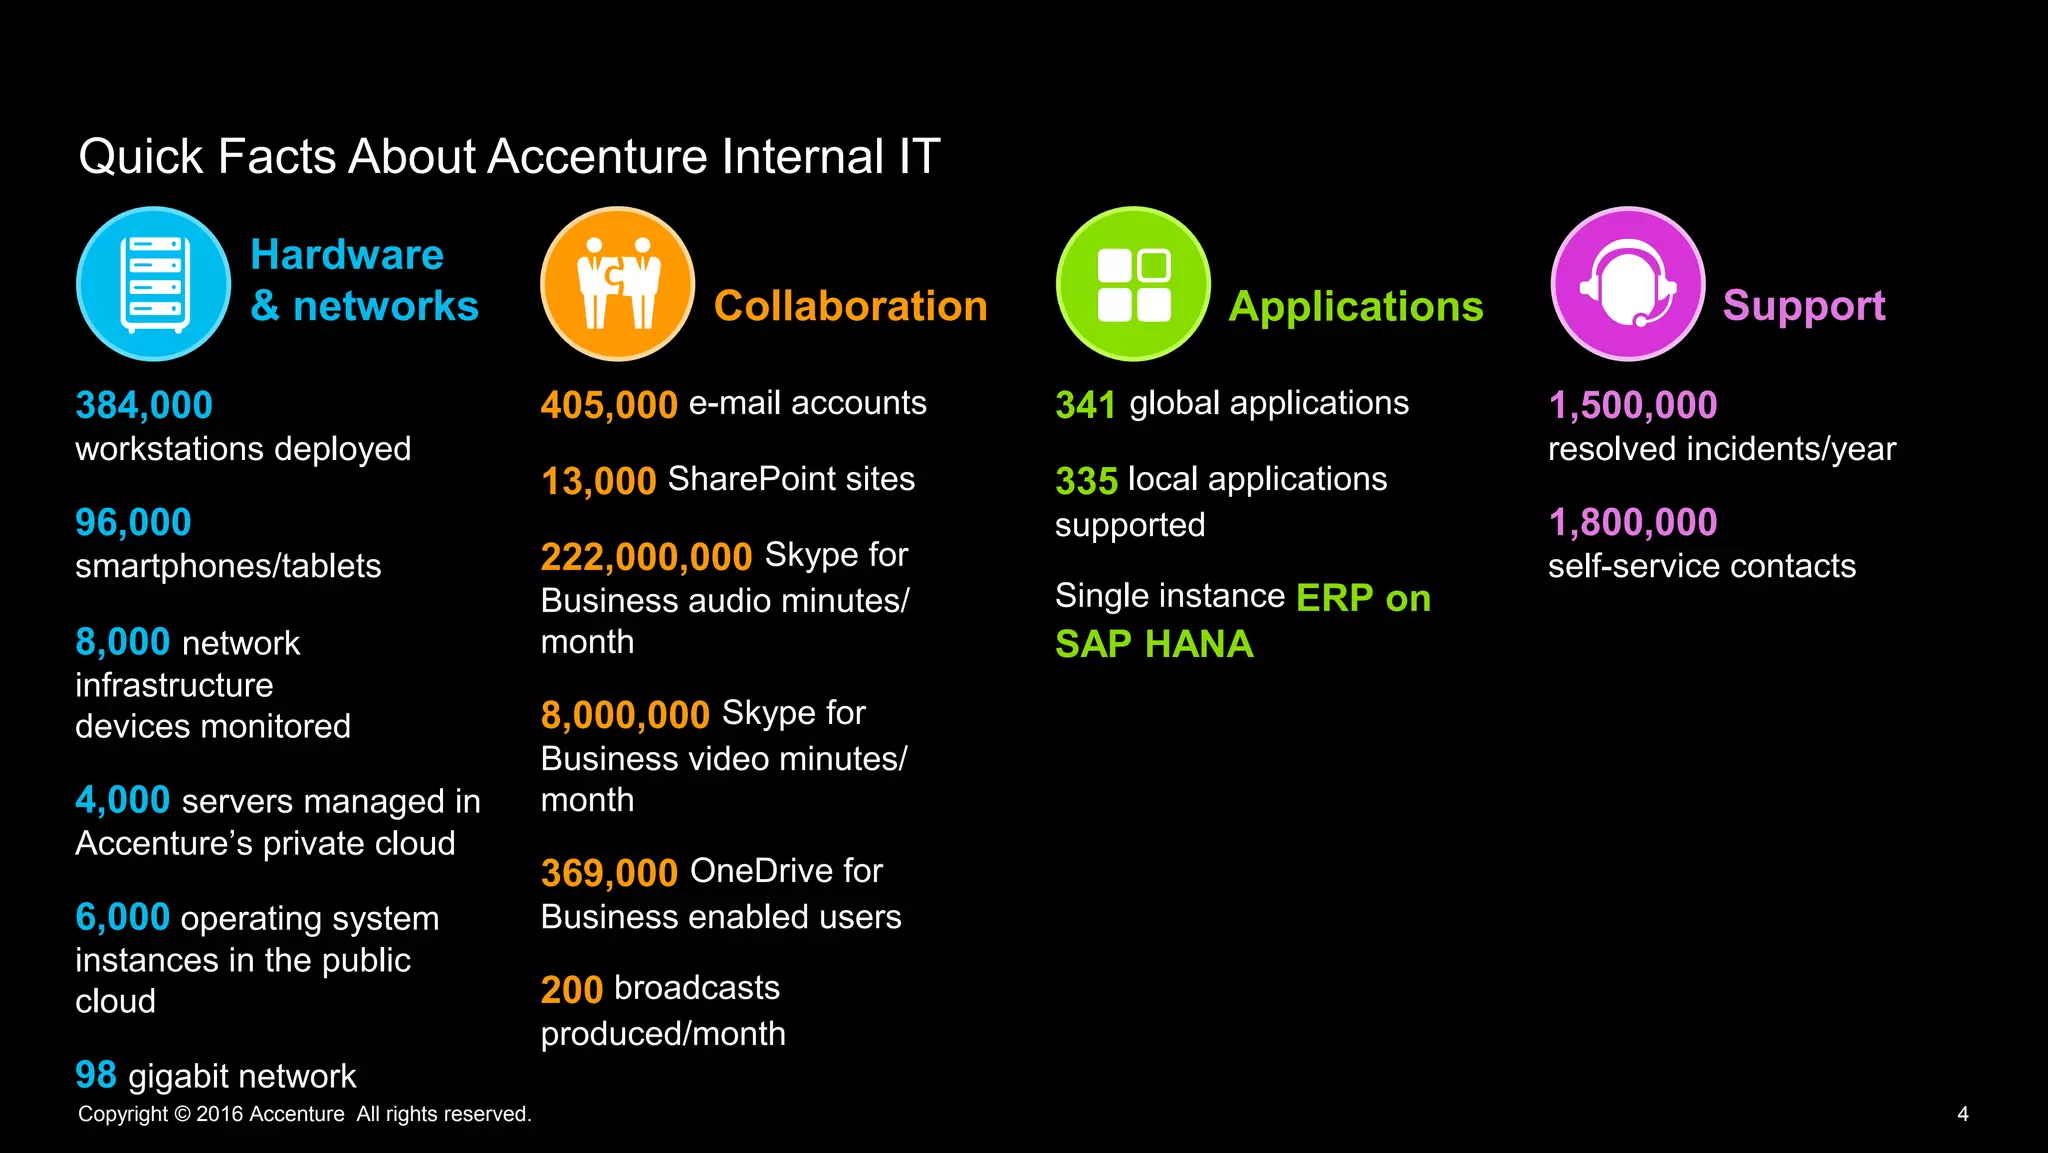
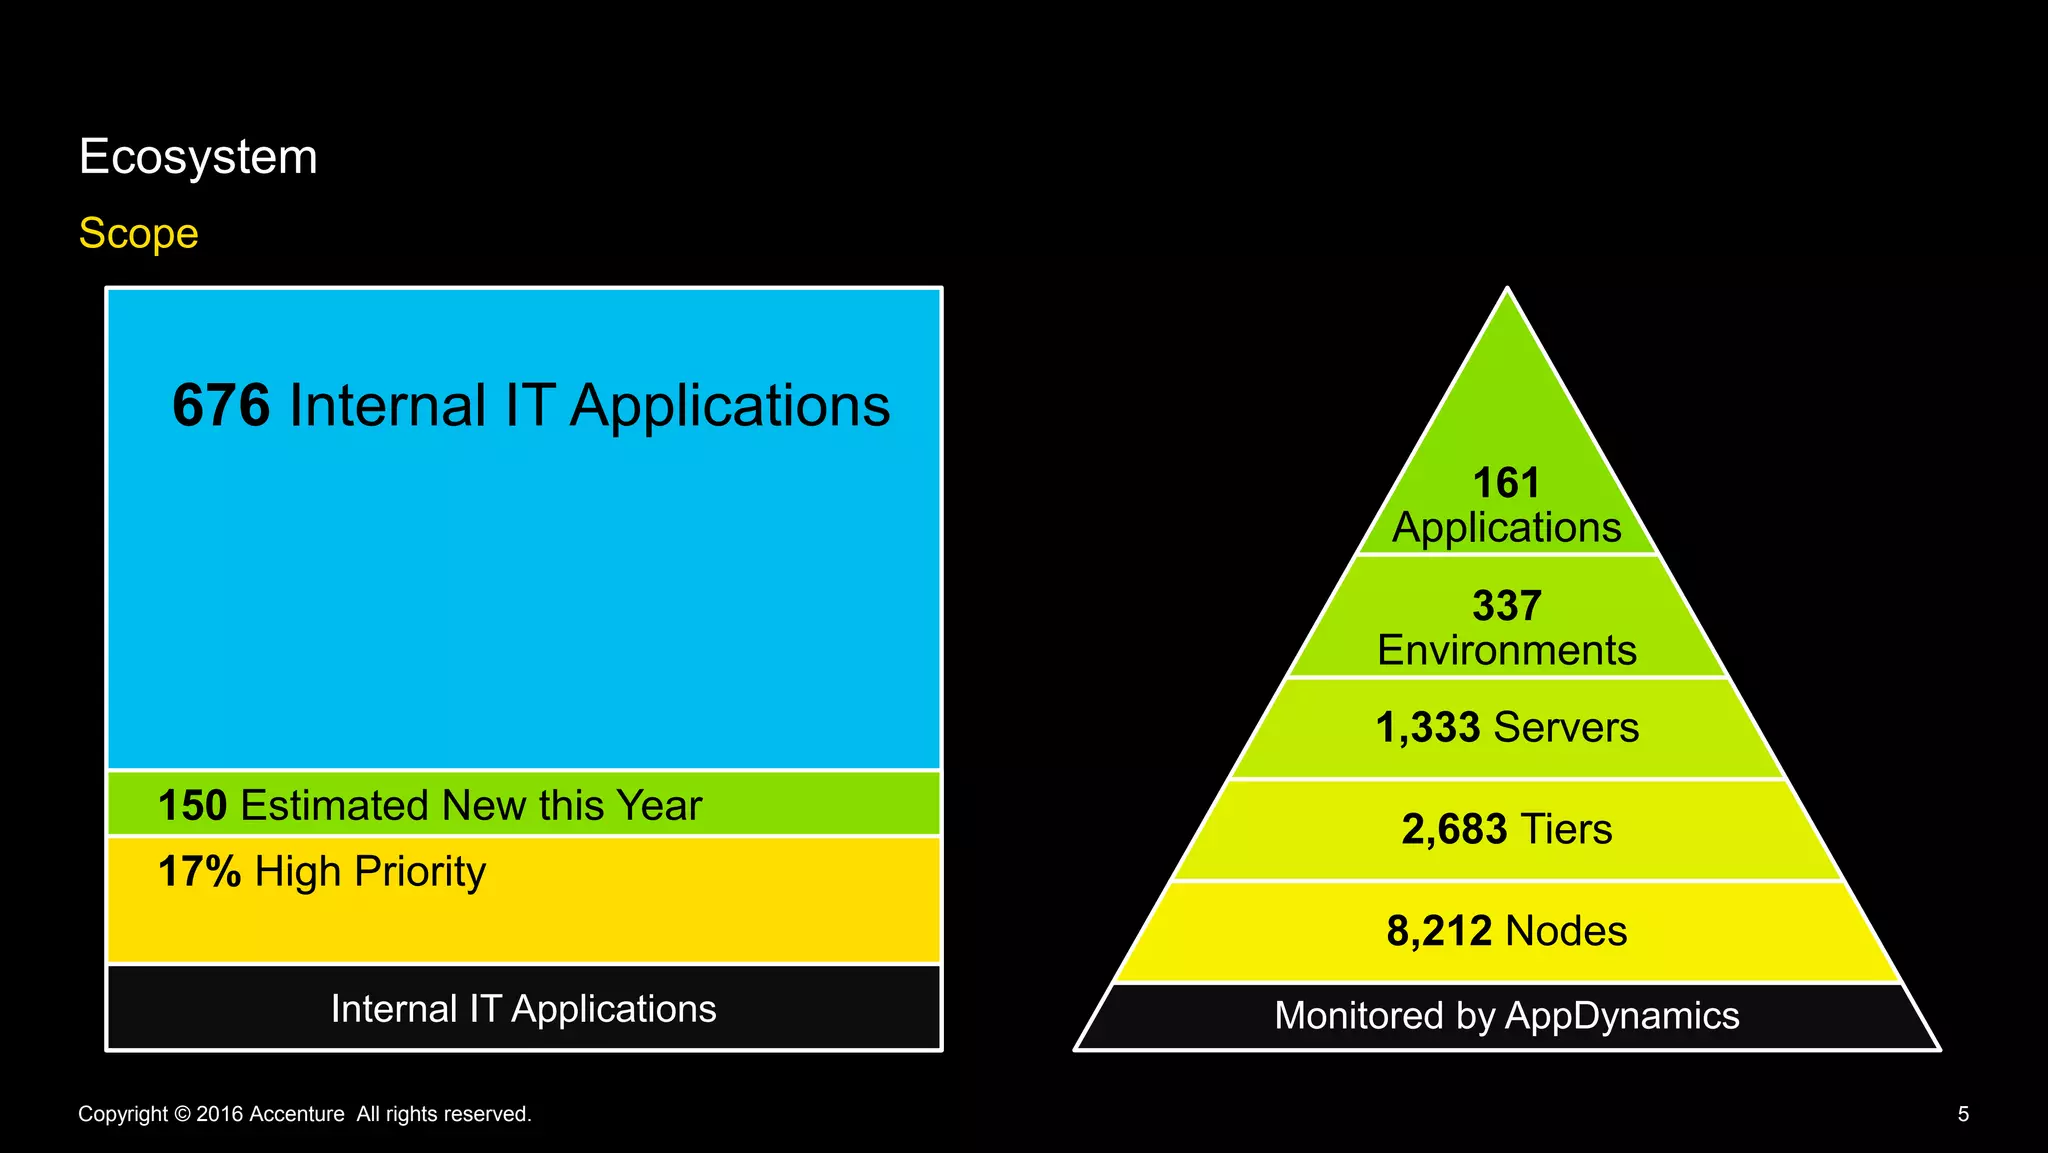
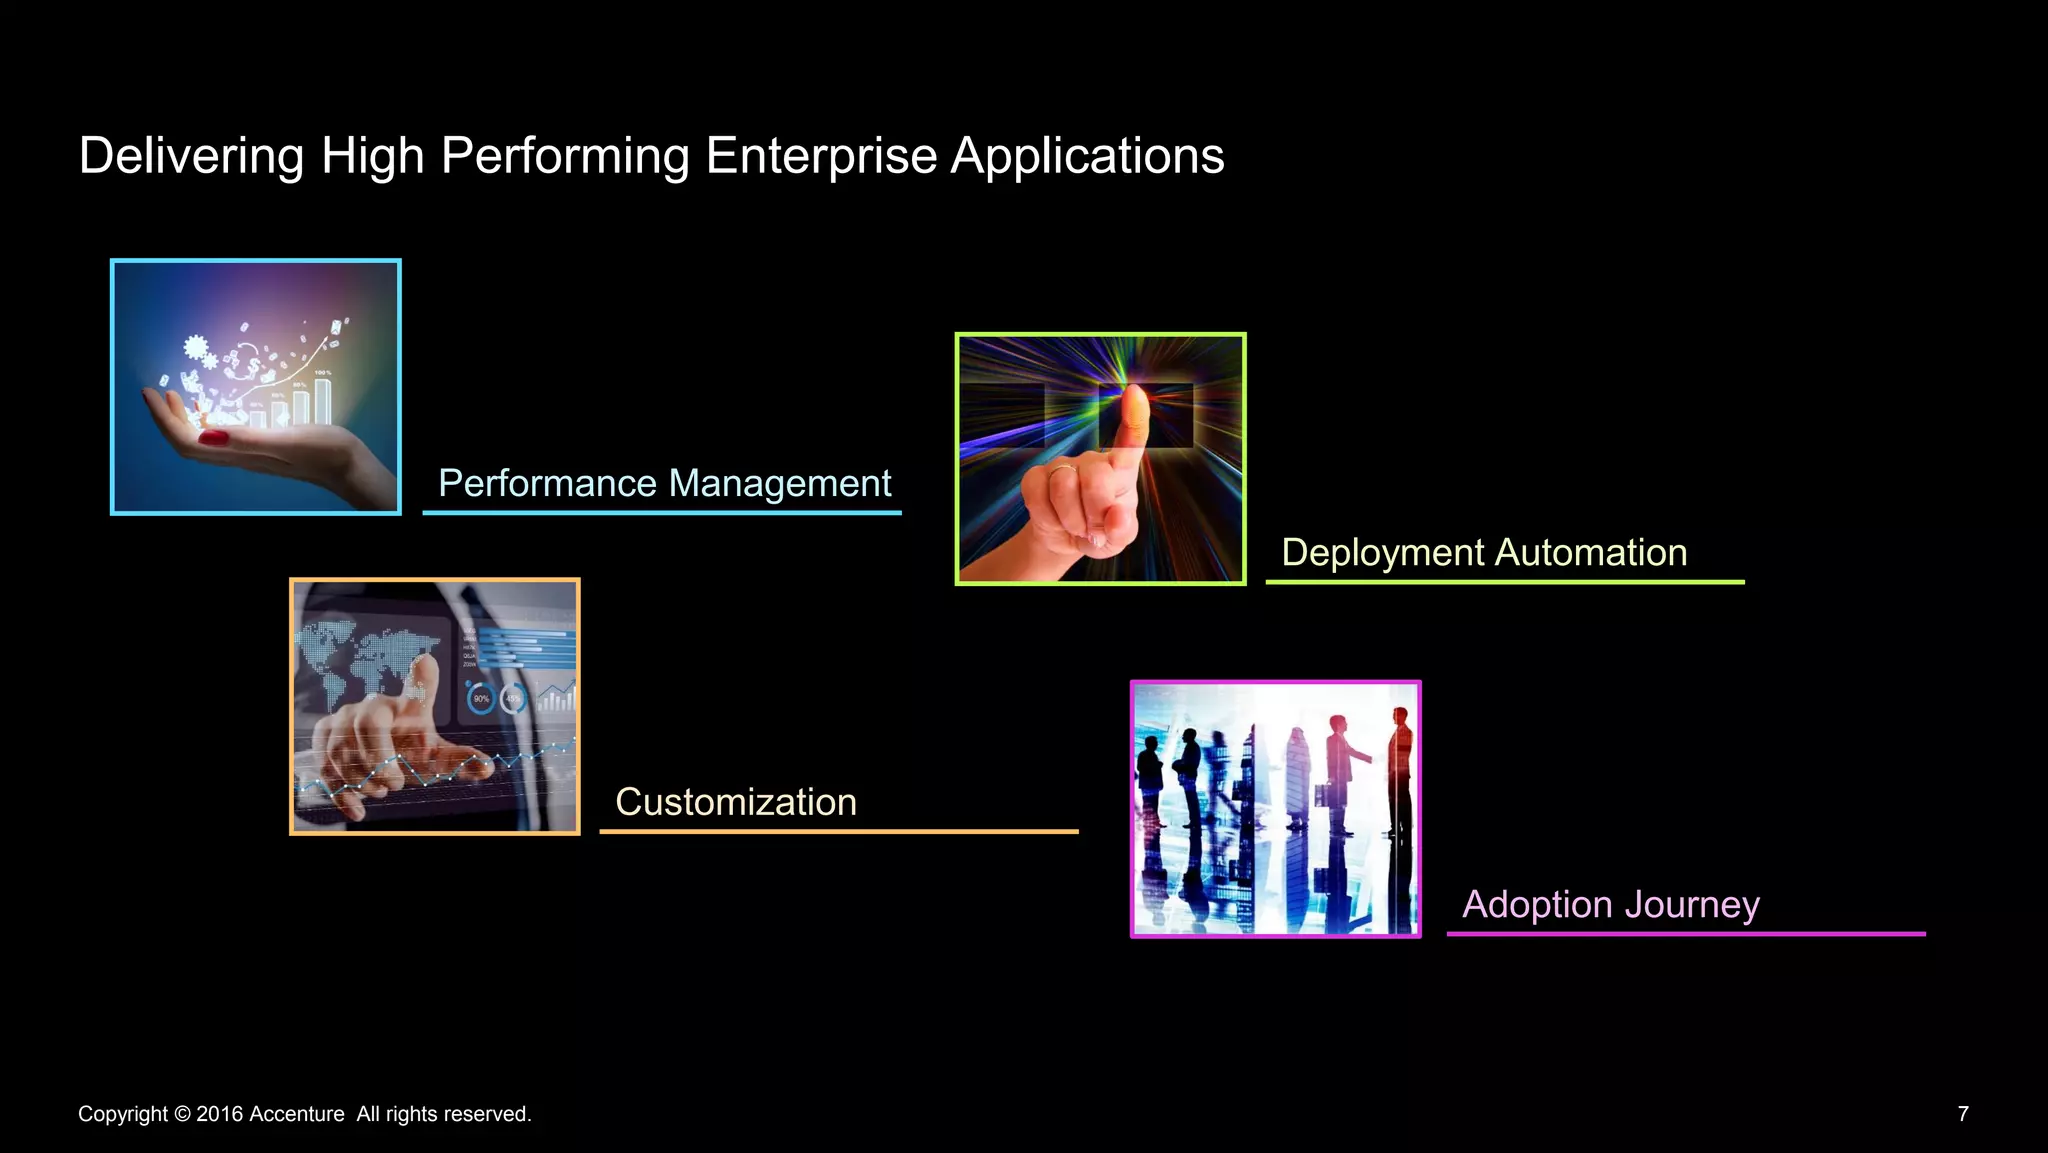
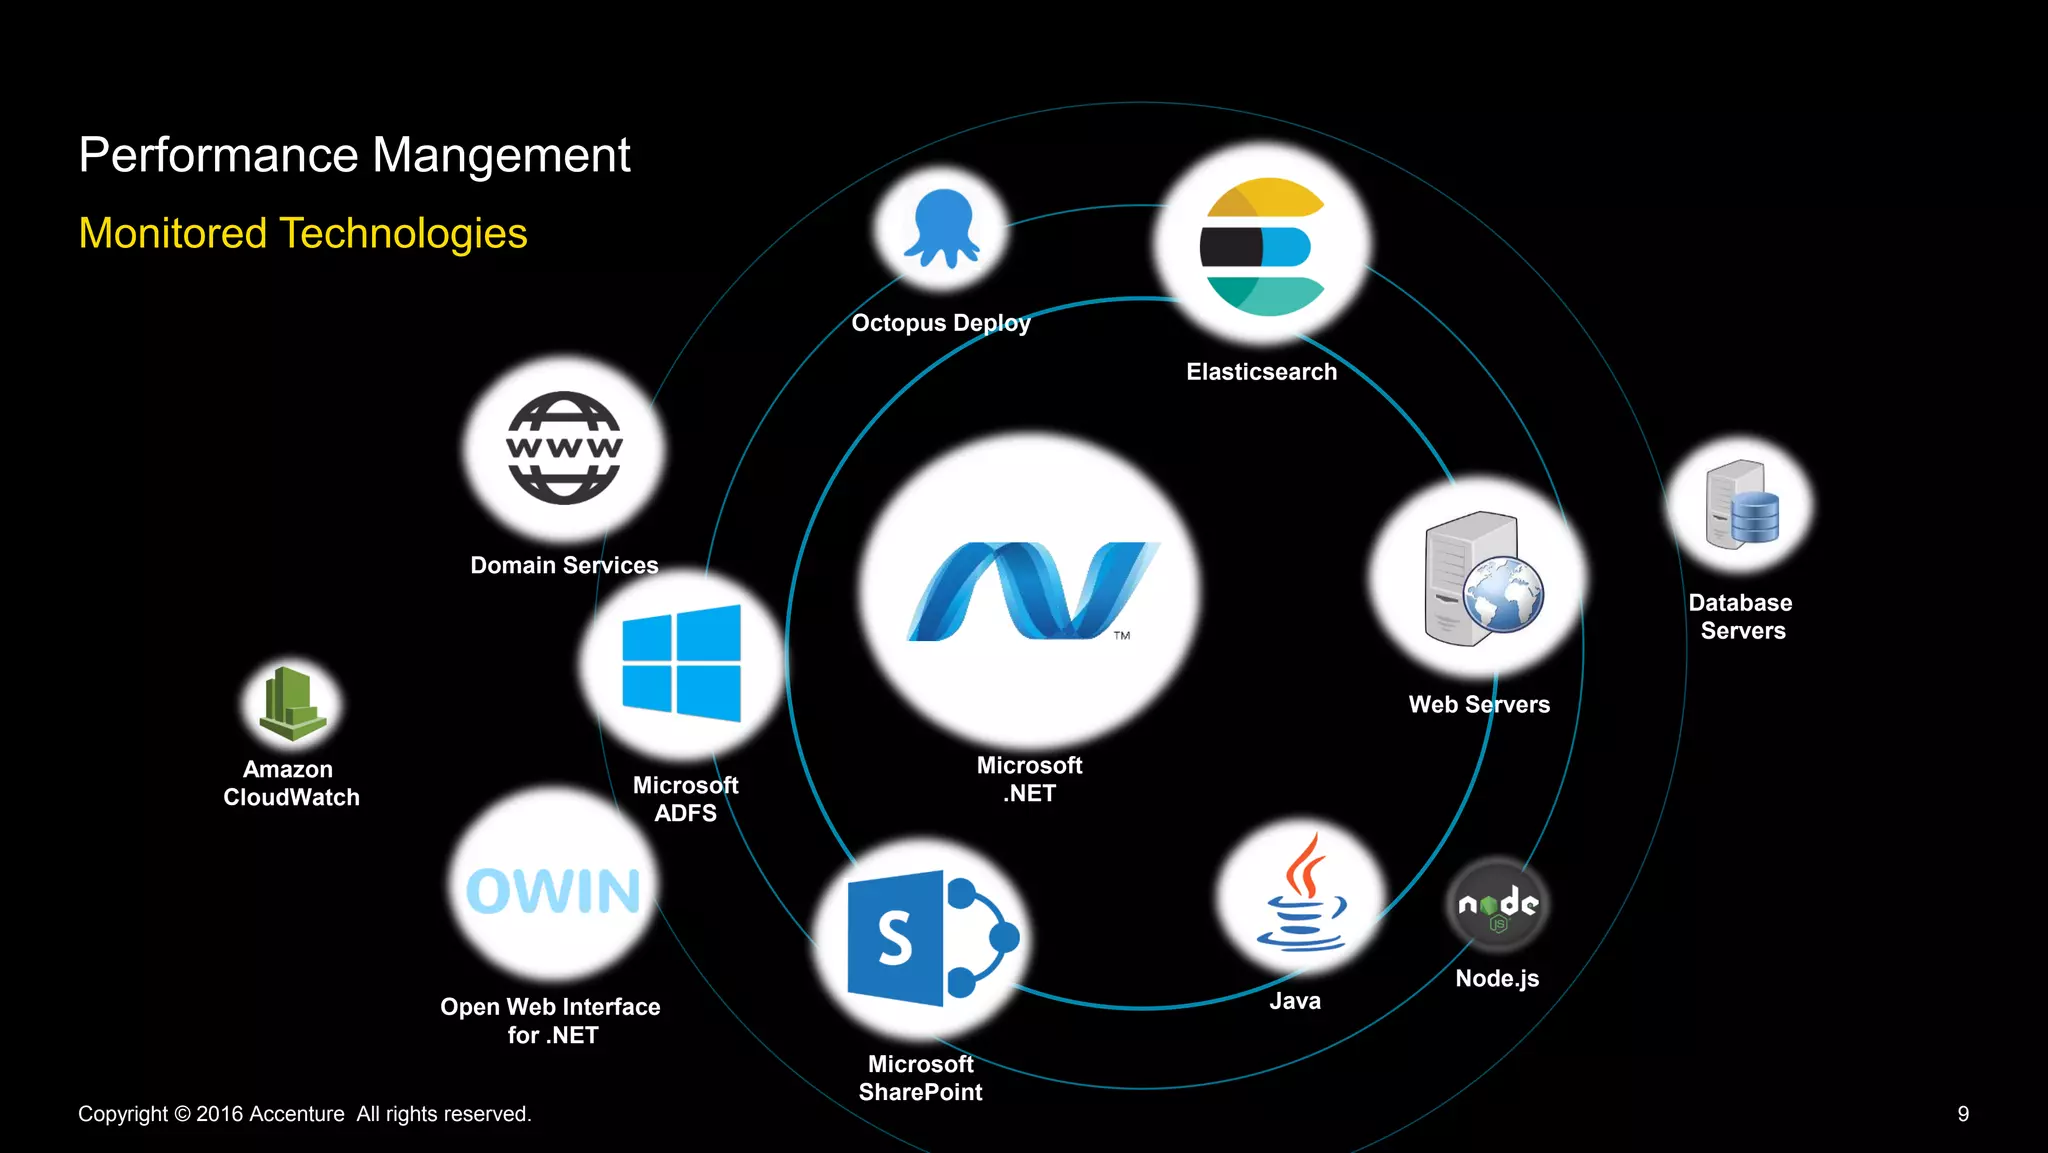
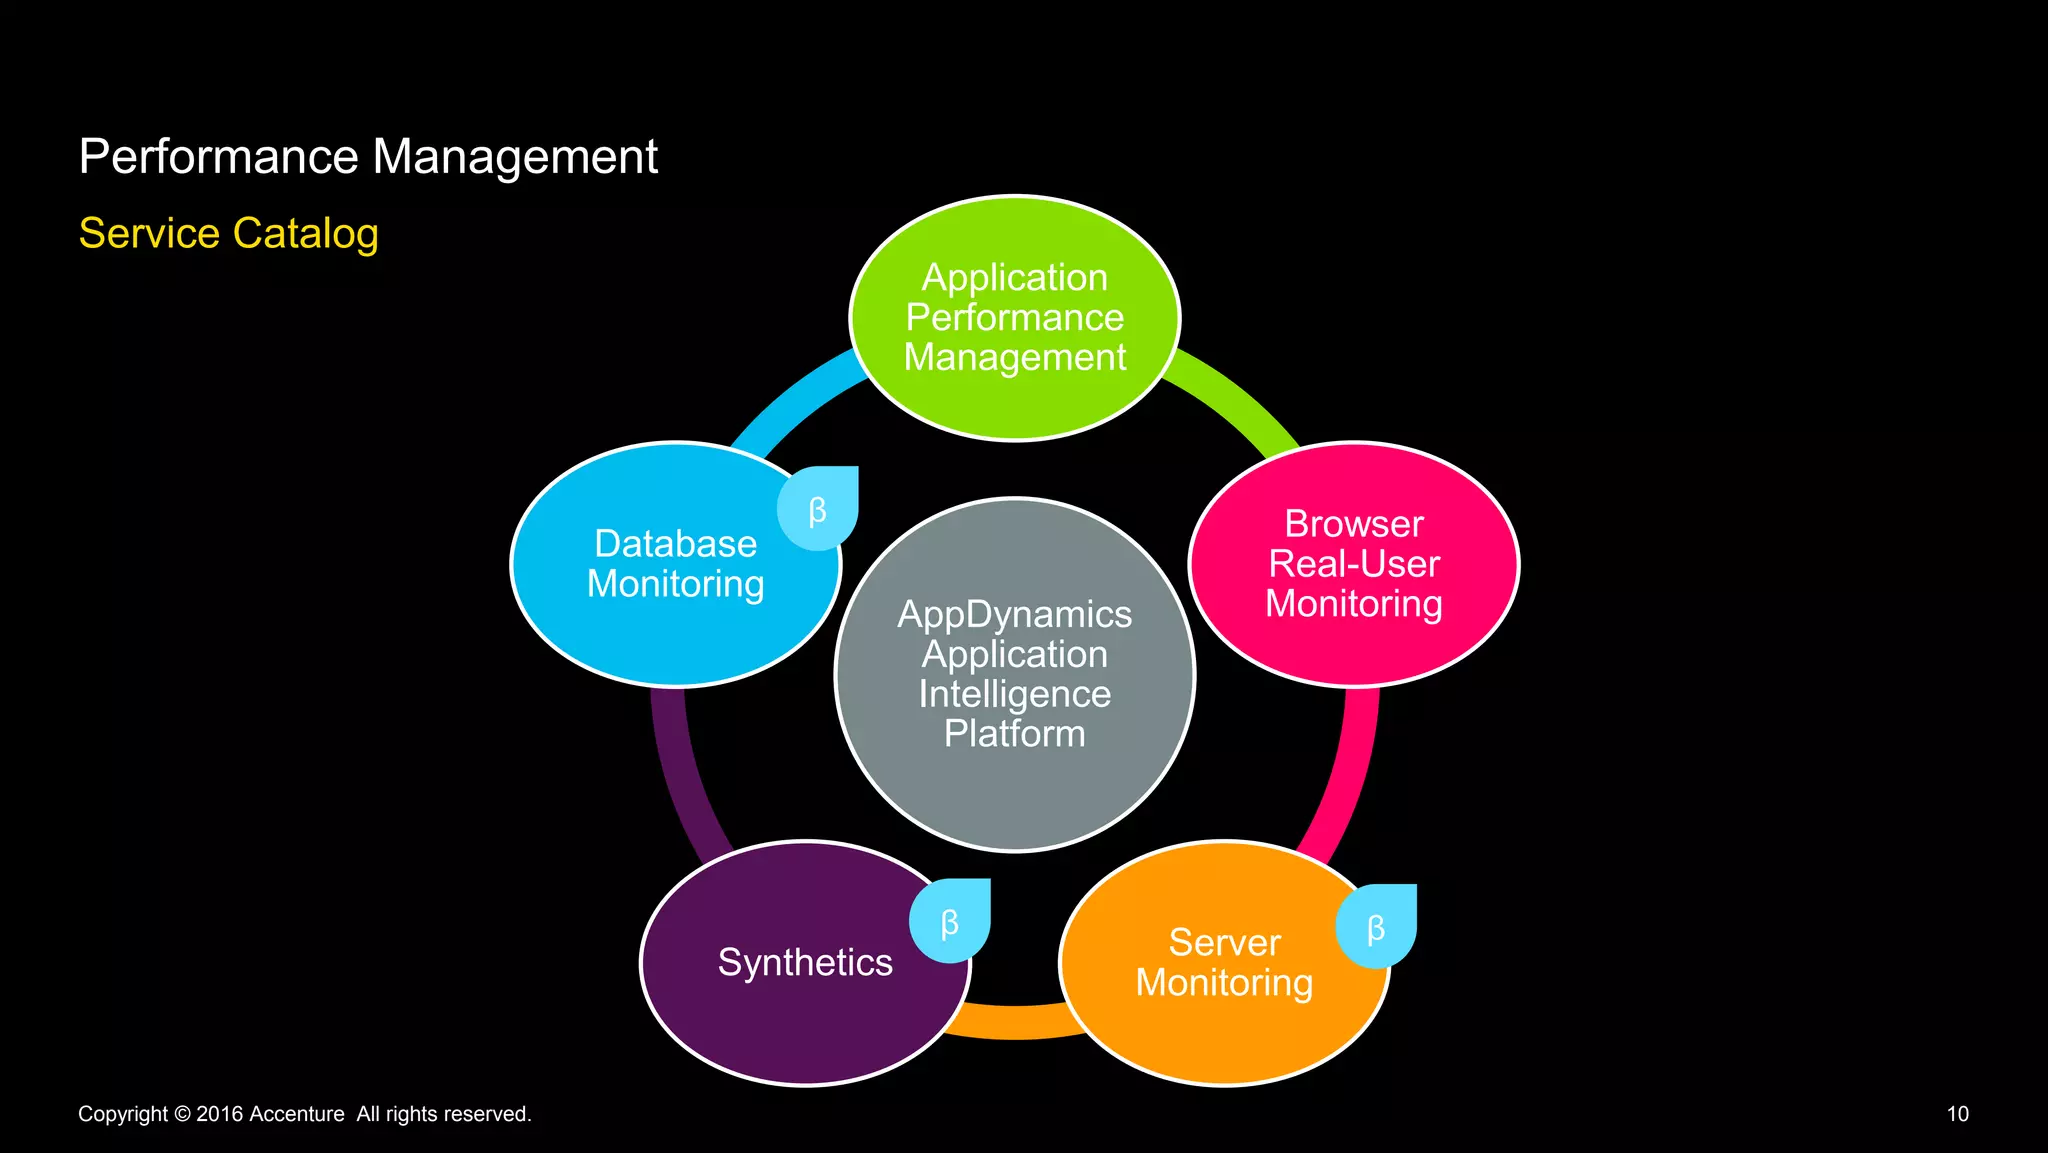
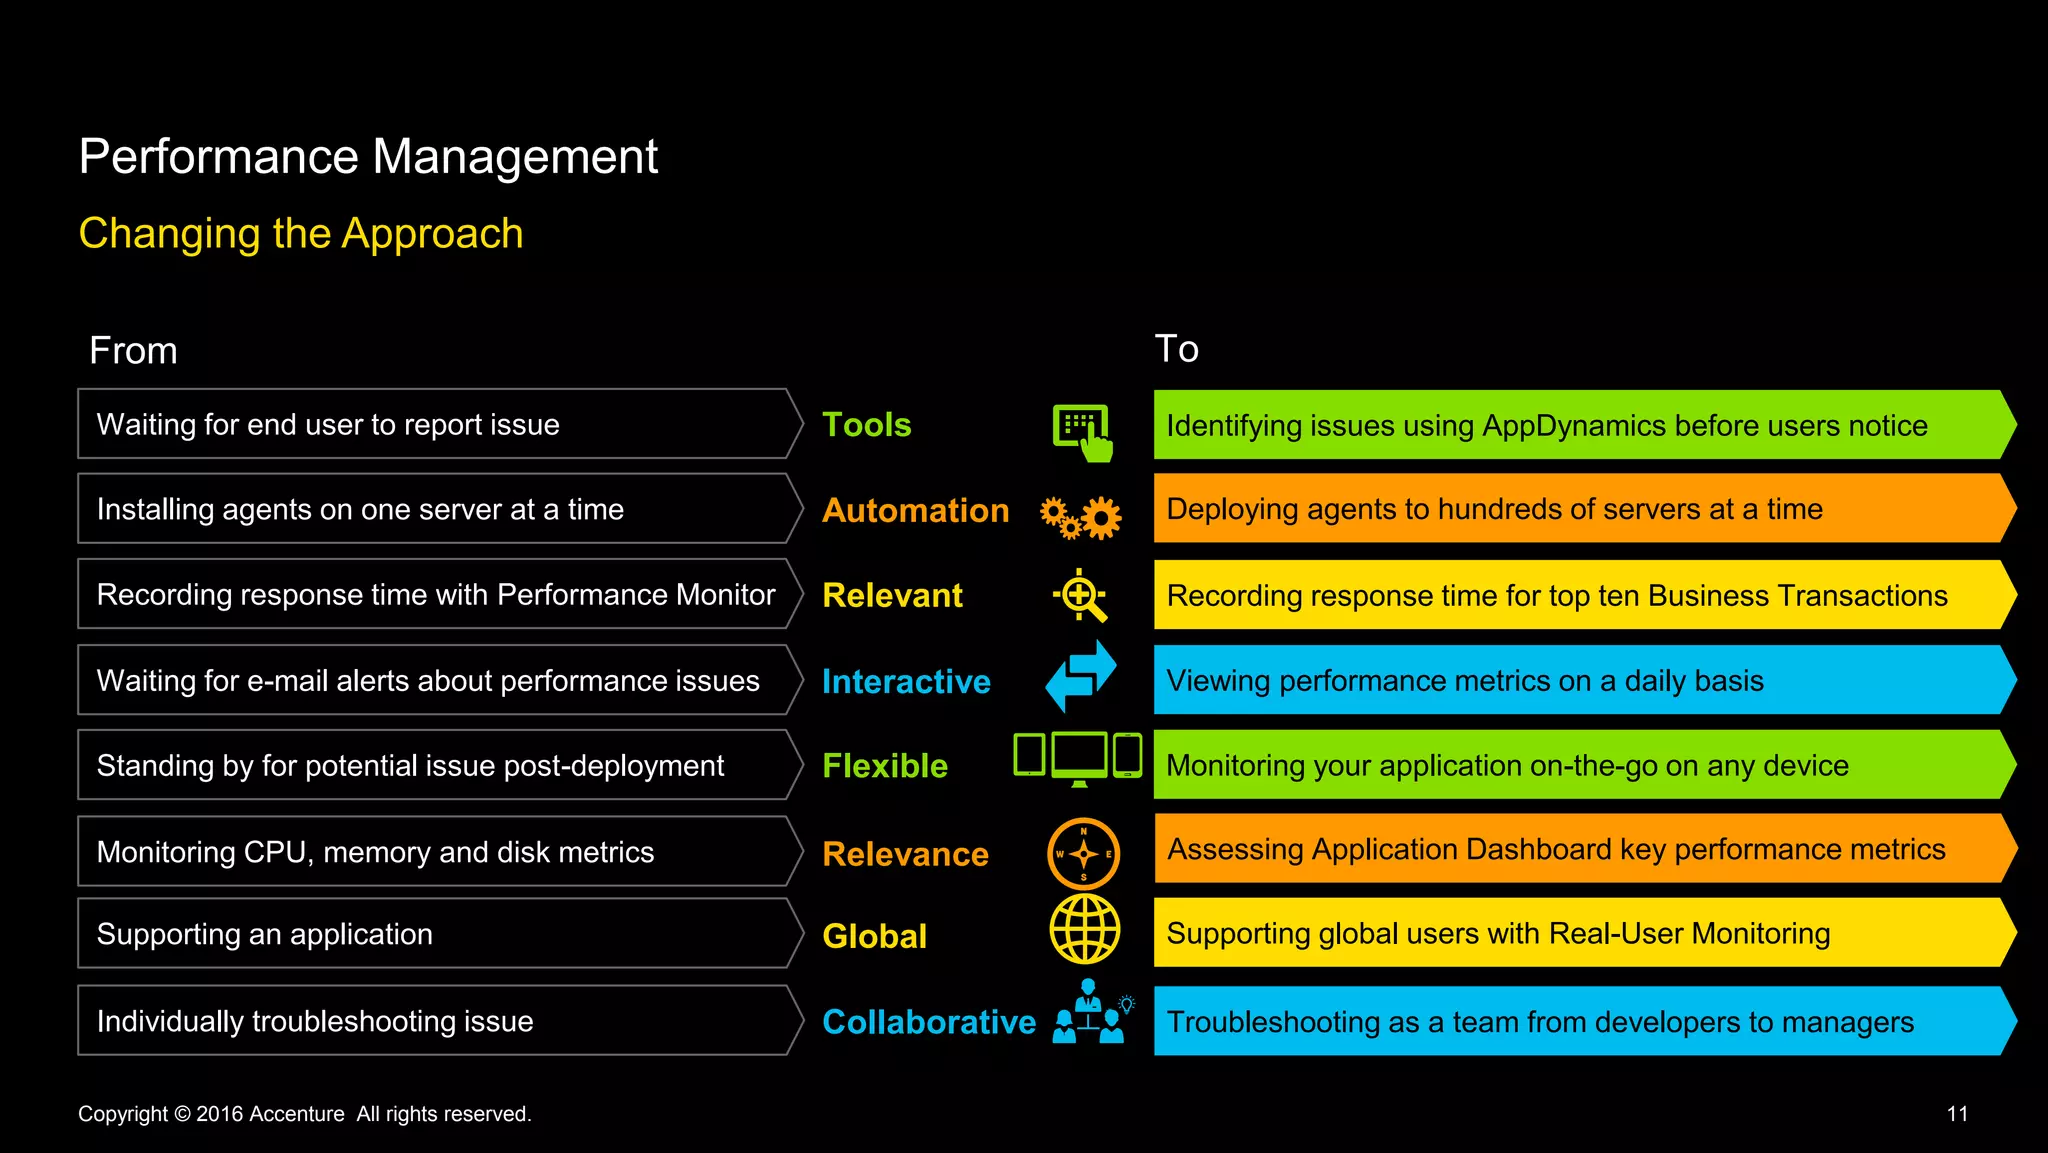
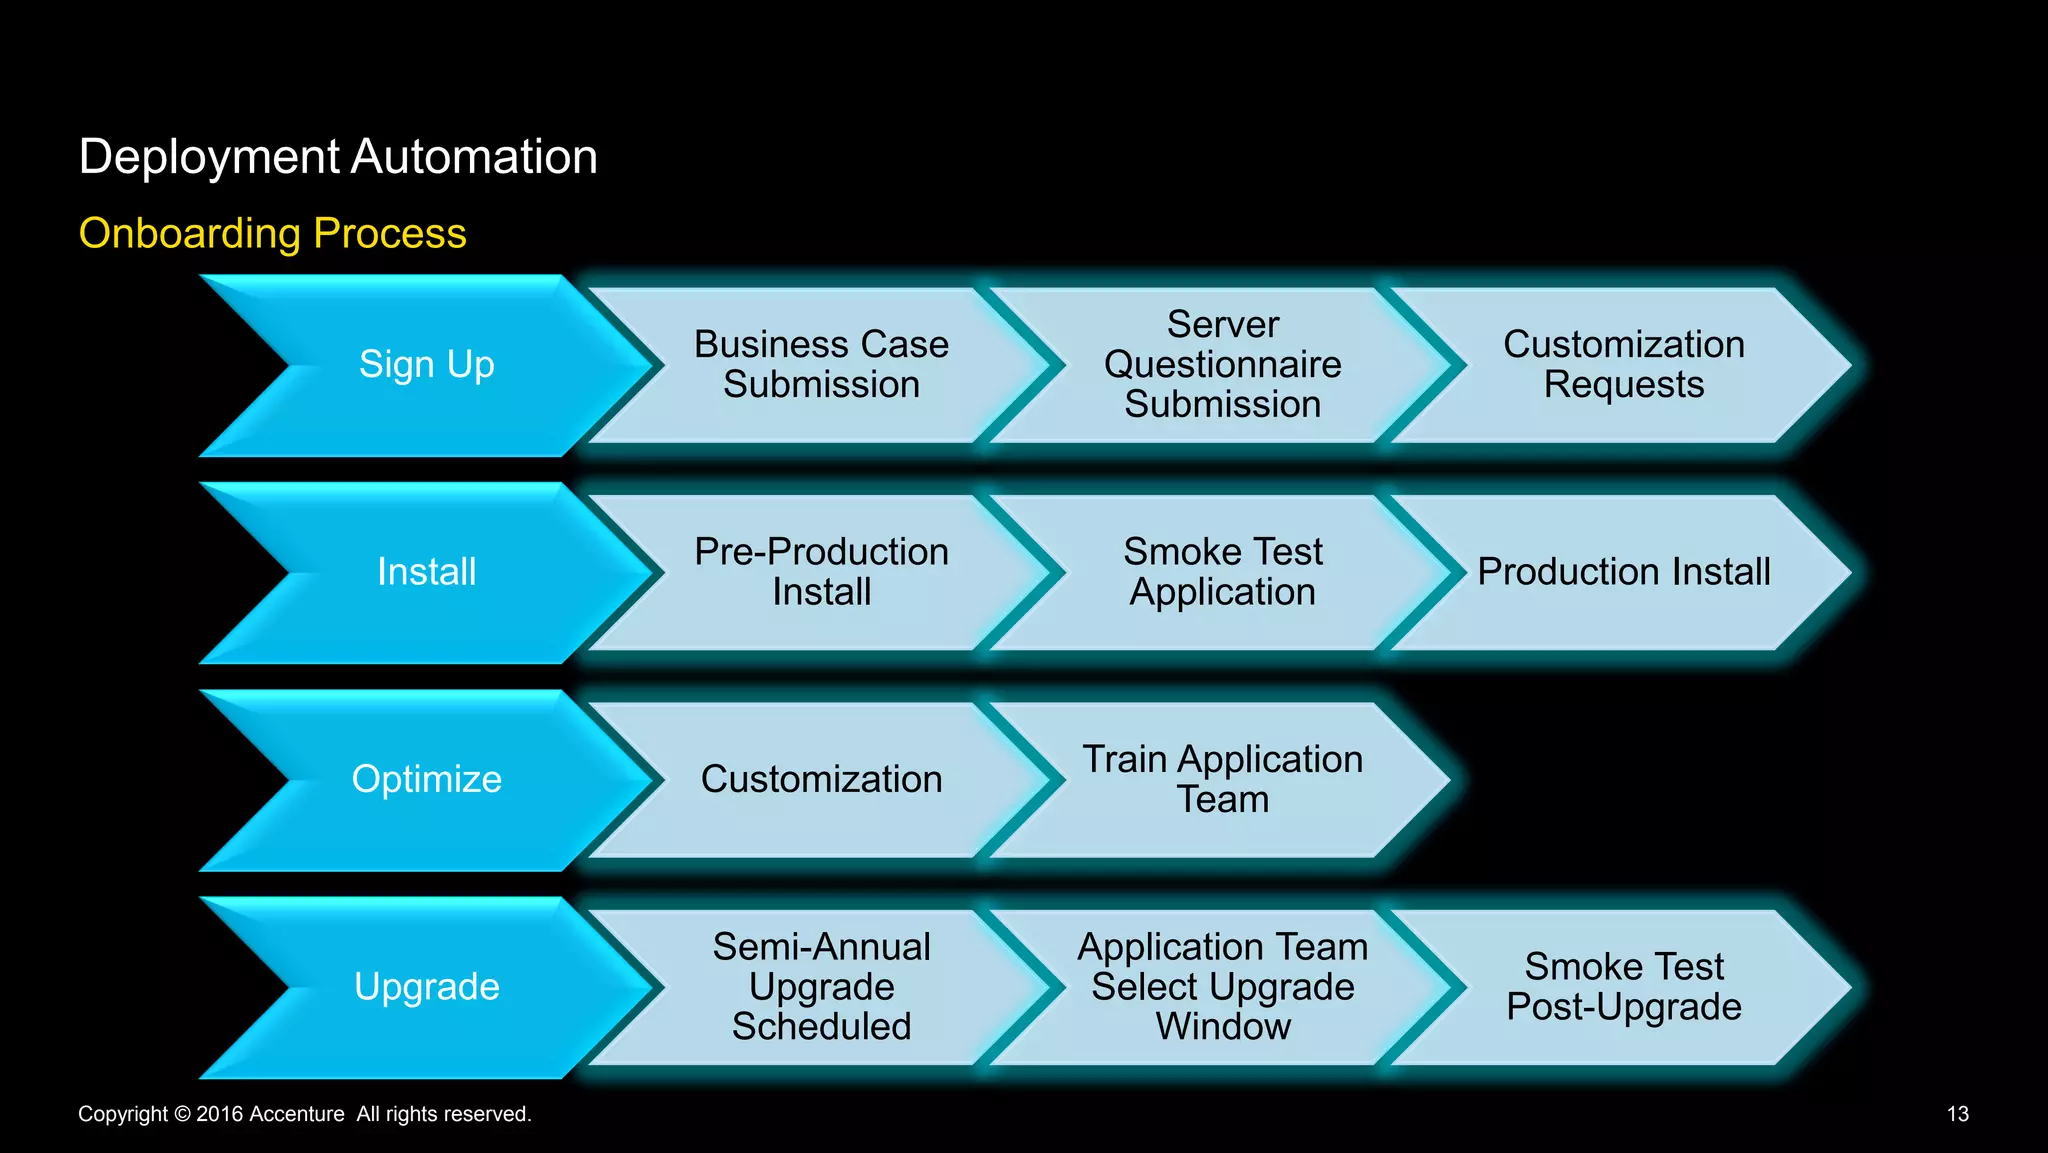
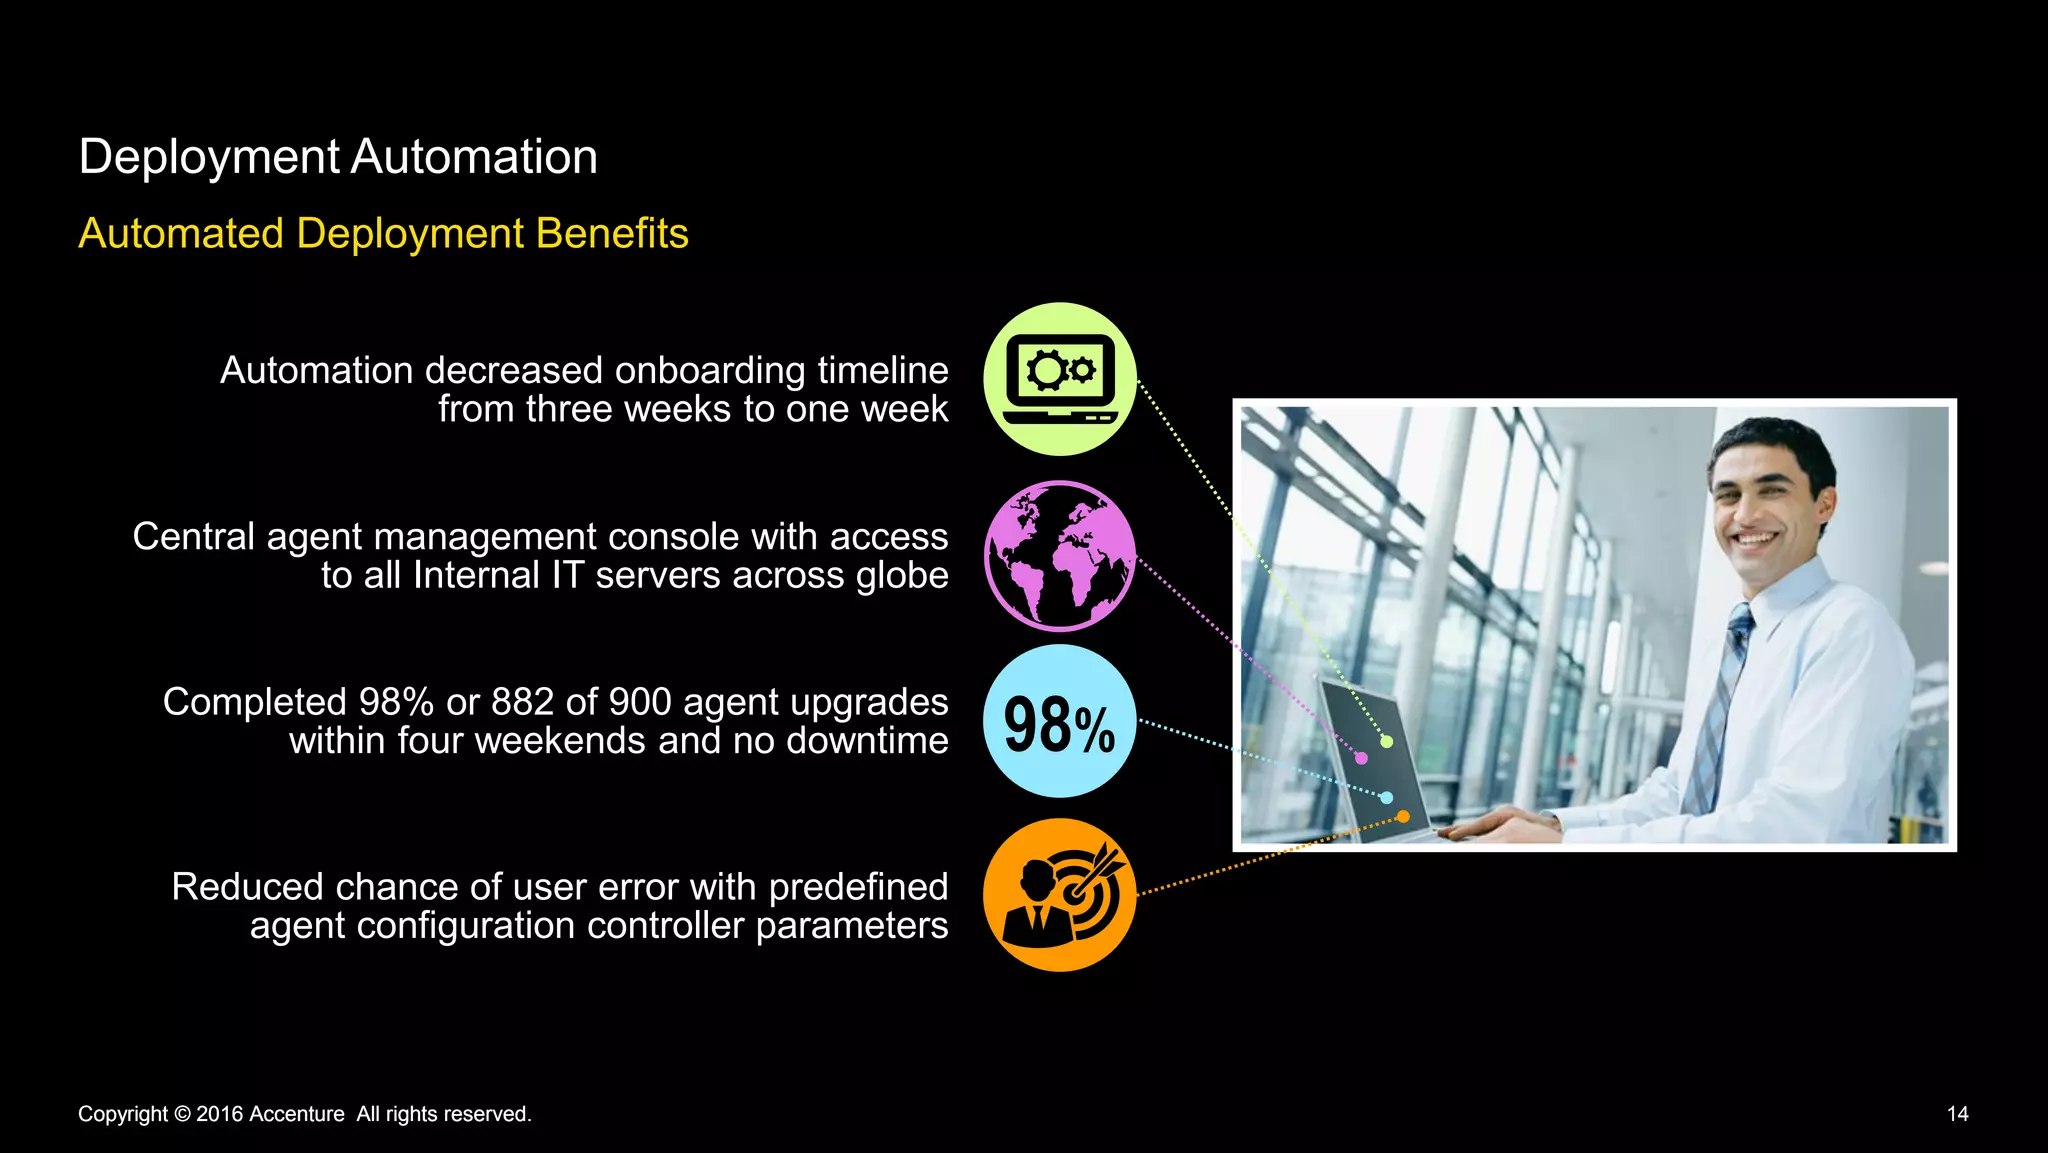
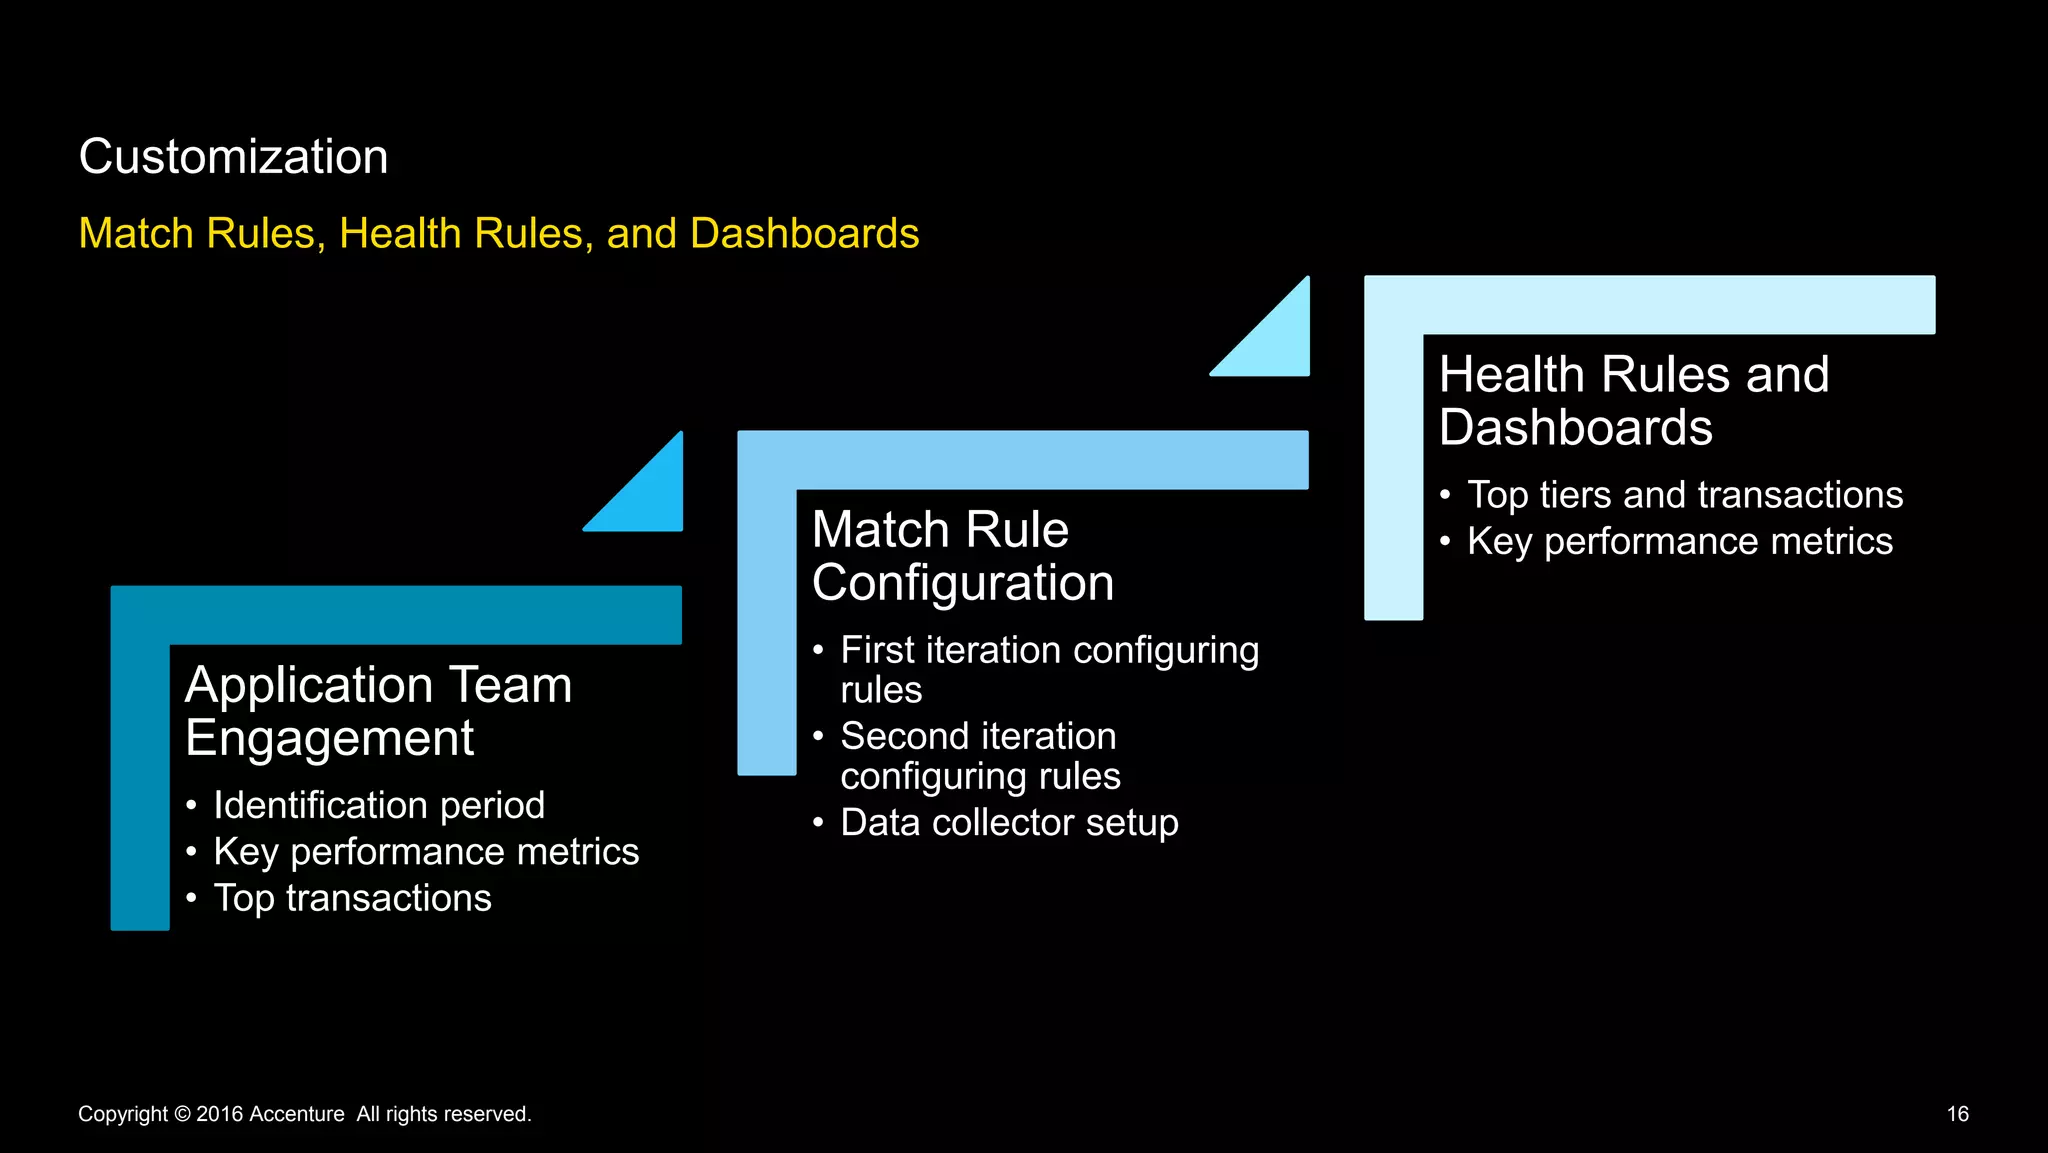
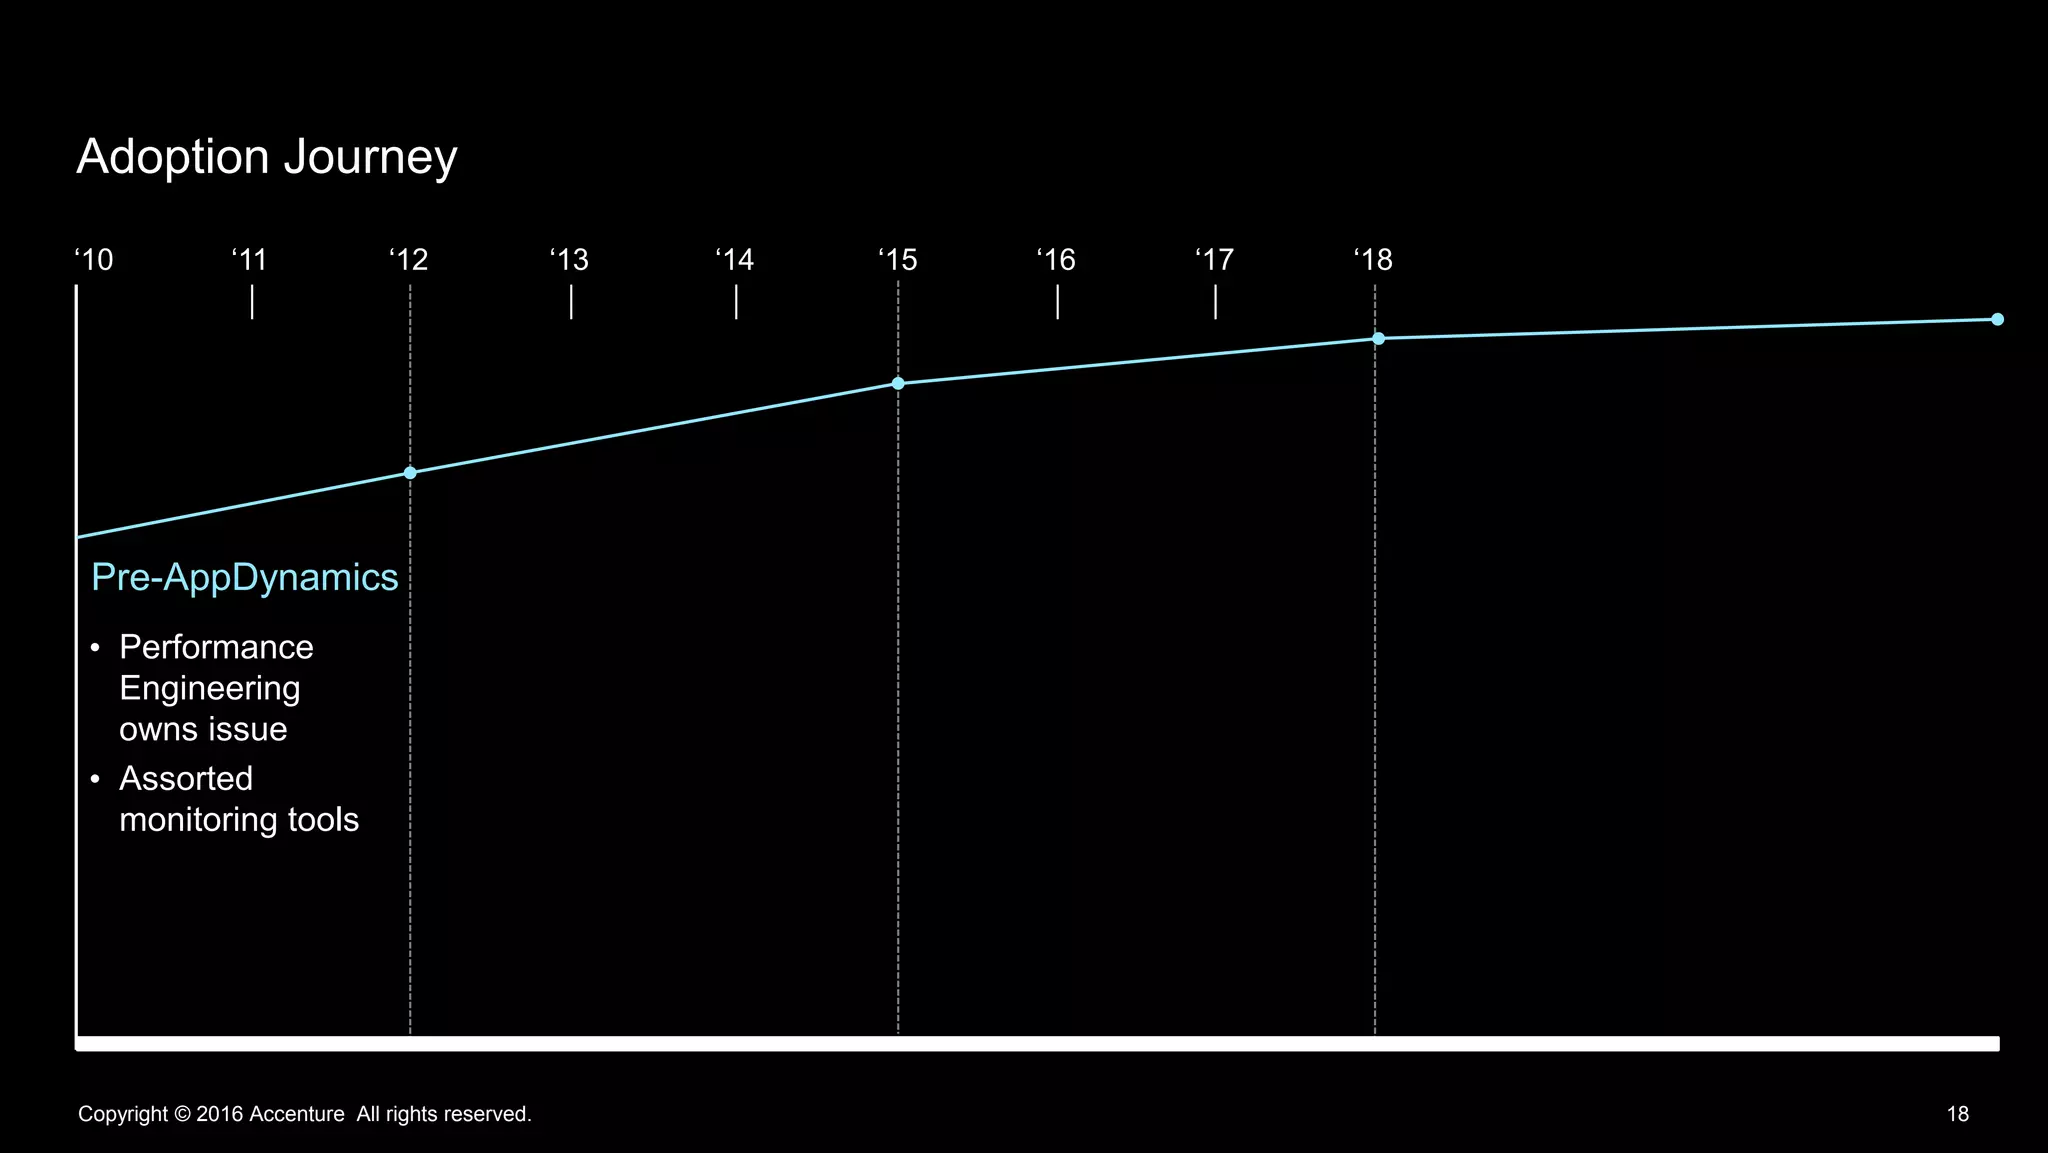
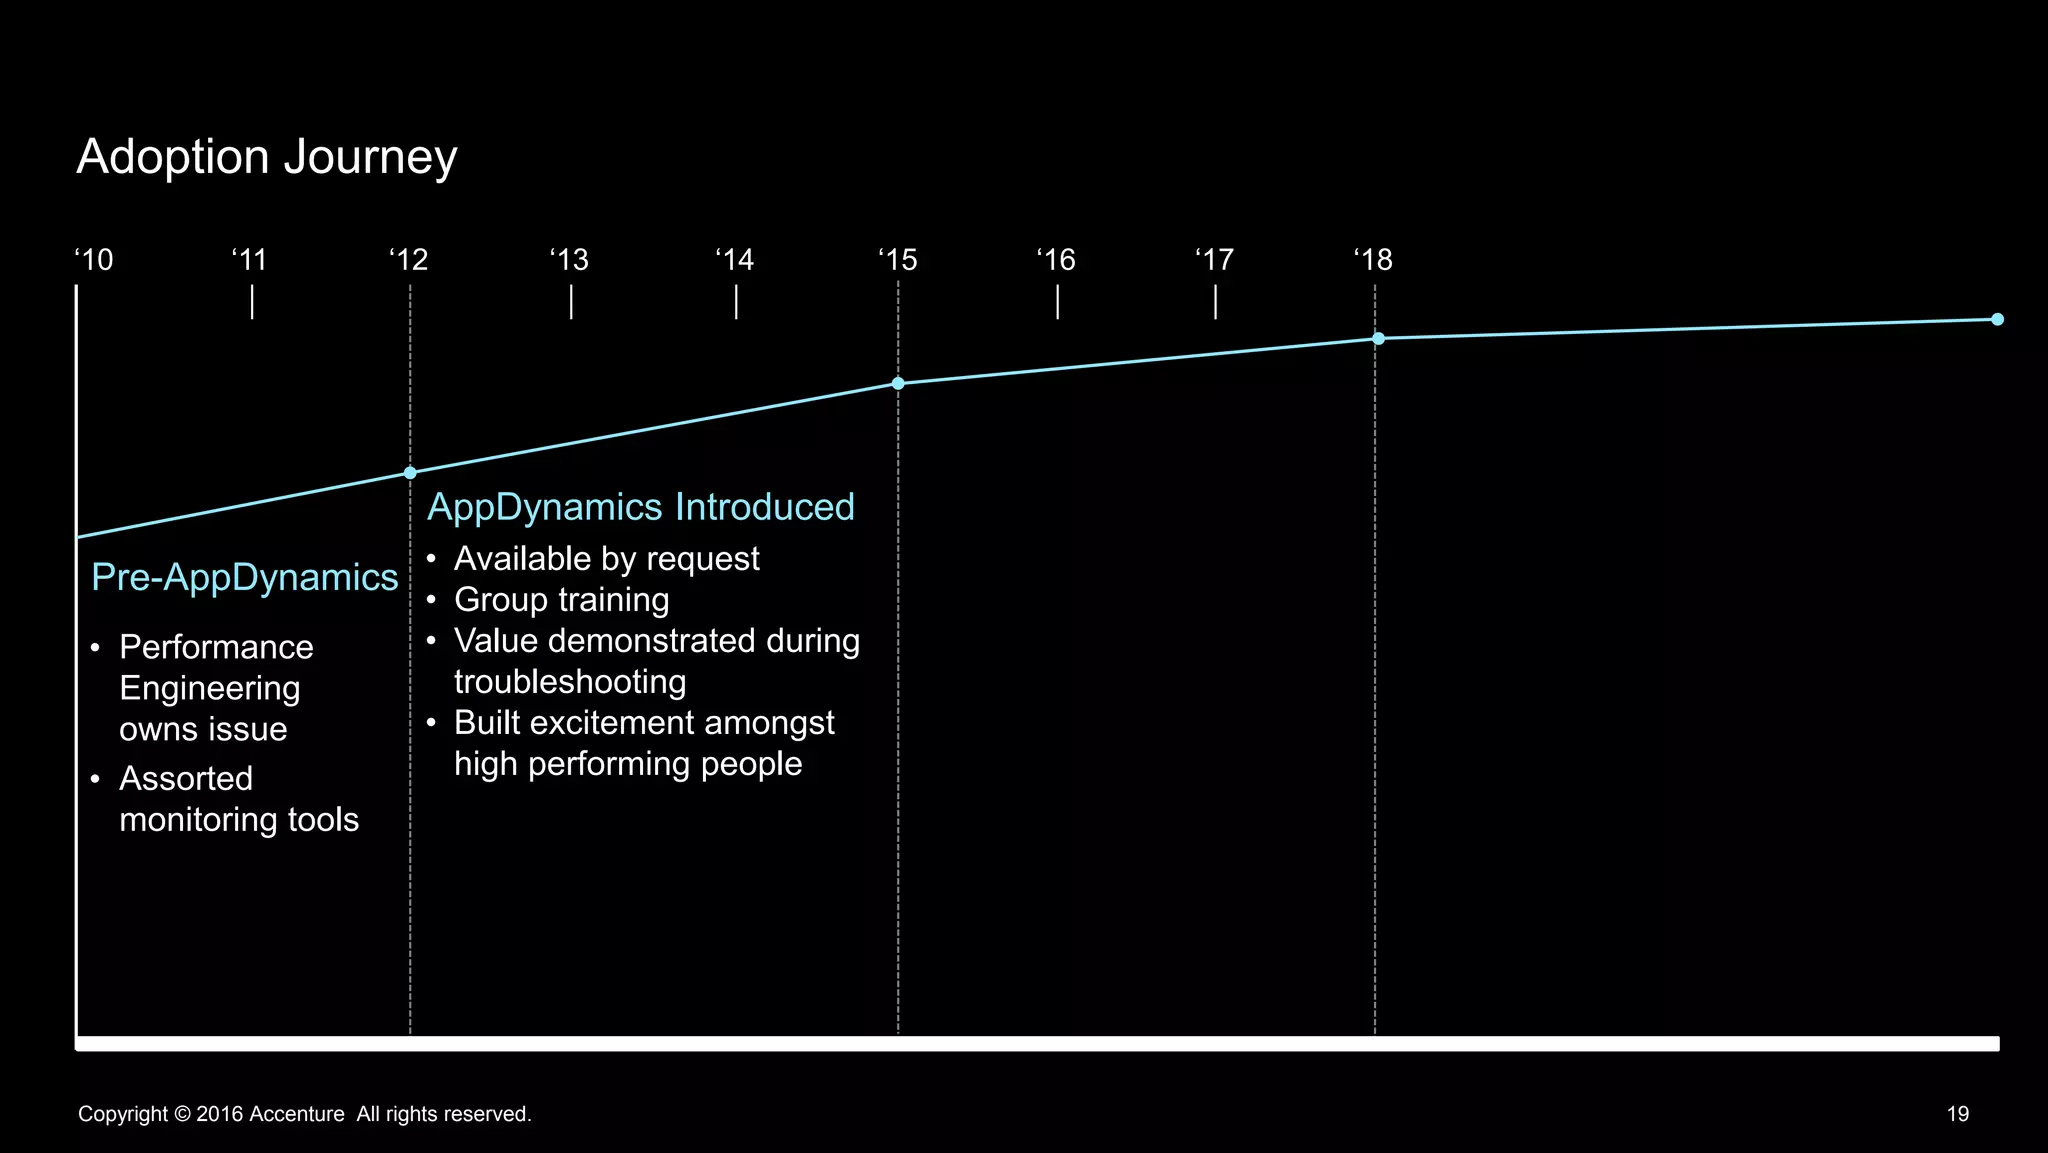
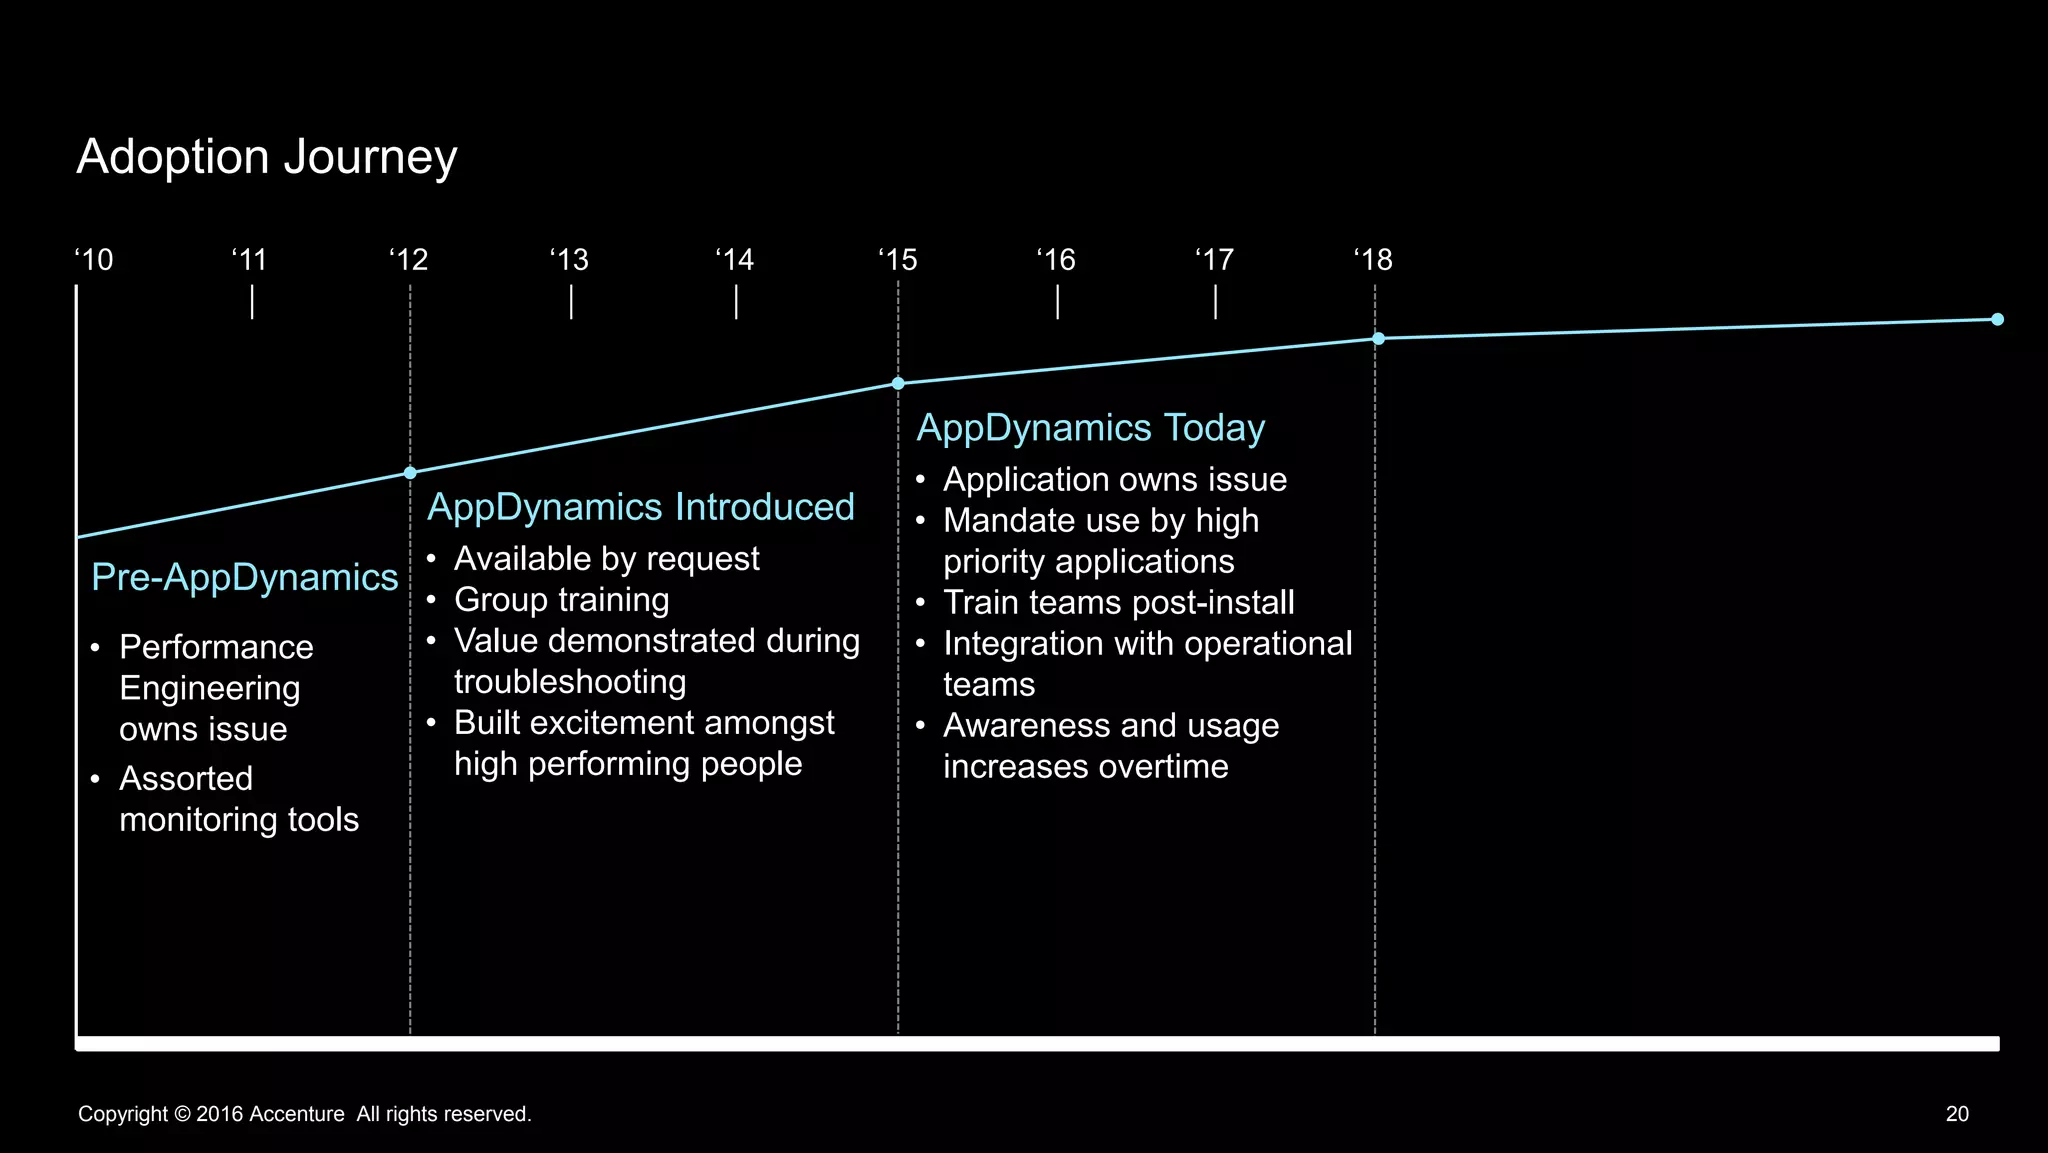
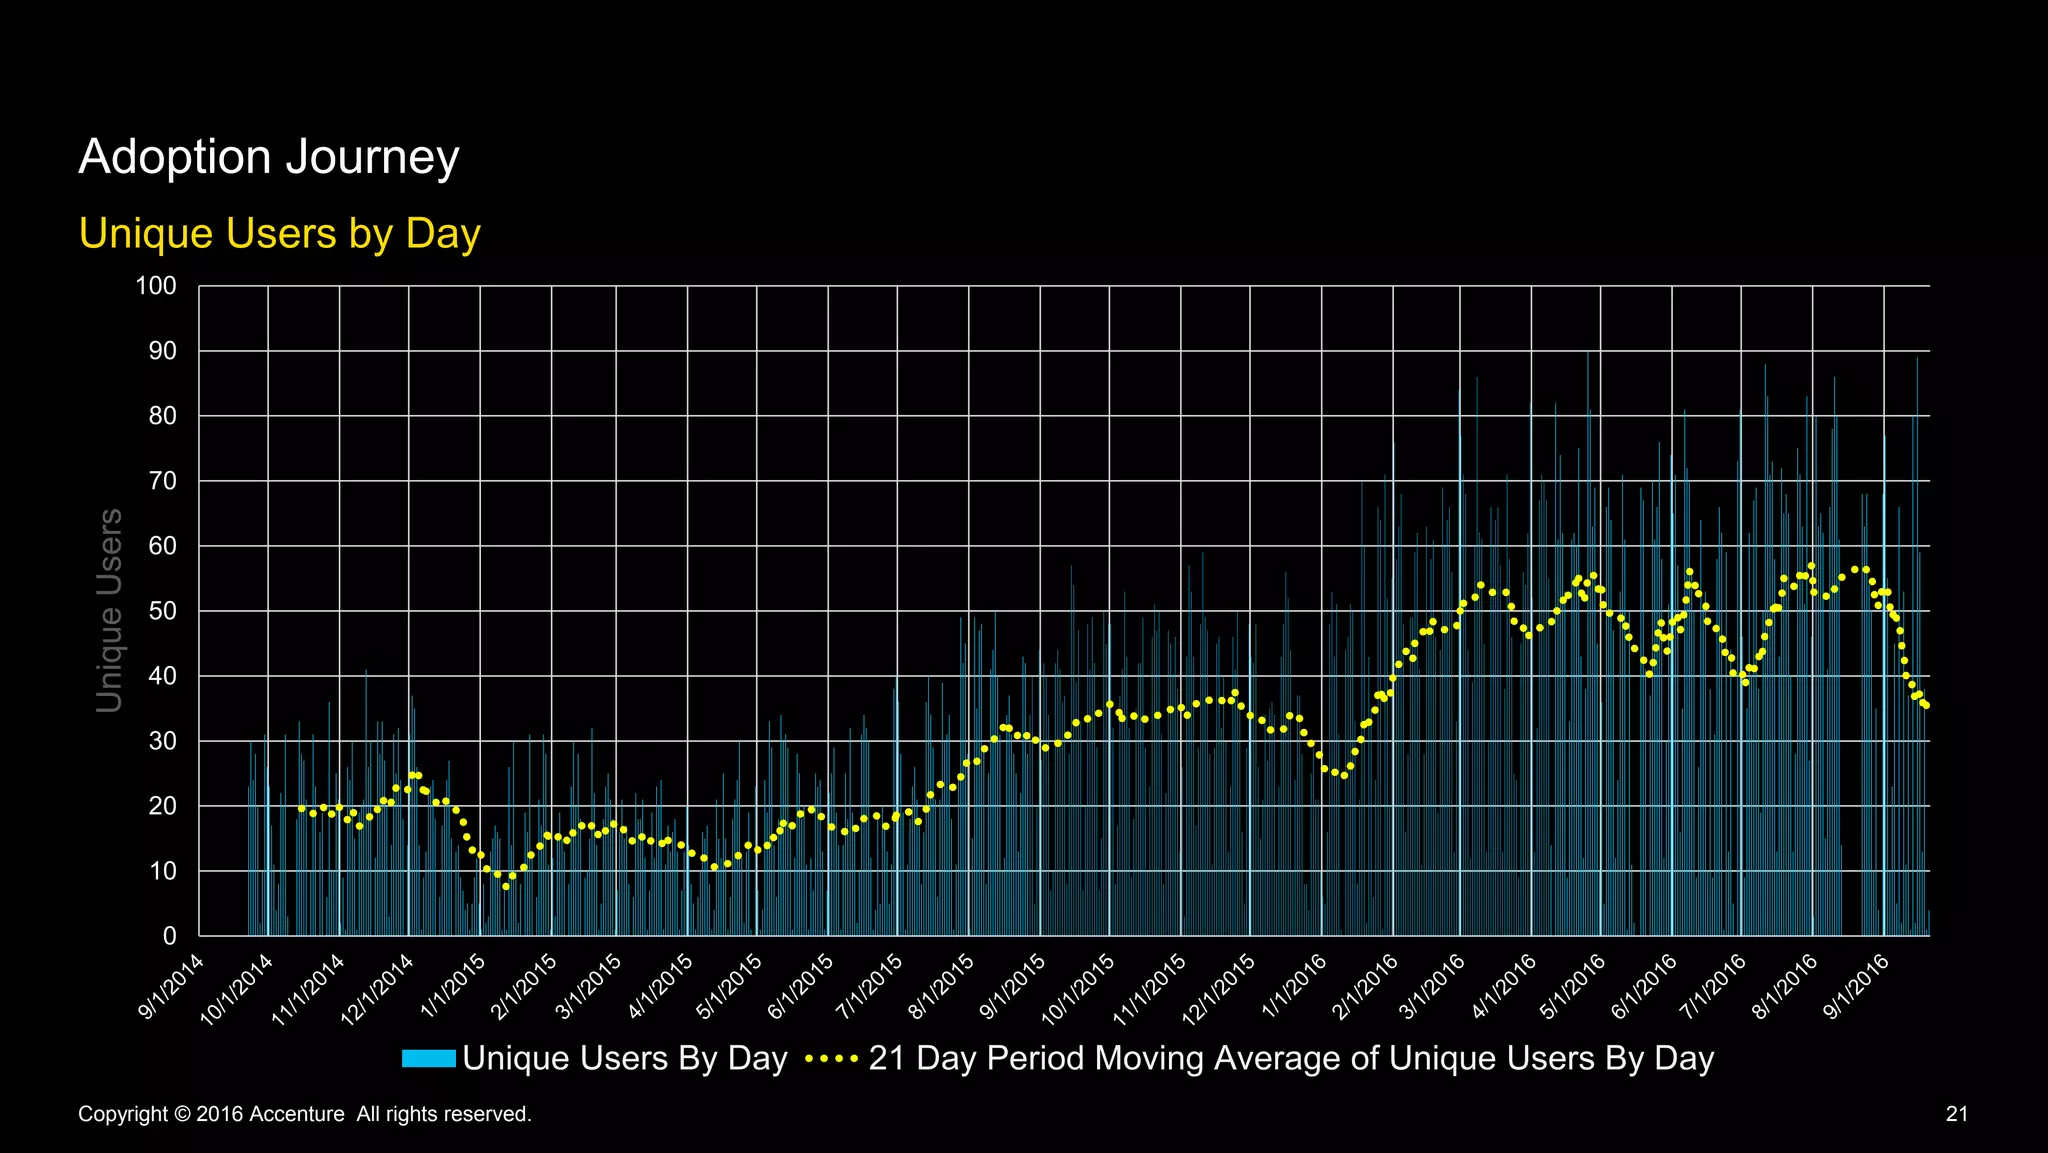
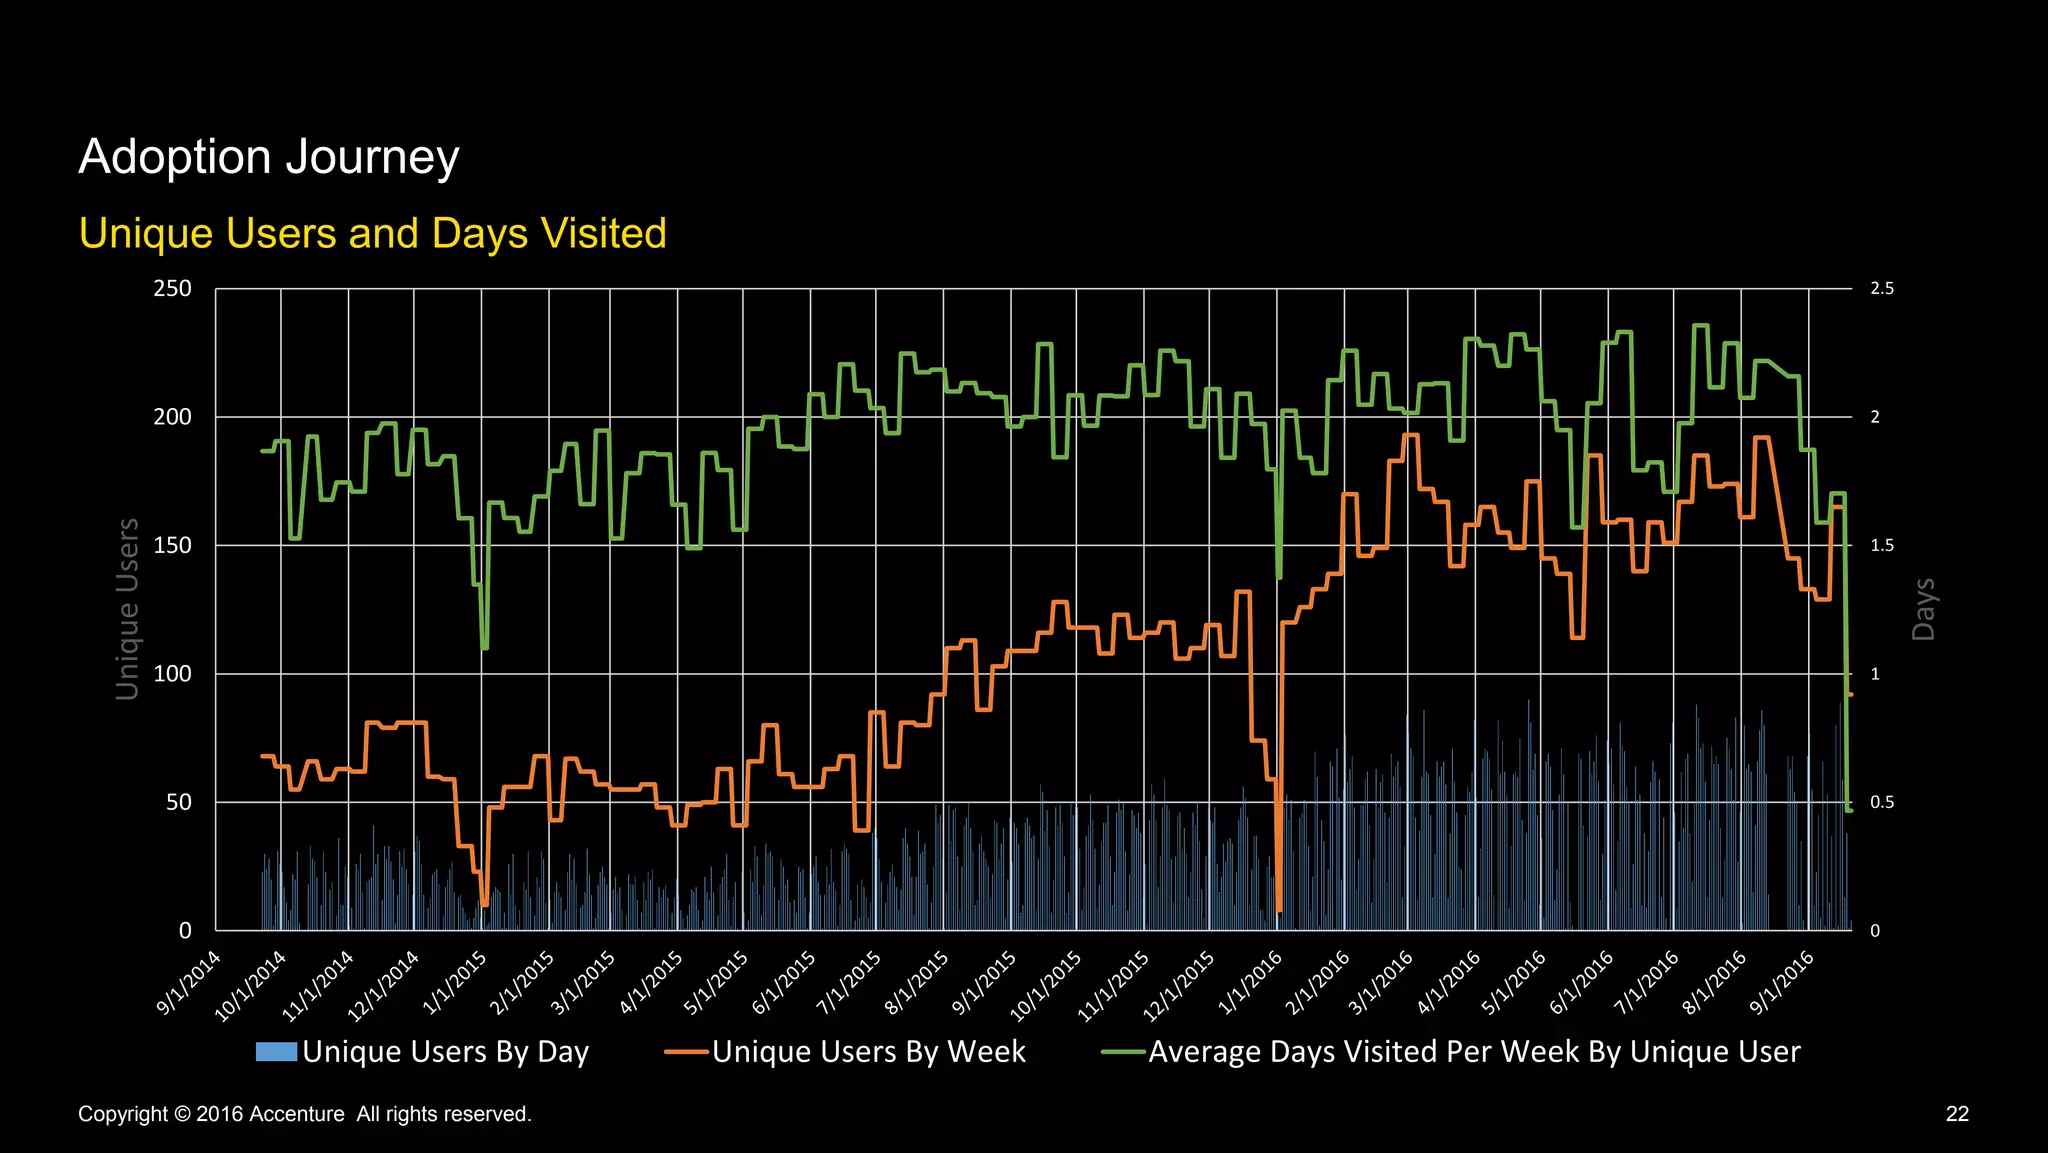
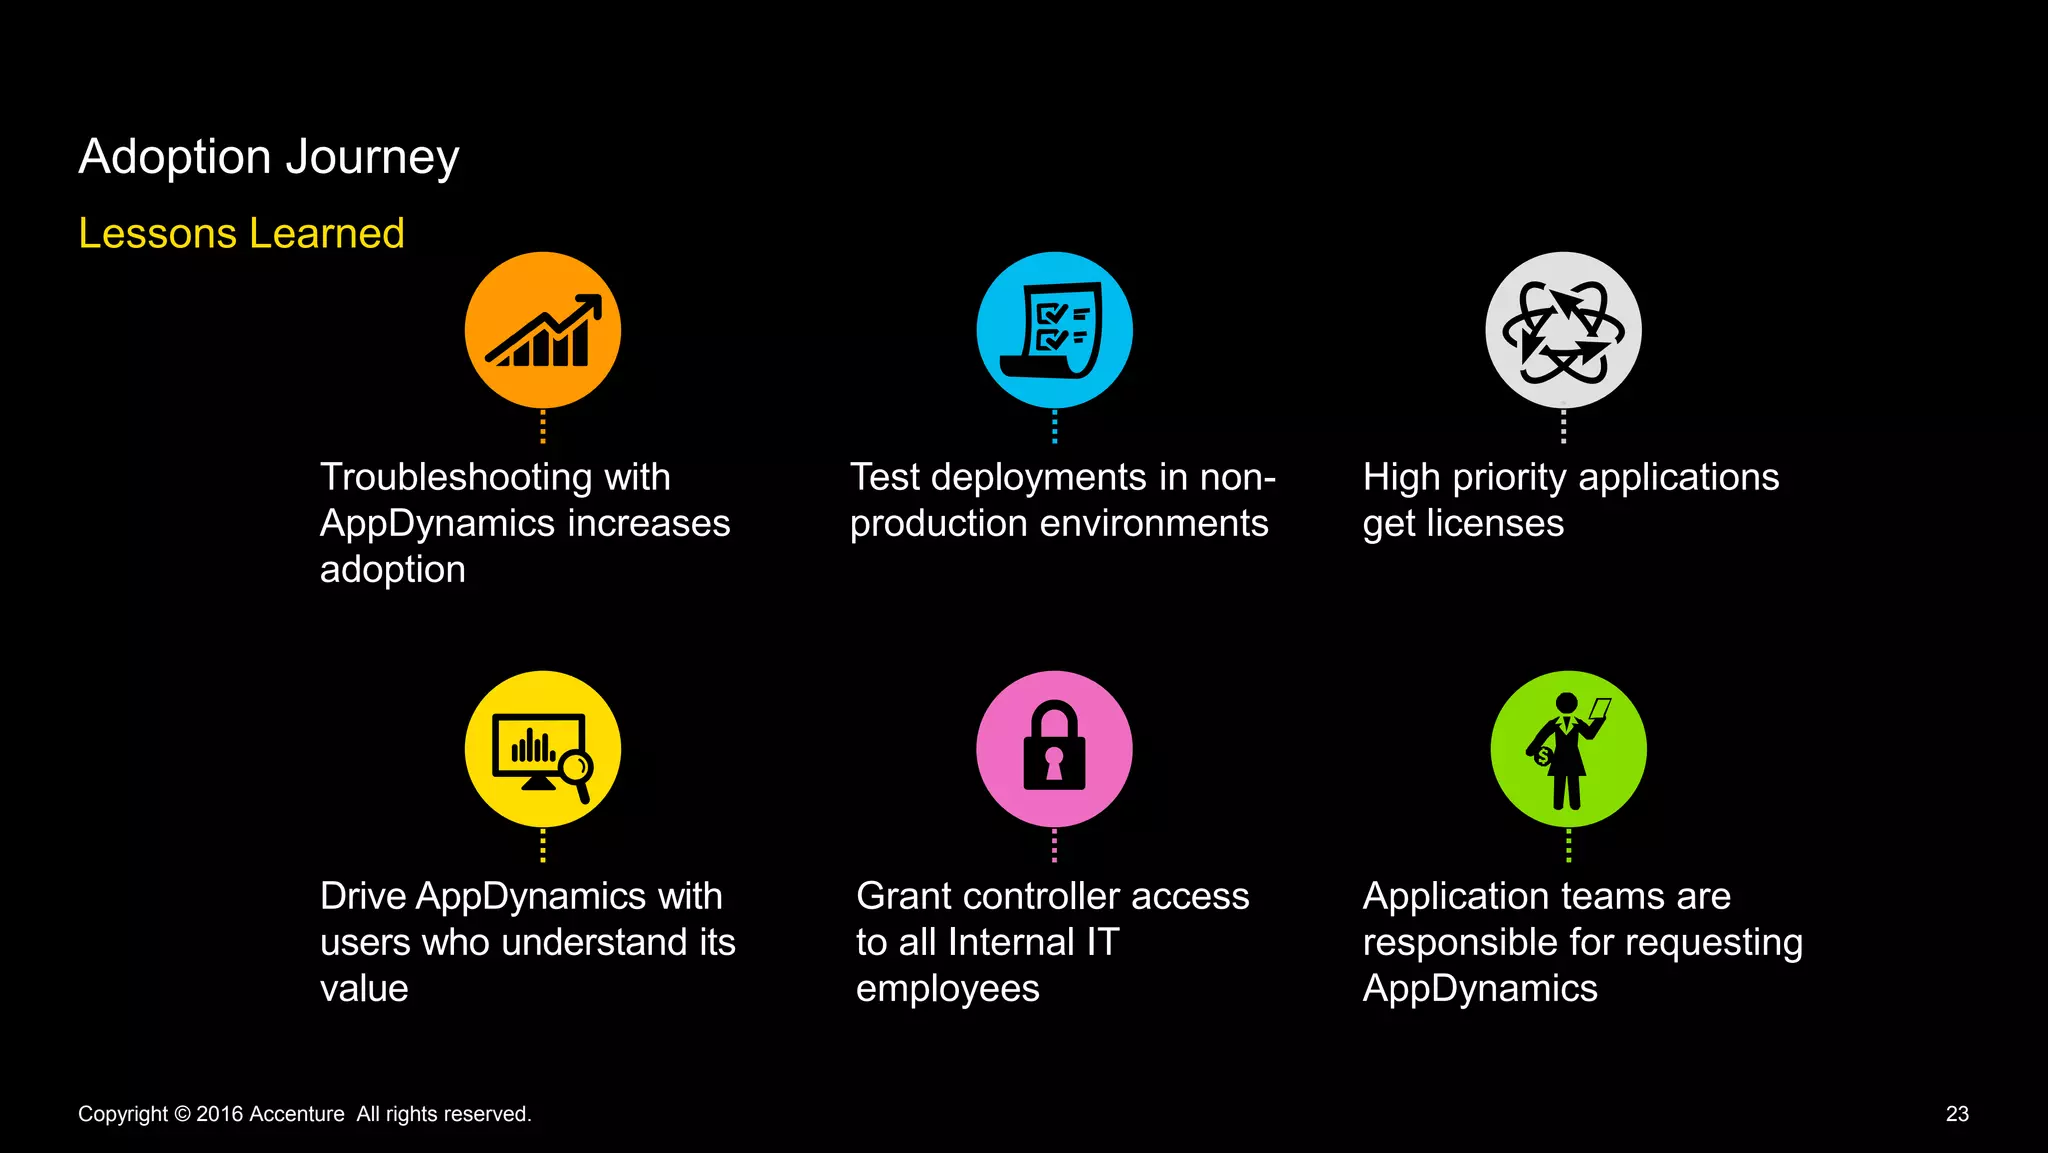
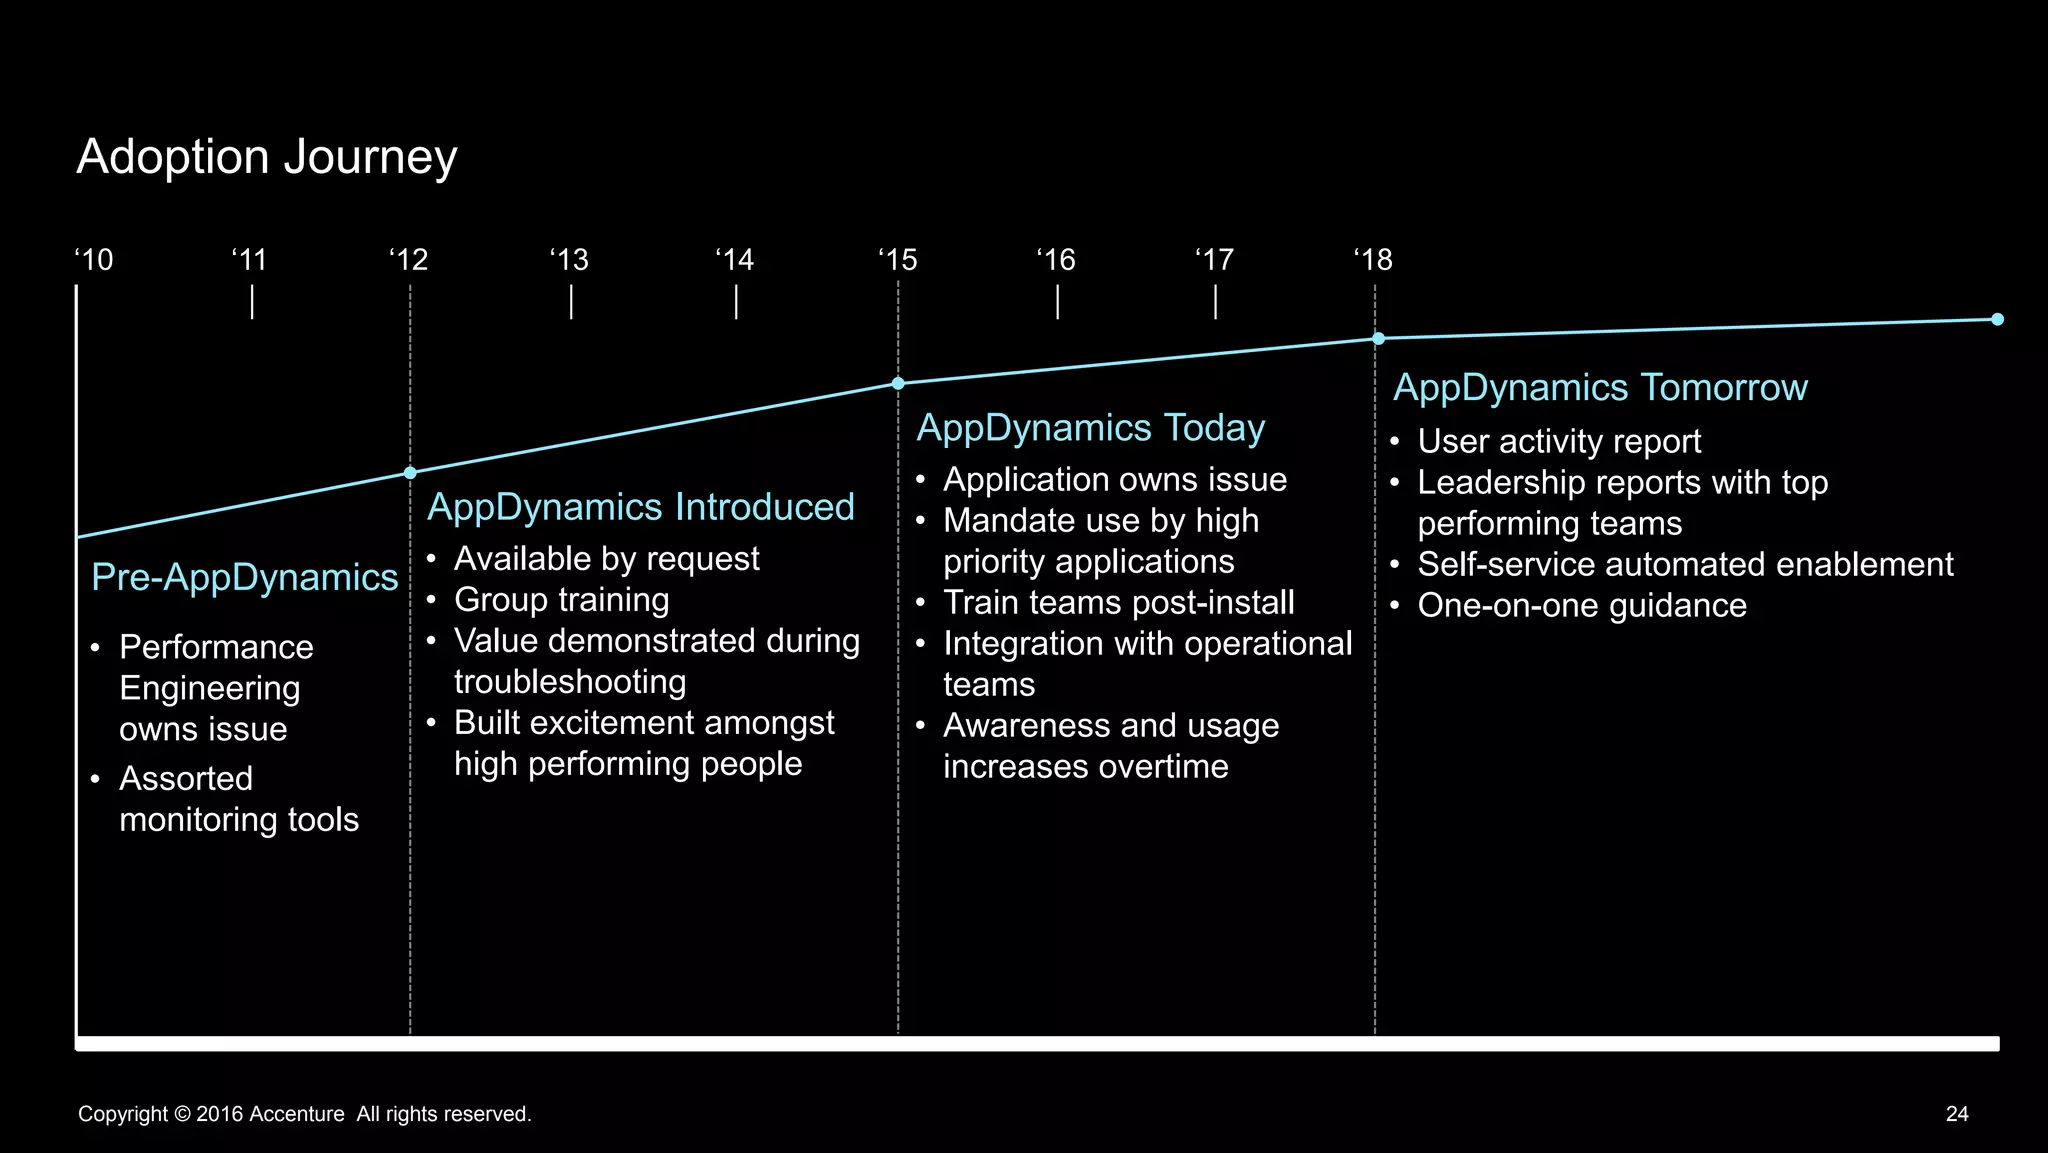
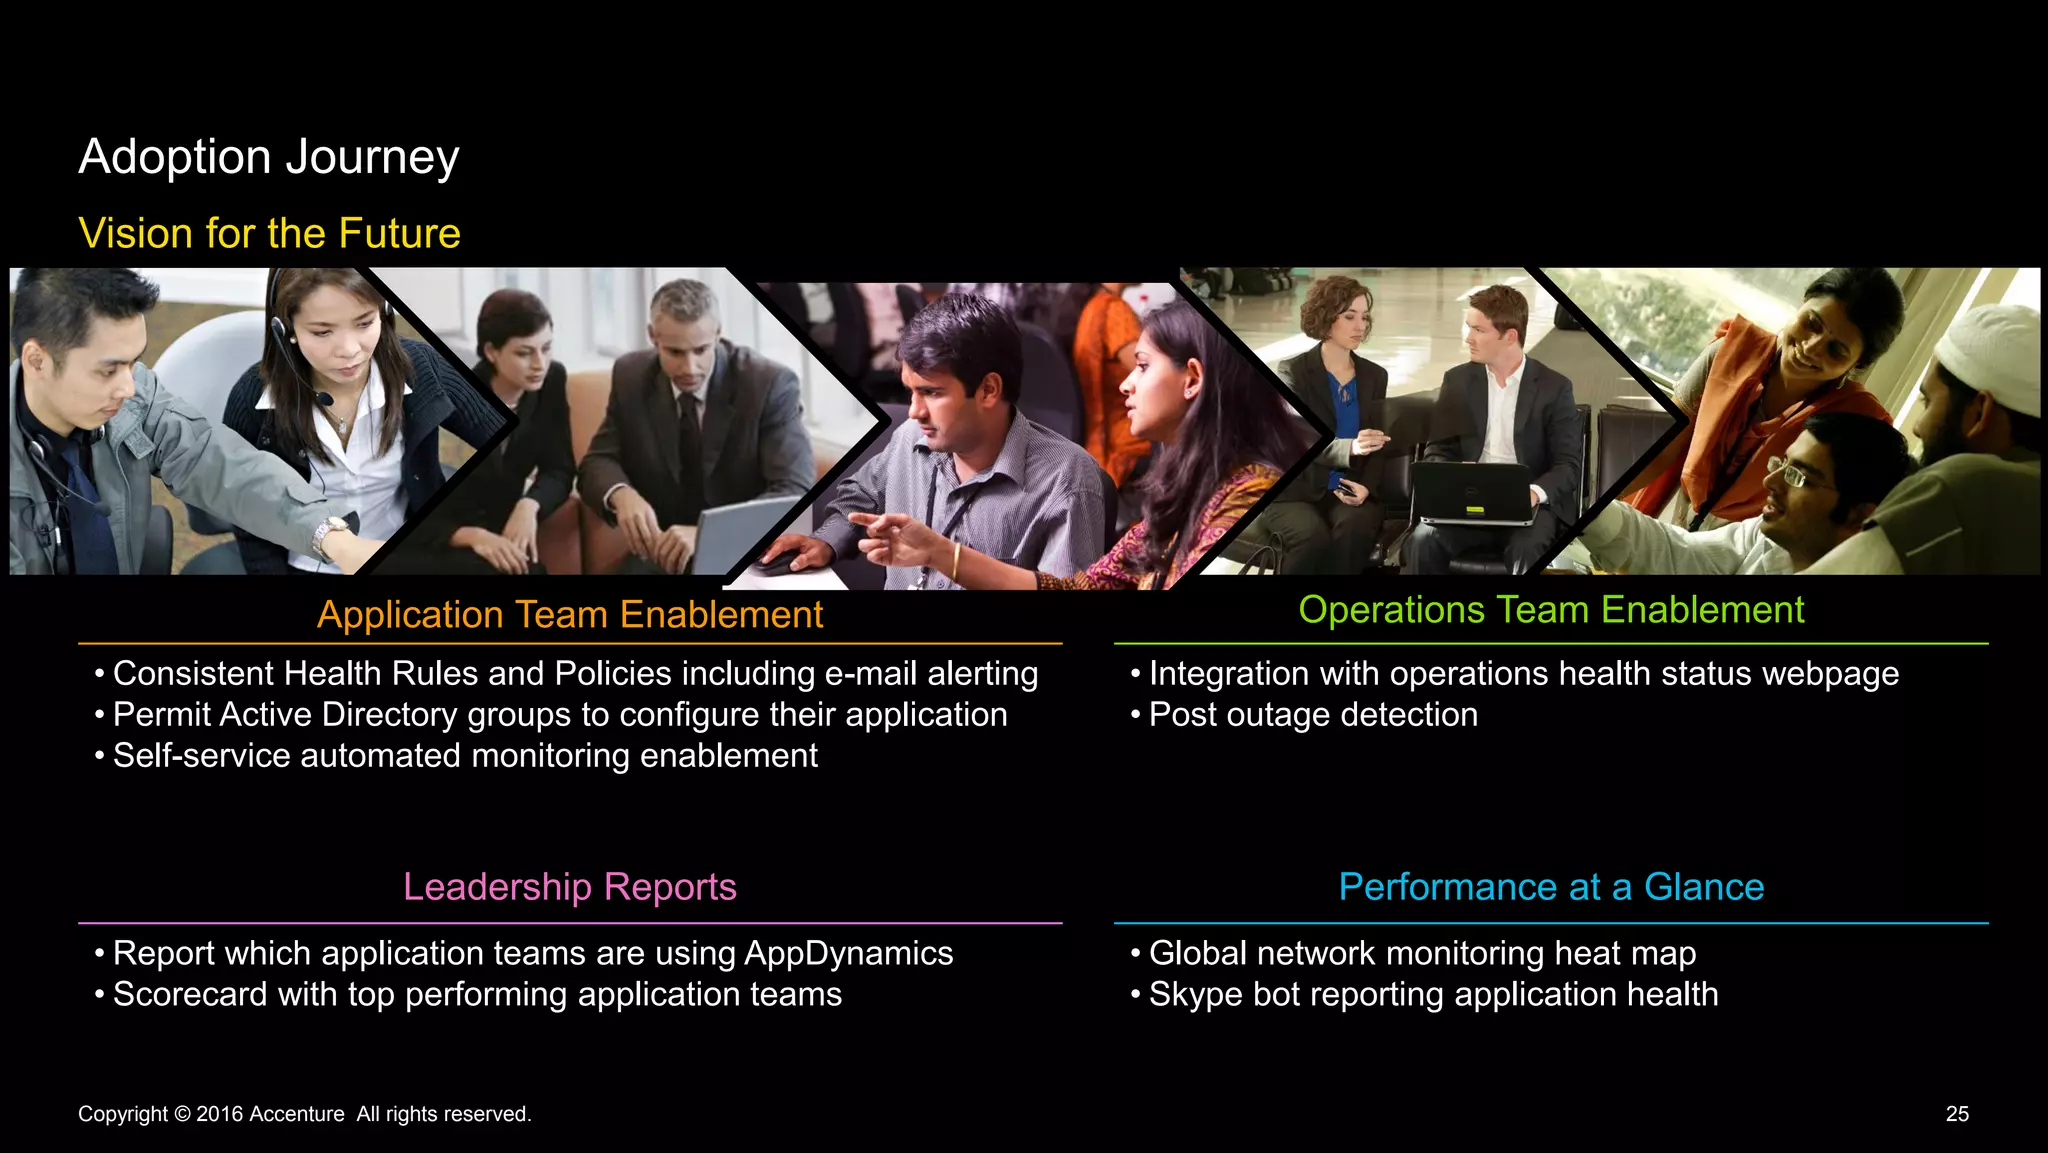
How Accenture's IT organization drives
performance monitoring globally
Erin Rakickas
Stefanija Puača
Erin Rakickas
Stefanija Puača
Delivering High Performing
Enterprise Applications
3
Accenture Today
Copyright © 2016 Accenture All rights reserved.
Locations of Accenture offices
Employees
384,000
4,000 Clients in
120+ Countries
Revenues
US$32.9
Billion
200 Cities
55 Countries
3Copyright © 2016 Accenture All rights reserved.
4
Quick Facts About Accenture Internal IT
Copyright © 2016 Accenture All rights reserved.
Hardware
& networks Collaboration Applications Support
384,000
workstations deployed
96,000
smartphones/tablets
8,000 network
infrastructure
devices monitored
4,000 servers managed in
Accenture’s private cloud
6,000 operating system
instances in the public
cloud
98 gigabit network
405,000 e-mail accounts
13,000 SharePoint sites
222,000,000 Skype for
Business audio minutes/
month
8,000,000 Skype for
Business video minutes/
month
369,000 OneDrive for
Business enabled users
200 broadcasts
produced/month
341 global applications
335 local applications
supported
Single instance ERP on
SAP HANA
1,500,000
resolved incidents/year
1,800,000
self-service contacts
5
Ecosystem
Scope
161
Applications
337
Environments
1,333 Servers
2,683 Tiers
8,212 Nodes
Monitored by AppDynamics
Copyright © 2016 Accenture All rights reserved.
676 Internal IT Applications
150 Estimated New this Year
Internal IT Applications
17% High Priority
6Copyright © 2016 Accenture All rights reserved.
Copyright © 2016 Accenture All rights reserved. 7
Delivering High Performing Enterprise Applications
Performance Management
Customization
Deployment Automation
Adoption Journey
8Copyright © 2016 Accenture All rights reserved.
Performance
Management
Monitored Technologies
Performance Mangement
Copyright © 2016 Accenture All rights reserved. 9
Elasticsearch
Octopus Deploy
Java
Microsoft
ADFS
Microsoft
.NET
Microsoft
SharePoint
Amazon
CloudWatch
Web Servers
Database
Servers
Domain Services
Open Web Interface
for .NET
Node.js
Service Catalog
Performance Management
Copyright © 2016 Accenture All rights reserved. 10
AppDynamics
Application
Intelligence
Platform
Application
Performance
Management
Browser
Real-User
Monitoring
Server
Monitoring
Synthetics
Database
Monitoring
β
ββ
Changing the Approach
Performance Management
Copyright © 2016 Accenture All rights reserved. 11
Collaborative
Flexible
Tools
Automation
Relevant
Interactive
Relevance
Global
Individually troubleshooting issue Troubleshooting as a team from developers to managers
Assessing Application Dashboard key performance metrics
Monitoring your application on-the-go on any device
Viewing performance metrics on a daily basis
Recording response time for top ten Business Transactions
Deploying agents to hundreds of servers at a time
Identifying issues using AppDynamics before users notice
Standing by for potential issue post-deployment
Waiting for end user to report issue
Installing agents on one server at a time
Recording response time with Performance Monitor
Waiting for e-mail alerts about performance issues
Monitoring CPU, memory and disk metrics
Supporting an application Supporting global users with Real-User Monitoring
From To
Identifying issues using AppDynamics before users notice
12Copyright © 2016 Accenture All rights reserved.
Deployment
Automation
Onboarding Process
Sign Up
Business Case
Submission
Server
Questionnaire
Submission
Customization
Requests
Install
Pre-Production
Install
Smoke Test
Application
Production Install
Optimize Customization
Train Application
Team
Upgrade
Semi-Annual
Upgrade
Scheduled
Application Team
Select Upgrade
Window
Smoke Test
Post-Upgrade
Deployment Automation
Copyright © 2016 Accenture All rights reserved. 13
Automated Deployment Benefits
Deployment Automation
Copyright © 2016 Accenture All rights reserved. 14Copyright © 2016 Accenture All rights reserved.
Automation decreased onboarding timeline
from three weeks to one week
Central agent management console with access
to all Internal IT servers across globe
Completed 98% or 882 of 900 agent upgrades
within four weekends and no downtime
Reduced chance of user error with predefined
agent configuration controller parameters
98%
15Copyright © 2016 Accenture All rights reserved.
Customization
Match Rules, Health Rules, and Dashboards
Customization
Copyright © 2016 Accenture All rights reserved. 16
Application Team
Engagement
• Identification period
• Key performance metrics
• Top transactions
Match Rule
Configuration
• First iteration configuring
rules
• Second iteration
configuring rules
• Data collector setup
Health Rules and
Dashboards
• Top tiers and transactions
• Key performance metrics
17Copyright © 2016 Accenture All rights reserved.
Adoption Journey
Copyright © 2016 Accenture All rights reserved. 18
Adoption Journey
• Performance
Engineering
owns issue
• Assorted
monitoring tools
Pre-AppDynamics
‘10 ‘11 ‘12 ‘13 ‘14 ‘15 ‘16 ‘17 ‘18
Copyright © 2016 Accenture All rights reserved. 19
Adoption Journey
• Performance
Engineering
owns issue
• Assorted
monitoring tools
• Available by request
• Group training
• Value demonstrated during
troubleshooting
• Built excitement amongst
high performing people
Pre-AppDynamics
AppDynamics Introduced
‘10 ‘11 ‘12 ‘13 ‘14 ‘15 ‘16 ‘17 ‘18
Copyright © 2016 Accenture All rights reserved. 20
Adoption Journey
• Performance
Engineering
owns issue
• Assorted
monitoring tools
• Available by request
• Group training
• Value demonstrated during
troubleshooting
• Built excitement amongst
high performing people
• Application owns issue
• Mandate use by high
priority applications
• Train teams post-install
• Integration with operational
teams
• Awareness and usage
increases overtime
AppDynamics Today
Pre-AppDynamics
AppDynamics Introduced
‘10 ‘11 ‘12 ‘13 ‘14 ‘15 ‘16 ‘17 ‘18
Unique Users by Day
Adoption Journey
Copyright © 2016 Accenture All rights reserved. 21
0
10
20
30
40
50
60
70
80
90
100
UniqueUsers
Unique Users By Day 21 Day Period Moving Average of Unique Users By Day
Unique Users and Days Visited
Adoption Journey
Copyright © 2016 Accenture All rights reserved. 22
0
0.5
1
1.5
2
2.5
0
50
100
150
200
250
Days
UniqueUsers
Unique Users By Day Unique Users By Week Average Days Visited Per Week By Unique User
Lessons Learned
Adoption Journey
Copyright © 2016 Accenture All rights reserved. 23
Troubleshooting with
AppDynamics increases
adoption
Test deployments in non-
production environments
High priority applications
get licenses
Drive AppDynamics with
users who understand its
value
Grant controller access
to all Internal IT
employees
Application teams are
responsible for requesting
AppDynamics
Copyright © 2016 Accenture All rights reserved. 24
Adoption Journey
• Performance
Engineering
owns issue
• Assorted
monitoring tools
• Available by request
• Group training
• Value demonstrated during
troubleshooting
• Built excitement amongst
high performing people
• Application owns issue
• Mandate use by high
priority applications
• Train teams post-install
• Integration with operational
teams
• Awareness and usage
increases overtime
• User activity report
• Leadership reports with top
performing teams
• Self-service automated enablement
• One-on-one guidance
AppDynamics Tomorrow
AppDynamics Today
Pre-AppDynamics
AppDynamics Introduced
‘10 ‘11 ‘12 ‘13 ‘14 ‘15 ‘16 ‘17 ‘18
Vision for the Future
Adoption Journey
Copyright © 2016 Accenture All rights reserved. 25
Application Team Enablement Operations Team Enablement
• Consistent Health Rules and Policies including e-mail alerting
• Permit Active Directory groups to configure their application
• Self-service automated monitoring enablement
• Integration with operations health status webpage
• Post outage detection
Leadership Reports Performance at a Glance
• Report which application teams are using AppDynamics
• Scorecard with top performing application teams
• Global network monitoring heat map
• Skype bot reporting application health
27Copyright © 2016 Accenture All rights reserved.
Questions
Erin Rakickas
Technical Architect,
Manager
Stefanija Puača
Technical Architect,
Specialist
Please give us your feedback—Session B5809
• Complete the online survey you'll receive via
email later today or via text at:
Text this number: 878787
Text this word: APPSPHERE
• Every time you submit a session survey, your
name will be entered in a random drawing.
We're giving away Amazon Echos
to 5 lucky winners!
• Thank you for your input
APPDYNAMICS CONFIDENTIAL AND PROPRIETARY 28
Win!
Thank you
30Copyright © 2016 Accenture All rights reserved.
Appendices
• Appendix A – Elasticsearch
• Data collection
• Health Rules
• Appendix B – Dashboards
• Standard
• Elasticsearch
• Real-User Monitoring heat map
• Appendix C – Achievements for one high-priority application
• Appendix D – Application usage of AppDynamics by senior leadership
• Appendix E – Geographic heat map by application
• Appendix F – Top-Ten Business Transaction Health by Application
• Appendix G – Application and Business Transaction Health by Application
Appendices
Copyright © 2016 Accenture All rights reserved. 31
Elasticsearch Data Collection
Appendix A
Copyright © 2016 Accenture All rights reserved. 32
Cluster Metrics Node Statistics
Metric Name Description
status
red (0), yellow (1),
green(2)
number of nodes
number of nodes in
this cluster
number of data
nodes
number of data
nodes
active primary
shards
active primary
shards
active shards active shards
relocating shards relocating shards
initializing shards initializing shards
unassigned shards unassigned shards
Metric Name Description
size of indices size of indices (MB)
num docs
number of
documents
open file descriptors
count
threads count
number of threads
used
Metric Name Description
primary size
primary size of
index (MB)
size
total size of index
(MB)
num docs
number of
documents
Indices Statistics
Elasticsearch Health Rules
Appendix A
Copyright © 2016 Accenture All rights reserved. 33
Health Rule Alert Thresholds
Last minutes of
data evaluated
Warning Critical
CPU utilization is too high >75% >90% 10
Memory utilization is too high >75% >90% 10
Drive D: disk space low - <20% 10
Cluster status change YELLOW RED 60 (warning)
1 (critical)
Unassigned shards - >0 10
If health rule violated, agent waits 15 minutes before reevaluating
Dashboard - Standard
Appendix B
Copyright © 2016 Accenture All rights reserved. 34
Dashboard - Elasticsearch
Appendix B
Copyright © 2016 Accenture All rights reserved. 35
Dashboard – Real-User Monitoring Heat Map
Appendix B
Copyright © 2016 Accenture All rights reserved. 36
Achievements for one High-Priority Application
• Alerts within 24 hour after go-live
– High memory usage
– Upward memory trends indicating potential memory leak
– Application team added memory to content delivery servers. Issue has not reoccurred and performance improved.
• Authentication Timeouts
– Enabled custom business transaction that hooked directly to the start of the authtentication code method
– AppDynamics was able to quickly confirm the team hypothisis and zero in on the root cause
– Short-term and long-term fixes in flight with third party software
Appendix C
Copyright © 2016 Accenture All rights reserved. 37
Application Usage of AppDynamics by Senior Leadership
Appendix D
Copyright © 2016 Accenture All rights reserved. 38
Geographic Performance Heat Map by Application
Appendix E
Copyright © 2016 Accenture All rights reserved. 39
End-user Location
Data Center Application United States Argentina Great Britain India Philippines China
United States Time and Expense 324 625 409 5135 464 8109
United States Payroll 232 805 599 5640 504 8585
United States Time Tracking 248 505 289 5337 599 8406
United States Project Management 320 727 327 5677 611 8211
United States Forecasting 4024 4423 4787 9824 4633 12655
United States Contract Forecasting 360 548 534 5434 611 8441
United States Source Control 1077 682 861 6296 493 9013
United States Automated Build 2042 2379 2014 7398 2700 9854
United States Risk Management 797 991 748 5717 785 8405
India Accounts Payable 455 632 501 406 539 5476
India Accounts Receivable 552 746 536 366 402 5335
India Reservation Management 873 883 849 451 643 5721
Top-Ten Business Transaction Health by Application
Appendix F
Copyright © 2016 Accenture All rights reserved. 40
Application Overall BT*1 BT2 BT3 BT4 BT5 BT6 BT7 BT8 BT9 BT10
1033_MRDR_Prod 22 69 78 12 26 10 37 1016 522 1772 117
1064_myHoldings_PRD 362 11 104 600 15 1 51 1589 1 7 1
1168_Policies_PRD 153 72 64 87 413 317 89 683 1 387 6
1182_AccentureMailer_PROD 64 32 1511 59 0 0 0 0 0 0 0
1239_RMSC_PRD 282 254 7 70 4 34 62 1 4 119 10
13_myResearch_PRD 33 29 35 23 0 0 0 0 0 0 0
1719_AccentureGroups_PRD 994 6900 461 381 959 390 72 345 241 121 591
1722_Search_PRD 176 102 50 9 107 130 59 2 906 43 276
1964_MySched_PRD 124 64 47 476 54 121 77 195 132 248 393
2107_CRT_PRD 1218 20 8 1100 5 17 2340 1474 280 1012 787
2109_ABACUSDSM_PRD 992 139 2103 112 1 368 78 1 1768 139 53
2109_AbacusDSM-PDC_PROD 1062 1088 1204 2134 709 366 1768 327 618 1232 2414
2111_ABACUSIJP_PRD 893 180 36 83 513 11 43 20 5 694 9
2111_AbacusIJP-PDC_PRD 6257 5 137 233187 7 745 2 84 41 17 20
2113_CAMS-IDC_PRD 255 878 2 10 553 131 2 66 76 77 173
2114_BPO-RM-DM_PRD 449 43 1 231 17 255 0 10 61 11144 6
2117_ABACUSCMS_PRD 1687 1 3004 230 7 285 11 23 58 973 87
2117_ABACUSCMS-PDC_PRD 493 512 630 26 38 0 9 1 35 5 36
*BT (Business Transaction)
Application and Business Transaction Health by Application
Appendix G
Copyright © 2016 Accenture All rights reserved. 41
*BT (Business Transaction)

How Accenture's IT Organization Drives Performance Monitoring Globally - AppSphere16

  • 1.
    How Accenture's ITorganization drives performance monitoring globally Erin Rakickas Stefanija Puača
  • 2.
    Erin Rakickas Stefanija Puača DeliveringHigh Performing Enterprise Applications
  • 3.
    3 Accenture Today Copyright ©2016 Accenture All rights reserved. Locations of Accenture offices Employees 384,000 4,000 Clients in 120+ Countries Revenues US$32.9 Billion 200 Cities 55 Countries 3Copyright © 2016 Accenture All rights reserved.
  • 4.
    4 Quick Facts AboutAccenture Internal IT Copyright © 2016 Accenture All rights reserved. Hardware & networks Collaboration Applications Support 384,000 workstations deployed 96,000 smartphones/tablets 8,000 network infrastructure devices monitored 4,000 servers managed in Accenture’s private cloud 6,000 operating system instances in the public cloud 98 gigabit network 405,000 e-mail accounts 13,000 SharePoint sites 222,000,000 Skype for Business audio minutes/ month 8,000,000 Skype for Business video minutes/ month 369,000 OneDrive for Business enabled users 200 broadcasts produced/month 341 global applications 335 local applications supported Single instance ERP on SAP HANA 1,500,000 resolved incidents/year 1,800,000 self-service contacts
  • 5.
    5 Ecosystem Scope 161 Applications 337 Environments 1,333 Servers 2,683 Tiers 8,212Nodes Monitored by AppDynamics Copyright © 2016 Accenture All rights reserved. 676 Internal IT Applications 150 Estimated New this Year Internal IT Applications 17% High Priority
  • 6.
    6Copyright © 2016Accenture All rights reserved.
  • 7.
    Copyright © 2016Accenture All rights reserved. 7 Delivering High Performing Enterprise Applications Performance Management Customization Deployment Automation Adoption Journey
  • 8.
    8Copyright © 2016Accenture All rights reserved. Performance Management
  • 9.
    Monitored Technologies Performance Mangement Copyright© 2016 Accenture All rights reserved. 9 Elasticsearch Octopus Deploy Java Microsoft ADFS Microsoft .NET Microsoft SharePoint Amazon CloudWatch Web Servers Database Servers Domain Services Open Web Interface for .NET Node.js
  • 10.
    Service Catalog Performance Management Copyright© 2016 Accenture All rights reserved. 10 AppDynamics Application Intelligence Platform Application Performance Management Browser Real-User Monitoring Server Monitoring Synthetics Database Monitoring β ββ
  • 11.
    Changing the Approach PerformanceManagement Copyright © 2016 Accenture All rights reserved. 11 Collaborative Flexible Tools Automation Relevant Interactive Relevance Global Individually troubleshooting issue Troubleshooting as a team from developers to managers Assessing Application Dashboard key performance metrics Monitoring your application on-the-go on any device Viewing performance metrics on a daily basis Recording response time for top ten Business Transactions Deploying agents to hundreds of servers at a time Identifying issues using AppDynamics before users notice Standing by for potential issue post-deployment Waiting for end user to report issue Installing agents on one server at a time Recording response time with Performance Monitor Waiting for e-mail alerts about performance issues Monitoring CPU, memory and disk metrics Supporting an application Supporting global users with Real-User Monitoring From To Identifying issues using AppDynamics before users notice
  • 12.
    12Copyright © 2016Accenture All rights reserved. Deployment Automation
  • 13.
    Onboarding Process Sign Up BusinessCase Submission Server Questionnaire Submission Customization Requests Install Pre-Production Install Smoke Test Application Production Install Optimize Customization Train Application Team Upgrade Semi-Annual Upgrade Scheduled Application Team Select Upgrade Window Smoke Test Post-Upgrade Deployment Automation Copyright © 2016 Accenture All rights reserved. 13
  • 14.
    Automated Deployment Benefits DeploymentAutomation Copyright © 2016 Accenture All rights reserved. 14Copyright © 2016 Accenture All rights reserved. Automation decreased onboarding timeline from three weeks to one week Central agent management console with access to all Internal IT servers across globe Completed 98% or 882 of 900 agent upgrades within four weekends and no downtime Reduced chance of user error with predefined agent configuration controller parameters 98%
  • 15.
    15Copyright © 2016Accenture All rights reserved. Customization
  • 16.
    Match Rules, HealthRules, and Dashboards Customization Copyright © 2016 Accenture All rights reserved. 16 Application Team Engagement • Identification period • Key performance metrics • Top transactions Match Rule Configuration • First iteration configuring rules • Second iteration configuring rules • Data collector setup Health Rules and Dashboards • Top tiers and transactions • Key performance metrics
  • 17.
    17Copyright © 2016Accenture All rights reserved. Adoption Journey
  • 18.
    Copyright © 2016Accenture All rights reserved. 18 Adoption Journey • Performance Engineering owns issue • Assorted monitoring tools Pre-AppDynamics ‘10 ‘11 ‘12 ‘13 ‘14 ‘15 ‘16 ‘17 ‘18
  • 19.
    Copyright © 2016Accenture All rights reserved. 19 Adoption Journey • Performance Engineering owns issue • Assorted monitoring tools • Available by request • Group training • Value demonstrated during troubleshooting • Built excitement amongst high performing people Pre-AppDynamics AppDynamics Introduced ‘10 ‘11 ‘12 ‘13 ‘14 ‘15 ‘16 ‘17 ‘18
  • 20.
    Copyright © 2016Accenture All rights reserved. 20 Adoption Journey • Performance Engineering owns issue • Assorted monitoring tools • Available by request • Group training • Value demonstrated during troubleshooting • Built excitement amongst high performing people • Application owns issue • Mandate use by high priority applications • Train teams post-install • Integration with operational teams • Awareness and usage increases overtime AppDynamics Today Pre-AppDynamics AppDynamics Introduced ‘10 ‘11 ‘12 ‘13 ‘14 ‘15 ‘16 ‘17 ‘18
  • 21.
    Unique Users byDay Adoption Journey Copyright © 2016 Accenture All rights reserved. 21 0 10 20 30 40 50 60 70 80 90 100 UniqueUsers Unique Users By Day 21 Day Period Moving Average of Unique Users By Day
  • 22.
    Unique Users andDays Visited Adoption Journey Copyright © 2016 Accenture All rights reserved. 22 0 0.5 1 1.5 2 2.5 0 50 100 150 200 250 Days UniqueUsers Unique Users By Day Unique Users By Week Average Days Visited Per Week By Unique User
  • 23.
    Lessons Learned Adoption Journey Copyright© 2016 Accenture All rights reserved. 23 Troubleshooting with AppDynamics increases adoption Test deployments in non- production environments High priority applications get licenses Drive AppDynamics with users who understand its value Grant controller access to all Internal IT employees Application teams are responsible for requesting AppDynamics
  • 24.
    Copyright © 2016Accenture All rights reserved. 24 Adoption Journey • Performance Engineering owns issue • Assorted monitoring tools • Available by request • Group training • Value demonstrated during troubleshooting • Built excitement amongst high performing people • Application owns issue • Mandate use by high priority applications • Train teams post-install • Integration with operational teams • Awareness and usage increases overtime • User activity report • Leadership reports with top performing teams • Self-service automated enablement • One-on-one guidance AppDynamics Tomorrow AppDynamics Today Pre-AppDynamics AppDynamics Introduced ‘10 ‘11 ‘12 ‘13 ‘14 ‘15 ‘16 ‘17 ‘18
  • 25.
    Vision for theFuture Adoption Journey Copyright © 2016 Accenture All rights reserved. 25 Application Team Enablement Operations Team Enablement • Consistent Health Rules and Policies including e-mail alerting • Permit Active Directory groups to configure their application • Self-service automated monitoring enablement • Integration with operations health status webpage • Post outage detection Leadership Reports Performance at a Glance • Report which application teams are using AppDynamics • Scorecard with top performing application teams • Global network monitoring heat map • Skype bot reporting application health
  • 27.
    27Copyright © 2016Accenture All rights reserved. Questions Erin Rakickas Technical Architect, Manager Stefanija Puača Technical Architect, Specialist
  • 28.
    Please give usyour feedback—Session B5809 • Complete the online survey you'll receive via email later today or via text at: Text this number: 878787 Text this word: APPSPHERE • Every time you submit a session survey, your name will be entered in a random drawing. We're giving away Amazon Echos to 5 lucky winners! • Thank you for your input APPDYNAMICS CONFIDENTIAL AND PROPRIETARY 28 Win!
  • 29.
  • 30.
    30Copyright © 2016Accenture All rights reserved. Appendices
  • 31.
    • Appendix A– Elasticsearch • Data collection • Health Rules • Appendix B – Dashboards • Standard • Elasticsearch • Real-User Monitoring heat map • Appendix C – Achievements for one high-priority application • Appendix D – Application usage of AppDynamics by senior leadership • Appendix E – Geographic heat map by application • Appendix F – Top-Ten Business Transaction Health by Application • Appendix G – Application and Business Transaction Health by Application Appendices Copyright © 2016 Accenture All rights reserved. 31
  • 32.
    Elasticsearch Data Collection AppendixA Copyright © 2016 Accenture All rights reserved. 32 Cluster Metrics Node Statistics Metric Name Description status red (0), yellow (1), green(2) number of nodes number of nodes in this cluster number of data nodes number of data nodes active primary shards active primary shards active shards active shards relocating shards relocating shards initializing shards initializing shards unassigned shards unassigned shards Metric Name Description size of indices size of indices (MB) num docs number of documents open file descriptors open file descriptors count threads count number of threads used Metric Name Description primary size primary size of index (MB) size total size of index (MB) num docs number of documents Indices Statistics
  • 33.
    Elasticsearch Health Rules AppendixA Copyright © 2016 Accenture All rights reserved. 33 Health Rule Alert Thresholds Last minutes of data evaluated Warning Critical CPU utilization is too high >75% >90% 10 Memory utilization is too high >75% >90% 10 Drive D: disk space low - <20% 10 Cluster status change YELLOW RED 60 (warning) 1 (critical) Unassigned shards - >0 10 If health rule violated, agent waits 15 minutes before reevaluating
  • 34.
    Dashboard - Standard AppendixB Copyright © 2016 Accenture All rights reserved. 34
  • 35.
    Dashboard - Elasticsearch AppendixB Copyright © 2016 Accenture All rights reserved. 35
  • 36.
    Dashboard – Real-UserMonitoring Heat Map Appendix B Copyright © 2016 Accenture All rights reserved. 36
  • 37.
    Achievements for oneHigh-Priority Application • Alerts within 24 hour after go-live – High memory usage – Upward memory trends indicating potential memory leak – Application team added memory to content delivery servers. Issue has not reoccurred and performance improved. • Authentication Timeouts – Enabled custom business transaction that hooked directly to the start of the authtentication code method – AppDynamics was able to quickly confirm the team hypothisis and zero in on the root cause – Short-term and long-term fixes in flight with third party software Appendix C Copyright © 2016 Accenture All rights reserved. 37
  • 38.
    Application Usage ofAppDynamics by Senior Leadership Appendix D Copyright © 2016 Accenture All rights reserved. 38
  • 39.
    Geographic Performance HeatMap by Application Appendix E Copyright © 2016 Accenture All rights reserved. 39 End-user Location Data Center Application United States Argentina Great Britain India Philippines China United States Time and Expense 324 625 409 5135 464 8109 United States Payroll 232 805 599 5640 504 8585 United States Time Tracking 248 505 289 5337 599 8406 United States Project Management 320 727 327 5677 611 8211 United States Forecasting 4024 4423 4787 9824 4633 12655 United States Contract Forecasting 360 548 534 5434 611 8441 United States Source Control 1077 682 861 6296 493 9013 United States Automated Build 2042 2379 2014 7398 2700 9854 United States Risk Management 797 991 748 5717 785 8405 India Accounts Payable 455 632 501 406 539 5476 India Accounts Receivable 552 746 536 366 402 5335 India Reservation Management 873 883 849 451 643 5721
  • 40.
    Top-Ten Business TransactionHealth by Application Appendix F Copyright © 2016 Accenture All rights reserved. 40 Application Overall BT*1 BT2 BT3 BT4 BT5 BT6 BT7 BT8 BT9 BT10 1033_MRDR_Prod 22 69 78 12 26 10 37 1016 522 1772 117 1064_myHoldings_PRD 362 11 104 600 15 1 51 1589 1 7 1 1168_Policies_PRD 153 72 64 87 413 317 89 683 1 387 6 1182_AccentureMailer_PROD 64 32 1511 59 0 0 0 0 0 0 0 1239_RMSC_PRD 282 254 7 70 4 34 62 1 4 119 10 13_myResearch_PRD 33 29 35 23 0 0 0 0 0 0 0 1719_AccentureGroups_PRD 994 6900 461 381 959 390 72 345 241 121 591 1722_Search_PRD 176 102 50 9 107 130 59 2 906 43 276 1964_MySched_PRD 124 64 47 476 54 121 77 195 132 248 393 2107_CRT_PRD 1218 20 8 1100 5 17 2340 1474 280 1012 787 2109_ABACUSDSM_PRD 992 139 2103 112 1 368 78 1 1768 139 53 2109_AbacusDSM-PDC_PROD 1062 1088 1204 2134 709 366 1768 327 618 1232 2414 2111_ABACUSIJP_PRD 893 180 36 83 513 11 43 20 5 694 9 2111_AbacusIJP-PDC_PRD 6257 5 137 233187 7 745 2 84 41 17 20 2113_CAMS-IDC_PRD 255 878 2 10 553 131 2 66 76 77 173 2114_BPO-RM-DM_PRD 449 43 1 231 17 255 0 10 61 11144 6 2117_ABACUSCMS_PRD 1687 1 3004 230 7 285 11 23 58 973 87 2117_ABACUSCMS-PDC_PRD 493 512 630 26 38 0 9 1 35 5 36 *BT (Business Transaction)
  • 41.
    Application and BusinessTransaction Health by Application Appendix G Copyright © 2016 Accenture All rights reserved. 41 *BT (Business Transaction)