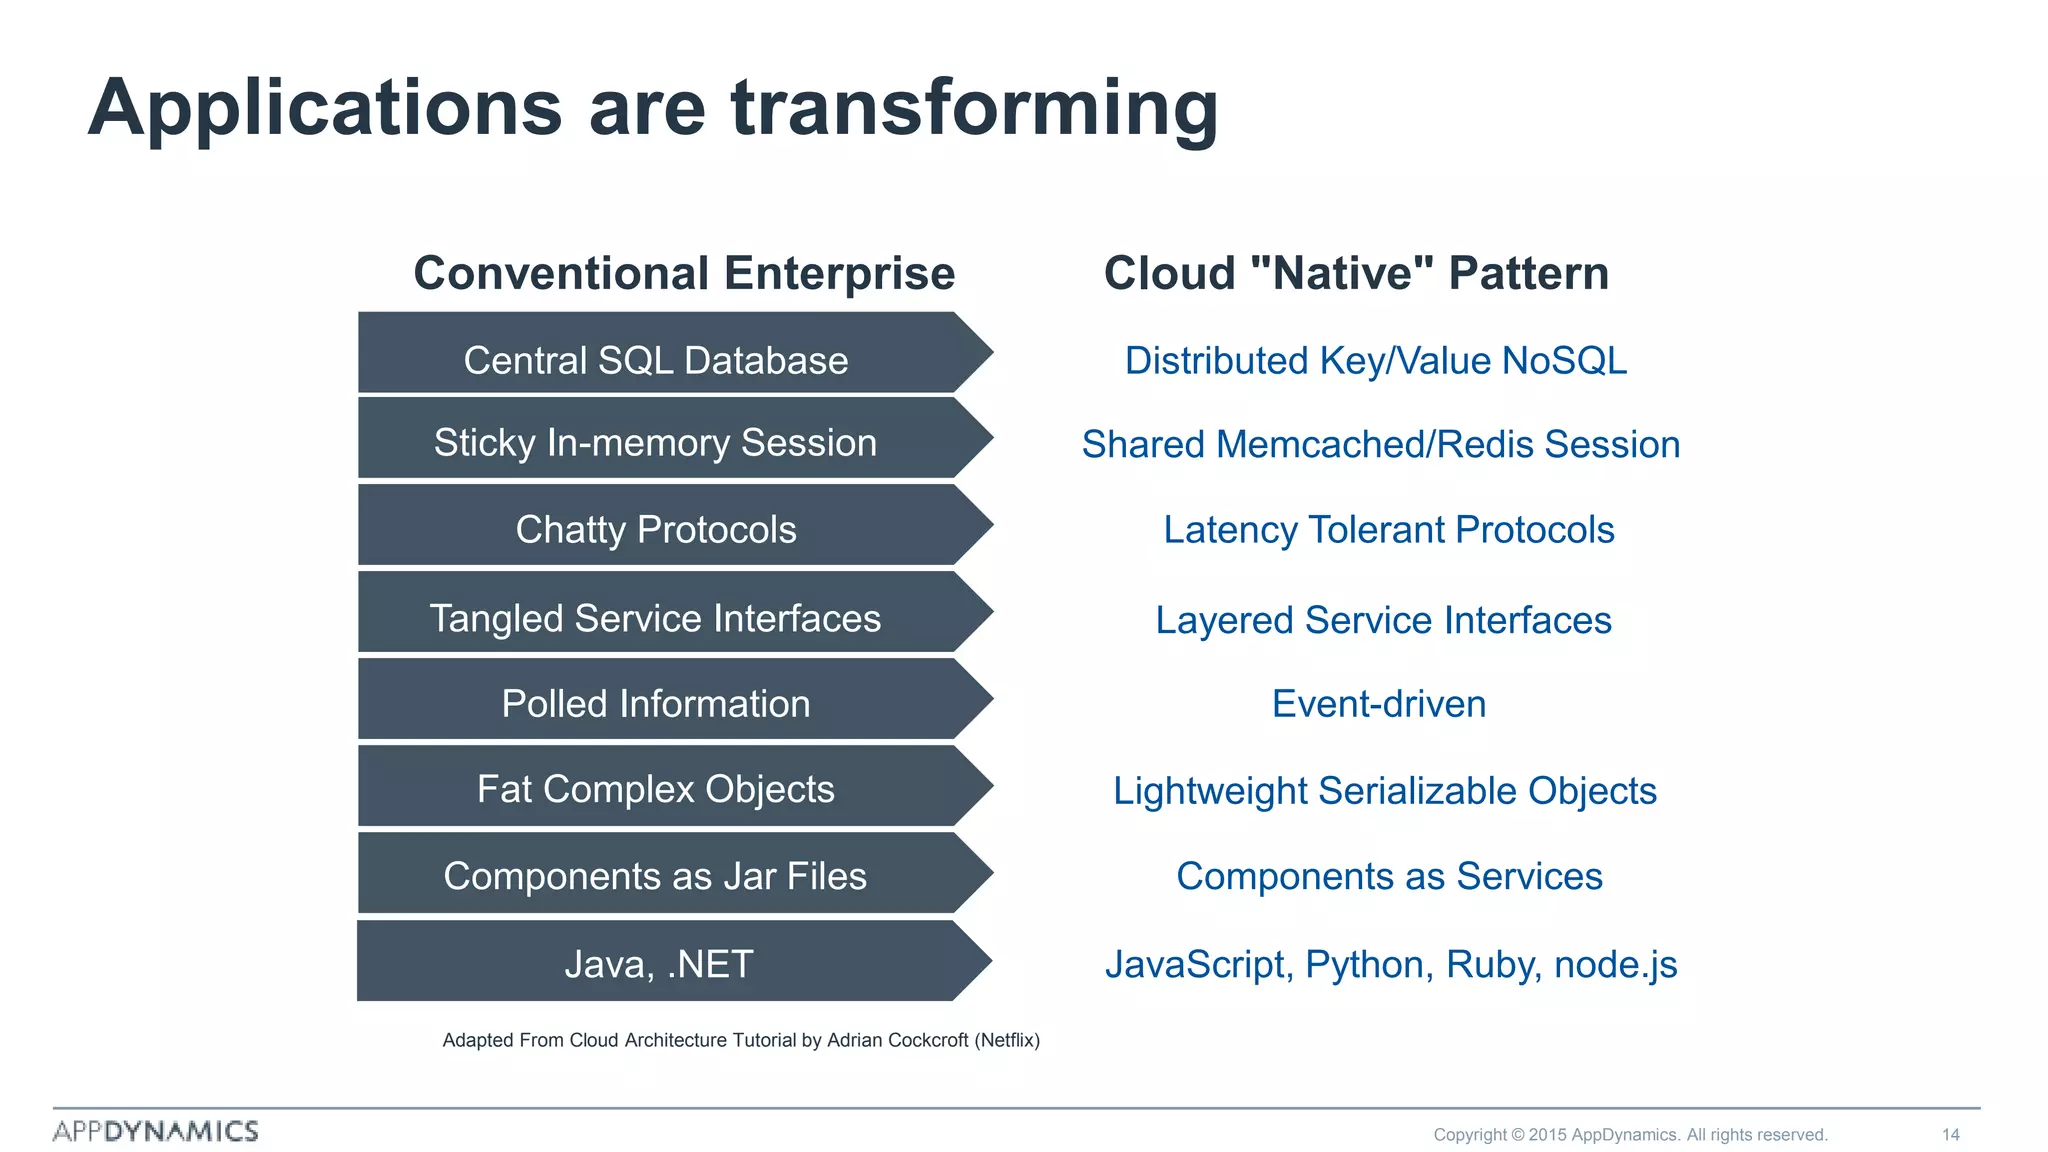
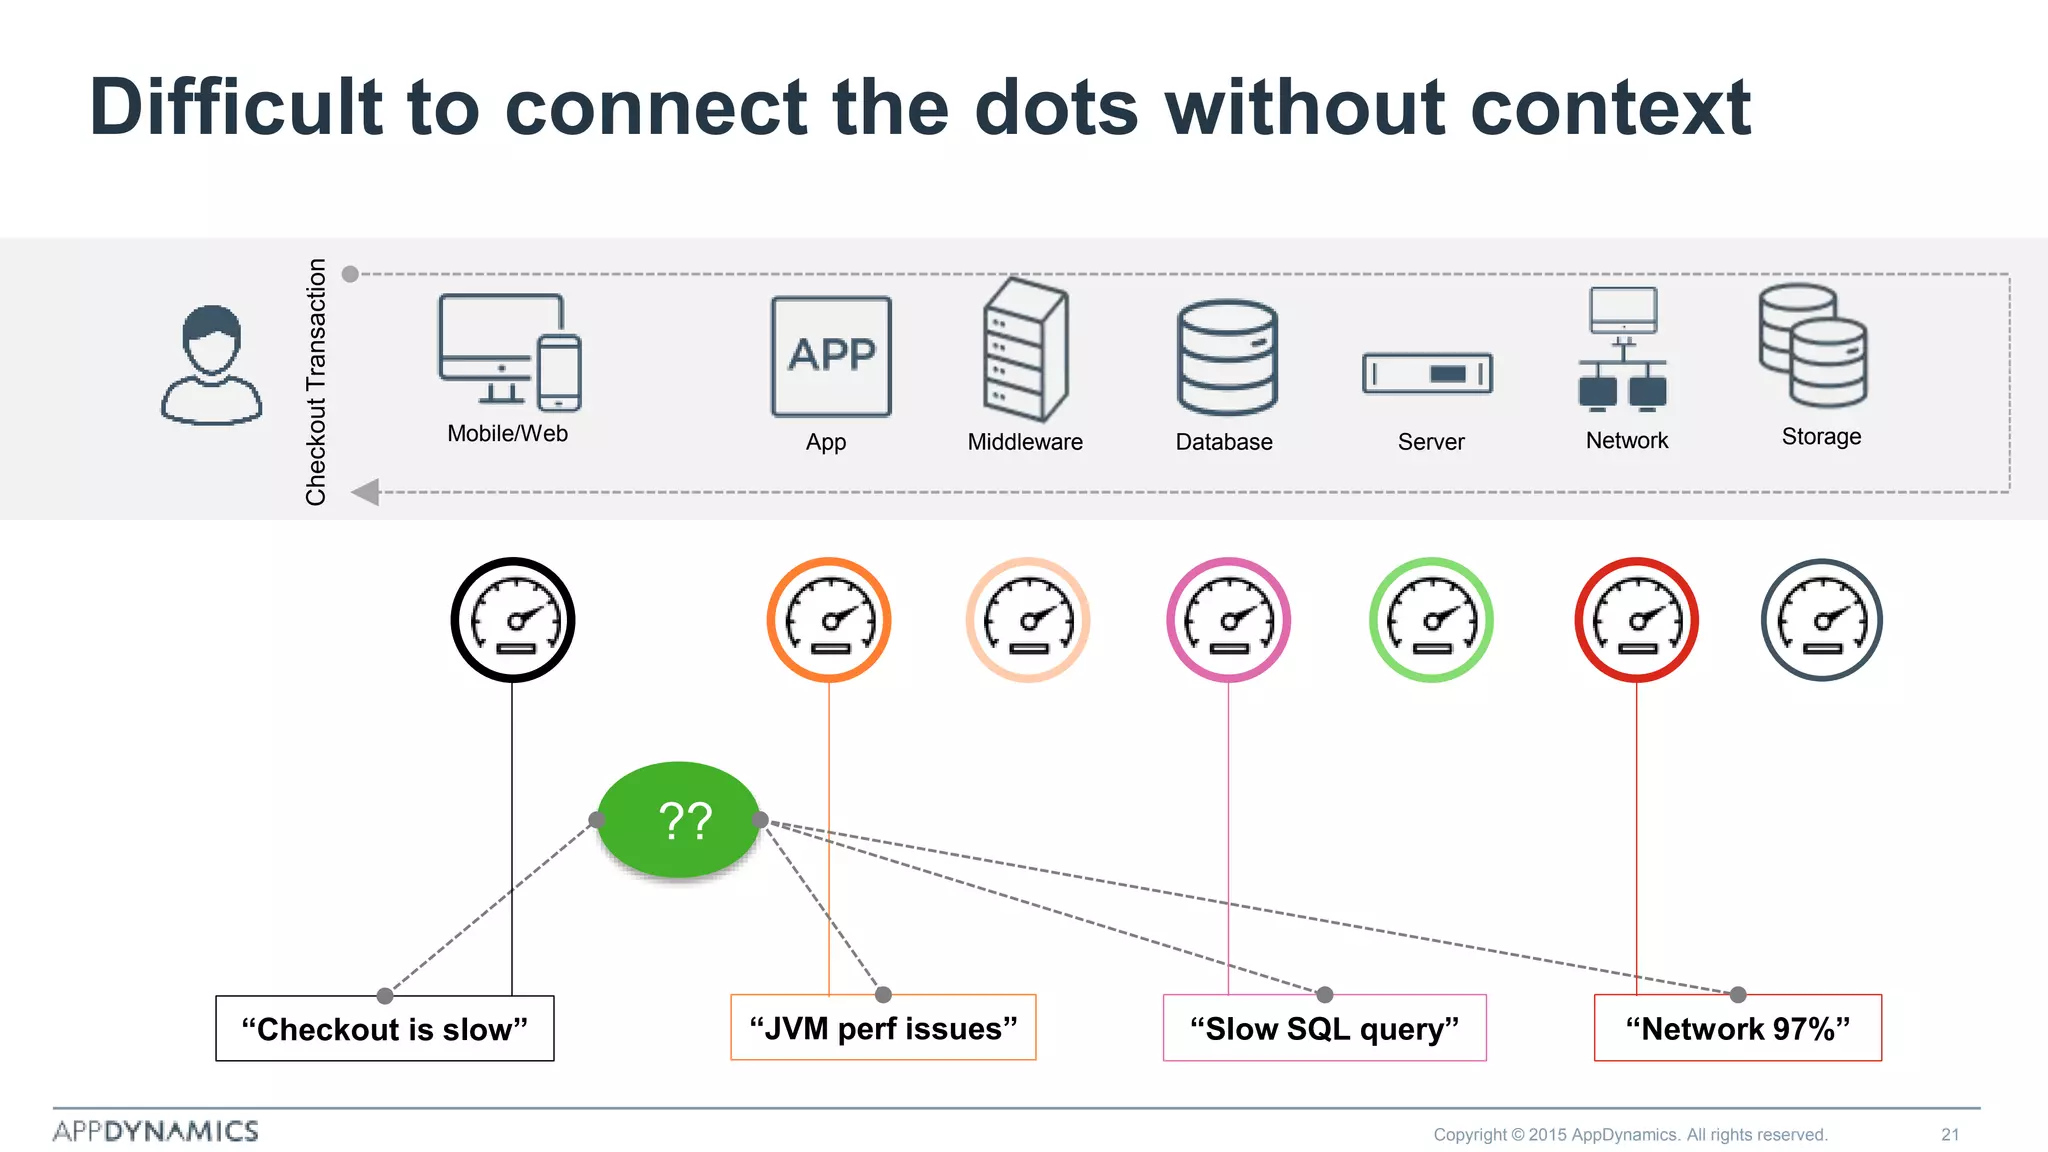
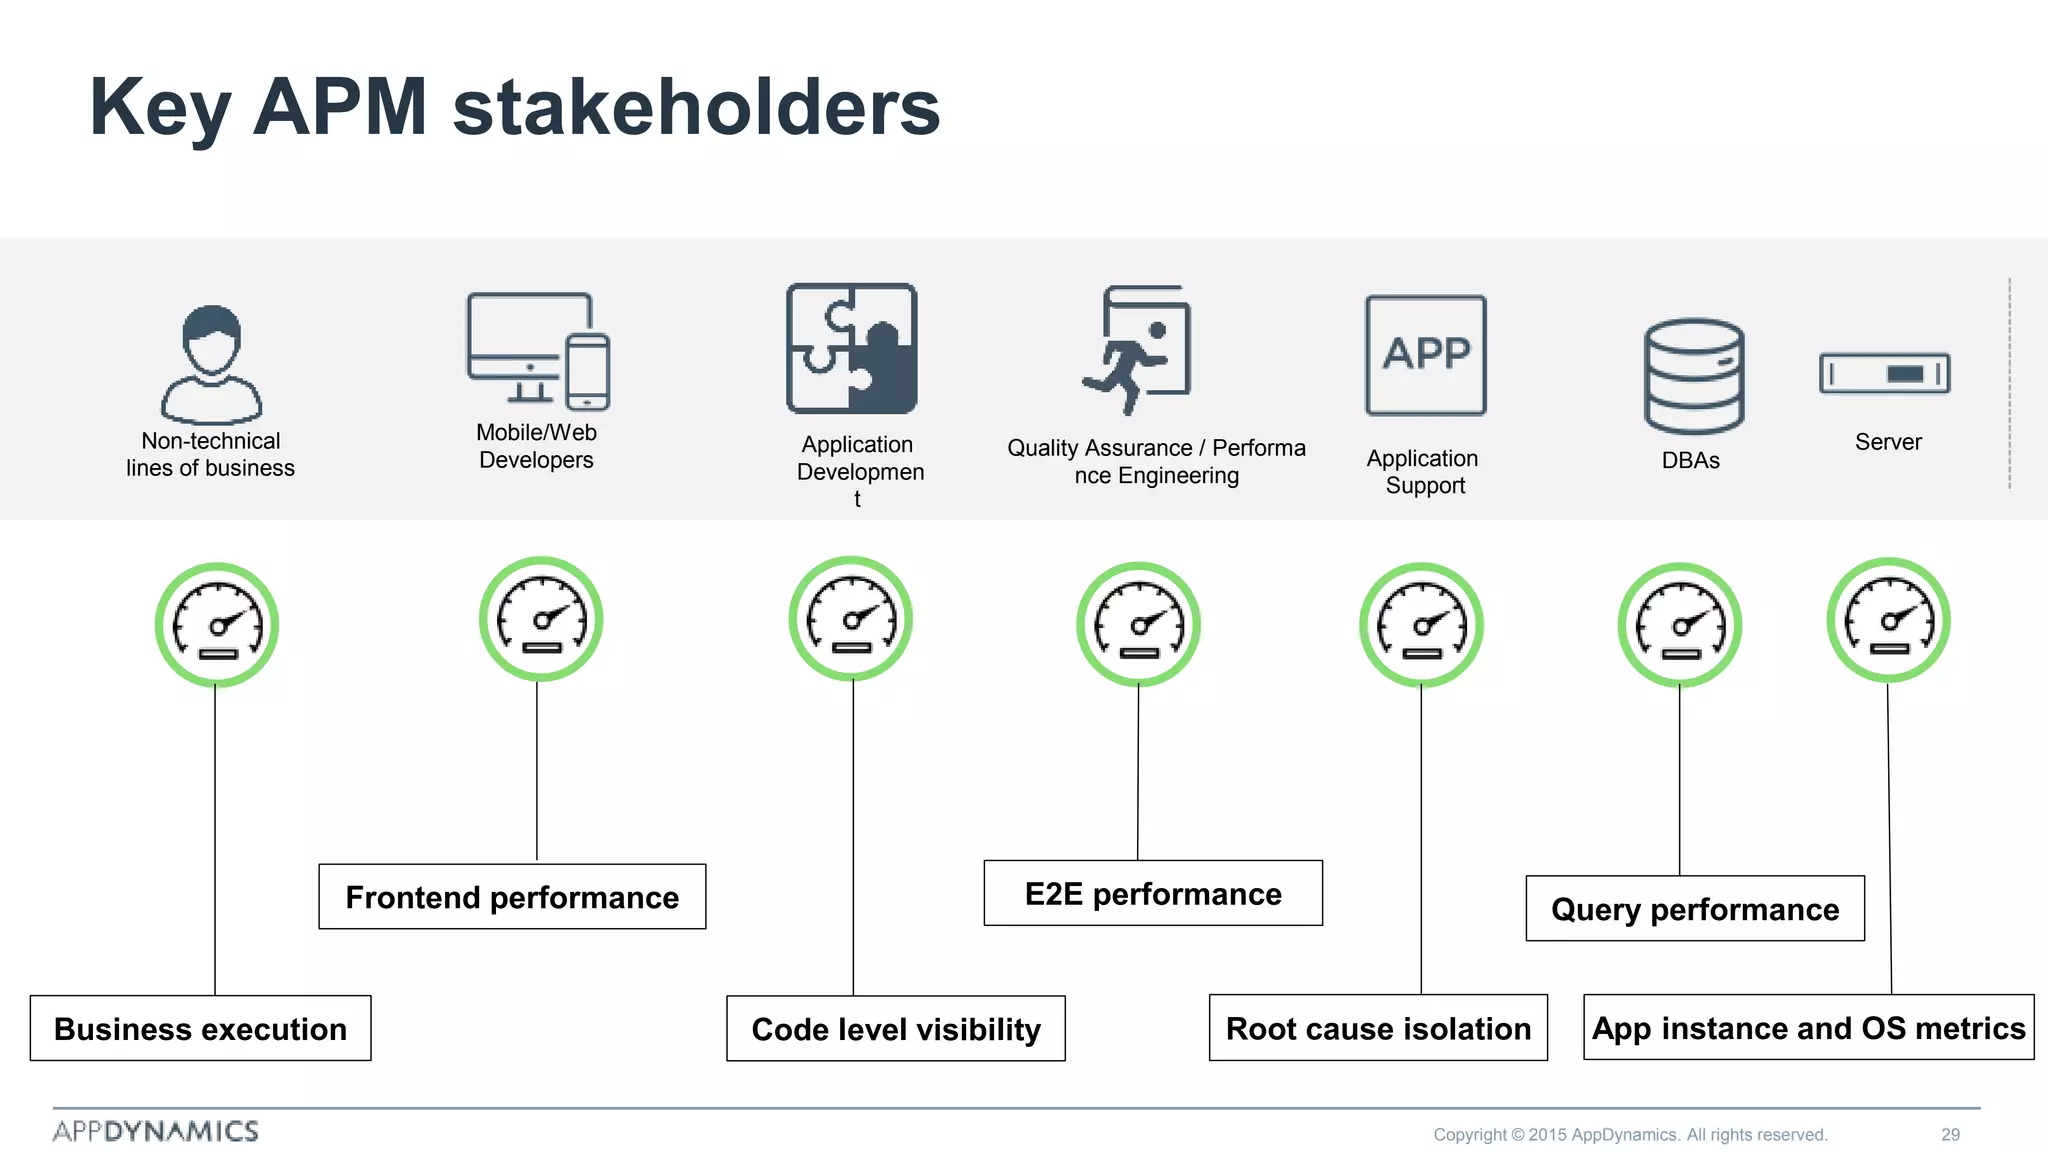
The Business Justification for Application
Performance Monitoring
CMG Conference 2015
Jonah Kowall, VP Market Development and Insights
WHAT IS CAUSING DIGITAL
TRANSFORMATION?
2005
2013
Copyright © 2015 AppDynamics. All rights reserved. 4
The world’s largest taxi
company, owns no vehicles
The most valuable
retailer, has no
inventory
The world’s largest
accommodation provider,
owns no real estate
The world’s most popular
media owner, creates no
content
PREY
52% of Fortune 500 firms
since 2000 are gone
PREDATOR
Rate of innovation will determine if you are the
predator or the prey
WHY IS PERFORMANCE
CRITICAL?
74%of users will leave a
website if it doesn’t load
in under 5 seconds>5 seconds
- Goldsmiths, App Attention Span
86%of users have uninstalled
at least one mobile app,
after just 1 use due to
performance problems
81%of buyers will pay more for a
better customer experience…
- Forbes, Customer Experience Index
…but only1%of customers
feel their expectations are being met
- Forbes, Customer Experience Index
Uptime is critical for enterprises and consumers
Performance impacts the bottom line
How fast is fast enough?
• Performance is key to a great user experience
– Under 100ms is perceived as reacting instantaneously
– A 100ms to 300ms delay is perceptible
– 1 second is about the limit for the user's flow of thought to stay
uninterrupted
• Users expect a site to load in 2 seconds
• After 3 seconds, 40% will abandon your site.
– 10 seconds is about the limit for keeping the user's attention
• Modern applications spend more time in the browser than on the
server-side
HOW IS COMPLEXITY
CAUSING MANAGEMENT
ISSUES?
Applications are transforming
Copyright © 2015 AppDynamics. All rights reserved. 14
Conventional Enterprise Cloud "Native" Pattern
Adapted From Cloud Architecture Tutorial by Adrian Cockcroft (Netflix)
Central SQL Database
Sticky In-memory Session
Chatty Protocols
Tangled Service Interfaces
Polled Information
Fat Complex Objects
Components as Jar Files
Distributed Key/Value NoSQL
Latency Tolerant Protocols
Event-driven
Lightweight Serializable Objects
Components as Services
Layered Service Interfaces
Shared Memcached/Redis Session
Java, .NET JavaScript, Python, Ruby, node.js
Copyright © 2015 AppDynamics. All rights reserved. 15
Application complexity is exploding
Login
Flight Status
Search Flight
Purchase
End User Experience = Business Transactions
Performance
Mobile
SOA
NOSQL
Cloud
Agile
Web
Copyright © 2014 AppDynamics. All rights reserved. 16
Online retailer
Copyright © 2014 AppDynamics. All rights reserved. 17
Infrastructure Complexity Increasing
Courtesy of Vmware: https://blogs.vmware.com/performance/2014/10/docker-containers-performance-vmware-vsphere.html
Copyright © 2014 AppDynamics. All rights reserved. 18
Infrastructure Management Proliferation
Copyright © 2015 AppDynamics. All rights reserved. 19
Today’s tools exist within silos
Mobile/Web App Middleware Database Server Network Storage
CMDB
Limited Integrations
Incomplete & Inaccurate
Copyright © 2015 AppDynamics. All rights reserved. 20
Don’t let go
Copyright © 2015 AppDynamics. All rights reserved. 21
Difficult to connect the dots without context
Mobile/Web App Middleware Database Server Network Storage
CheckoutTransaction
“Network 97%”“Slow SQL query”“JVM perf issues”“Checkout is slow”
??
No end-to-end perspective No situational awareness
Long time to troubleshoot and resolve issues
Escalate
Escalate
Time
Resolution
War Room
L2 Troubleshoot
L1
Troubleshoot
“Checkout is Slow”
Reactive problem identification
Real world impact of silo-ed monitoring
Copyright © 2015 AppDynamics. All rights reserved. 23
* Survey response from 302 IT
professionals conducted by
EMA
65%enterprises have 10+
monitoring tools.
0%
1%
13%
21%
22%
15%
9%
6%
3%
10%
0% 5% 10% 15% 20% 25%
0
1
2-5
6-10
11-25
26-40
41-50
50-75
76-100
More than 100
Q: how many enterprise monitoring/mgmt products would you estimate your IT org owns?*
33%issues are reported
by end users
77%issues require 5+
people-hour to
resolve
What Should I Monitor?
Copyright © 2015 AppDynamics. All rights reserved. 24
Server CPU, Memory, Network?
Capacity? Utilization? Throughput?
If your business is selling server CPU, Memory, and network, yes,
but most are not
Too Many Graphs, Too Much Time Wasted
Copyright © 2015 AppDynamics. All rights reserved. 25
Very primitive, cobbled together, custom built solutions:
• Nagios, Zabbix, or others doing alerting.
• Graphite dashboards.
• StatsD custom metrics.
• collectd service/system metrics.
• Elasticsearch, Logstash and Kibana (ELK) for logs.
• Typical NOC, inefficient.
• Lots of screens and data.
• Too many email alerts.
• Alert on what matters for
end-user experience, otherwise handle component or
redundant outages without notification.
WHATS THE NOISE
ABOUT APM?
What is APM?
• Real user experience
• Synthetic availability monitoring
• Code level visibility
• Transaction tracing
• Metric collection from associated components
• Analytics of collected data
• Other:
– You may have some APM functions in network tools, but they fail to
meet all criteria.
What is not APM?
• Server monitoring
– Application instance monitoring can provide some application
metrics, but none are detailed
• Network monitoring
• Storage monitoring
• Infrastructure specific metric collection
Copyright © 2015 AppDynamics. All rights reserved. 29
Key APM stakeholders
Mobile/Web
Developers
Application
Developmen
t
Quality Assurance / Performa
nce Engineering
DBAs
Server
Frontend performance
Non-technical
lines of business
Business execution
Application
Support
Code level visibility Root cause isolation
E2E performance
App instance and OS metrics
Query performance
Context is king: Unified Monitoring
Monitor the end user experience
• Real User Monitoring vs Synthetic Monitoring
– Synthetic tests provide 24/7 assurance
– RUM provides insights into actual users
• Mobile device segmentation
• Unexpected behavior/trends
• Real User Monitoring
– Navigation Timing API
– Resource Timing API
– User Timing API
– Javascript Errors
Moving from reactive to proactive
• Automatic discovery of environment and application changes
– New APIs, transactions, services, clouds
• Leverage analytics to be smarter about using the data you
already have
– System Logs, Metrics from events and infrastructure stats
– Transactions with request parameters + User state from
cookies/sessions
• Performance monitoring isn’t just about the tech
– Visibility into the impact of business - alerting when revenue is down
Up-level the conversation
Copyright © 2015 AppDynamics. All rights reserved. 33
Capture business transactions!
How? (APM or Custom Instrumentation)
Assume you are a retail bank, you don’t just monitor the amount of money being deposited?
Monitor if your customers can deposit money and are depositing money
Metrics + logs help, but intelligence is better
34
Customer spending
profile Top performing product
category
Copyright © 2015 AppDynamics. All rights reserved.
Moving from reactive to proactive
• Resolving before the red = fixing in the yellow
• Intelligent anomaly detection across end-user, application,
database, server metrics
– Automatically calculates dynamic baselines for all of your metrics,
which, based on actual usage, define what is "normal" for each metric
– Smart alerting based on any deviation from the baselines
• Understand trends and patterns in failures - automatically learn
from the past
– Understand what are the most impactful issues to resolve
– Often times external services are the root cause with limited visibility
• Enforce SLAs
Real Business Impact
Copyright © 2015 AppDynamics. All rights reserved. 36
• Reduced support
tickets by 94%
• Saved over $200K
per year
• Reduced MMTR in
production by 65%
• Reduced problem
resolution in pre-
production by 75%
OPERATIONAL EFFICIENCY
• Increased production
availability to 99.95%
• Saved $167K in lost
revenue
• Realized over $800K
in productivity
savings
• Reduced MTTR from
2 hours to 30
minutes
• Saved $1.35M in
revenue during an
outage in 2012
REVENUE PROTECTION
• Scaled application by
10X
• Avoided $3.4M in
hardware costs
• Saved $4.8M in 2
years
COST AVOIDANCE
• Analyze
configuration,
hardware and
software trends
• Successfully deploy
2,500 builds per
month
• Reduced customer
transaction time from
10 seconds to less
than 1 second
• Reduced call center
application wait time
USER SATISFACTION
• Improved transaction
performance by 25%
• Achieved full ROI in
just over 1 year
Leading companies invest in performance
• Etsy = Kale = Statsd + Skyline + Oculus (stats collection + anomaly
detection/correlation)
• Netflix = PCP + Vector + Servo + Atlas (dashboards, data collection,
root cause analysis)
• Twitter = Zipkin (distributed tracing)
Key takeaways
• Treat performance as a feature
– Create a performance budget with milestones, speed index, page speed
– Capacity plan and load test the server-side
– Optimize and performance test the client-side
• Monitor performance in development and production
– Instrument everything
– Measure the difference of every change
– Understand how failures impact performance
• Make monitoring critical and test in your continuous delivery process
• Connect the biz/dev/ops performance perspectives to align on
business impact metrics and KPIs
QUESTIONS?
Thank You

The Business Justification for APM

  • 1.
    The Business Justificationfor Application Performance Monitoring CMG Conference 2015 Jonah Kowall, VP Market Development and Insights
  • 2.
    WHAT IS CAUSINGDIGITAL TRANSFORMATION?
  • 3.
  • 4.
    Copyright © 2015AppDynamics. All rights reserved. 4 The world’s largest taxi company, owns no vehicles The most valuable retailer, has no inventory The world’s largest accommodation provider, owns no real estate The world’s most popular media owner, creates no content
  • 5.
    PREY 52% of Fortune500 firms since 2000 are gone PREDATOR Rate of innovation will determine if you are the predator or the prey
  • 6.
  • 7.
    74%of users willleave a website if it doesn’t load in under 5 seconds>5 seconds
  • 8.
    - Goldsmiths, AppAttention Span 86%of users have uninstalled at least one mobile app, after just 1 use due to performance problems
  • 9.
    81%of buyers willpay more for a better customer experience… - Forbes, Customer Experience Index …but only1%of customers feel their expectations are being met - Forbes, Customer Experience Index
  • 10.
    Uptime is criticalfor enterprises and consumers
  • 11.
  • 12.
    How fast isfast enough? • Performance is key to a great user experience – Under 100ms is perceived as reacting instantaneously – A 100ms to 300ms delay is perceptible – 1 second is about the limit for the user's flow of thought to stay uninterrupted • Users expect a site to load in 2 seconds • After 3 seconds, 40% will abandon your site. – 10 seconds is about the limit for keeping the user's attention • Modern applications spend more time in the browser than on the server-side
  • 13.
    HOW IS COMPLEXITY CAUSINGMANAGEMENT ISSUES?
  • 14.
    Applications are transforming Copyright© 2015 AppDynamics. All rights reserved. 14 Conventional Enterprise Cloud "Native" Pattern Adapted From Cloud Architecture Tutorial by Adrian Cockcroft (Netflix) Central SQL Database Sticky In-memory Session Chatty Protocols Tangled Service Interfaces Polled Information Fat Complex Objects Components as Jar Files Distributed Key/Value NoSQL Latency Tolerant Protocols Event-driven Lightweight Serializable Objects Components as Services Layered Service Interfaces Shared Memcached/Redis Session Java, .NET JavaScript, Python, Ruby, node.js
  • 15.
    Copyright © 2015AppDynamics. All rights reserved. 15 Application complexity is exploding Login Flight Status Search Flight Purchase End User Experience = Business Transactions Performance Mobile SOA NOSQL Cloud Agile Web
  • 16.
    Copyright © 2014AppDynamics. All rights reserved. 16 Online retailer
  • 17.
    Copyright © 2014AppDynamics. All rights reserved. 17 Infrastructure Complexity Increasing Courtesy of Vmware: https://blogs.vmware.com/performance/2014/10/docker-containers-performance-vmware-vsphere.html
  • 18.
    Copyright © 2014AppDynamics. All rights reserved. 18 Infrastructure Management Proliferation
  • 19.
    Copyright © 2015AppDynamics. All rights reserved. 19 Today’s tools exist within silos Mobile/Web App Middleware Database Server Network Storage CMDB Limited Integrations Incomplete & Inaccurate
  • 20.
    Copyright © 2015AppDynamics. All rights reserved. 20 Don’t let go
  • 21.
    Copyright © 2015AppDynamics. All rights reserved. 21 Difficult to connect the dots without context Mobile/Web App Middleware Database Server Network Storage CheckoutTransaction “Network 97%”“Slow SQL query”“JVM perf issues”“Checkout is slow” ??
  • 22.
    No end-to-end perspectiveNo situational awareness Long time to troubleshoot and resolve issues Escalate Escalate Time Resolution War Room L2 Troubleshoot L1 Troubleshoot “Checkout is Slow” Reactive problem identification
  • 23.
    Real world impactof silo-ed monitoring Copyright © 2015 AppDynamics. All rights reserved. 23 * Survey response from 302 IT professionals conducted by EMA 65%enterprises have 10+ monitoring tools. 0% 1% 13% 21% 22% 15% 9% 6% 3% 10% 0% 5% 10% 15% 20% 25% 0 1 2-5 6-10 11-25 26-40 41-50 50-75 76-100 More than 100 Q: how many enterprise monitoring/mgmt products would you estimate your IT org owns?* 33%issues are reported by end users 77%issues require 5+ people-hour to resolve
  • 24.
    What Should IMonitor? Copyright © 2015 AppDynamics. All rights reserved. 24 Server CPU, Memory, Network? Capacity? Utilization? Throughput? If your business is selling server CPU, Memory, and network, yes, but most are not
  • 25.
    Too Many Graphs,Too Much Time Wasted Copyright © 2015 AppDynamics. All rights reserved. 25 Very primitive, cobbled together, custom built solutions: • Nagios, Zabbix, or others doing alerting. • Graphite dashboards. • StatsD custom metrics. • collectd service/system metrics. • Elasticsearch, Logstash and Kibana (ELK) for logs. • Typical NOC, inefficient. • Lots of screens and data. • Too many email alerts. • Alert on what matters for end-user experience, otherwise handle component or redundant outages without notification.
  • 26.
  • 27.
    What is APM? •Real user experience • Synthetic availability monitoring • Code level visibility • Transaction tracing • Metric collection from associated components • Analytics of collected data • Other: – You may have some APM functions in network tools, but they fail to meet all criteria.
  • 28.
    What is notAPM? • Server monitoring – Application instance monitoring can provide some application metrics, but none are detailed • Network monitoring • Storage monitoring • Infrastructure specific metric collection
  • 29.
    Copyright © 2015AppDynamics. All rights reserved. 29 Key APM stakeholders Mobile/Web Developers Application Developmen t Quality Assurance / Performa nce Engineering DBAs Server Frontend performance Non-technical lines of business Business execution Application Support Code level visibility Root cause isolation E2E performance App instance and OS metrics Query performance
  • 30.
    Context is king:Unified Monitoring
  • 31.
    Monitor the enduser experience • Real User Monitoring vs Synthetic Monitoring – Synthetic tests provide 24/7 assurance – RUM provides insights into actual users • Mobile device segmentation • Unexpected behavior/trends • Real User Monitoring – Navigation Timing API – Resource Timing API – User Timing API – Javascript Errors
  • 32.
    Moving from reactiveto proactive • Automatic discovery of environment and application changes – New APIs, transactions, services, clouds • Leverage analytics to be smarter about using the data you already have – System Logs, Metrics from events and infrastructure stats – Transactions with request parameters + User state from cookies/sessions • Performance monitoring isn’t just about the tech – Visibility into the impact of business - alerting when revenue is down
  • 33.
    Up-level the conversation Copyright© 2015 AppDynamics. All rights reserved. 33 Capture business transactions! How? (APM or Custom Instrumentation) Assume you are a retail bank, you don’t just monitor the amount of money being deposited? Monitor if your customers can deposit money and are depositing money
  • 34.
    Metrics + logshelp, but intelligence is better 34 Customer spending profile Top performing product category Copyright © 2015 AppDynamics. All rights reserved.
  • 35.
    Moving from reactiveto proactive • Resolving before the red = fixing in the yellow • Intelligent anomaly detection across end-user, application, database, server metrics – Automatically calculates dynamic baselines for all of your metrics, which, based on actual usage, define what is "normal" for each metric – Smart alerting based on any deviation from the baselines • Understand trends and patterns in failures - automatically learn from the past – Understand what are the most impactful issues to resolve – Often times external services are the root cause with limited visibility • Enforce SLAs
  • 36.
    Real Business Impact Copyright© 2015 AppDynamics. All rights reserved. 36 • Reduced support tickets by 94% • Saved over $200K per year • Reduced MMTR in production by 65% • Reduced problem resolution in pre- production by 75% OPERATIONAL EFFICIENCY • Increased production availability to 99.95% • Saved $167K in lost revenue • Realized over $800K in productivity savings • Reduced MTTR from 2 hours to 30 minutes • Saved $1.35M in revenue during an outage in 2012 REVENUE PROTECTION • Scaled application by 10X • Avoided $3.4M in hardware costs • Saved $4.8M in 2 years COST AVOIDANCE • Analyze configuration, hardware and software trends • Successfully deploy 2,500 builds per month • Reduced customer transaction time from 10 seconds to less than 1 second • Reduced call center application wait time USER SATISFACTION • Improved transaction performance by 25% • Achieved full ROI in just over 1 year
  • 37.
    Leading companies investin performance • Etsy = Kale = Statsd + Skyline + Oculus (stats collection + anomaly detection/correlation) • Netflix = PCP + Vector + Servo + Atlas (dashboards, data collection, root cause analysis) • Twitter = Zipkin (distributed tracing)
  • 38.
    Key takeaways • Treatperformance as a feature – Create a performance budget with milestones, speed index, page speed – Capacity plan and load test the server-side – Optimize and performance test the client-side • Monitor performance in development and production – Instrument everything – Measure the difference of every change – Understand how failures impact performance • Make monitoring critical and test in your continuous delivery process • Connect the biz/dev/ops performance perspectives to align on business impact metrics and KPIs
  • 39.
  • 40.

Editor's Notes

  • #5 Something interesting is happening
  • #10 Would you pay an extra $1 to jump the queue Or to improve processing time / performance? These statistics highlight the magnitude of the growth opportunity before us. What if you just increased the percentage of consistently happy customers by 5%? For any company, large or small, that would be a game-changer in terms of revenue and profit It’s clear – more emphasis will be on the experiences a company delivers to create a competitive advantage. SOURCES: AppDynamics App Attention Span Read paragraph #2 - http://www.forbes.com/sites/christinecrandell/2013/01/21/customer-experience-is-it-the-chicken-or-egg/ http://www.walkerinfo.com/customers2020/ https://econsultancy.com/blog/10936-site-speed-case-studies-tips-and-tools-for-improving-your-conversion-rate/ https://econsultancy.com/blog/66121-improving-the-multichannel-customer-experience/ http://www.websitemagazine.com/images/blog/RadwareSiteSpeed.png
  • #11 Uptime is critical. Performance is an advantage. Enterprises require fault-tolerance.
  • #12 Amazon has performed experiments showing that for every 100ms delay, its sales decreased by 1%. Yahoo found that a one-second additional server delay resulted in a 2.8% decrease in revenue and an almost two-second increase in time to click. Microsoft has performed experiments showing that for every 100ms speed increase it was able to improve its revenue by 0.6% as a direct result. Google has performed experiments showing that slowing down the search results page by between 100ms to 400ms impacts the number of searches done per user by −0.2% to −0.6%. — Gartner: How Performance Affects User Experience and Your Bottom Line, and What to Do About It Published: 8 September 2014 Analyst(s): Magnus Revang, Ray Valdes, Jonah Kowall — 1 A. Beaujon, "Washington Post Announces Plans to Hire Bloggers, Redesign Site," Poynter., 29 January 2014. 2 Between 500 and 600 Gartner client interactions a year on user experience. 3 G. Linden, "Slides From My Talk at Stanford," Geeking With Greg, 4 December 2006. 4 M. Goldin, "Amazon Dominated Online Retail Sales in 2013," Mashable, 8 May 2014. 5 S. Stefanov, "Don't Make Me Wait! or Building High-Performance Web Applications," 19 August 2009. 6 R. Kohavi, A. Deng, R. Longbotham and Y. Xu, "Seven Rules of Thumb for Web Site Experimenters," To appear in KDD 2014. 7 J. Brutlag, "Speed Matters," Google Research Blog, 24 June 2009. 8 D. Barton, "Decoding Google's Revenue," Southern Web, 22 July 2013. 9 A. Nassar, "Performance-Based Design — Linking Performance to Business Metrics," Velocity, the O'Reilly conference, 23 June 2009. 10 Blue Triangle Technologies relayed this information to Gartner. 11 A. Bouch, A. Kuchinsky, N, Bhatti, "Quality Is in the Eye of the Beholder: Meeting Users' Requirements for Internet Quality of Service," HP Laboratories Palo Alto, January 2000. 12 B.J. Fogg, T. Kameda, J. Boyd, J. Marshall, R. Sethi, M. Sockol, and T. Trowbridge, "Stanford- Makovsky Web Credibility Study 2002: Investigating What Makes Web Sites Credible Today," Stanford University, 2002. 13 Akamai 14 J. Ramsay, "A Psychological Investigation of Long Retrieval Times on the World Wide Web," ScienceDirect, 23 June 1998. 15 Y. Skadberg and J. Kimmel, "Visitors' Flow Experience While Browsing a Web Site: Its Measurement, Contributing Factors and Consequences," ScienceDirect, 5 July 2003. 16 A. Jain and M. Tikir, "Is the Web Getting Faster?," Google Analytics Blog,15 April 2013. 17 HTTP Archive 18 HTTP Archive 19 "Enterprise Software: Why the User Experience Matters," Deloitte CIO Journal, 10 September 2012.
  • #13 It is really about the users perception of performance. Slow checkout anyone? Users lose faith quickly. It is even worse on mobile. http://larahogan.me/design/ Akamai’s study shows us some very strong facts about percieved performance, like: 47% of people expect a web page to load in 2 seconds or less. 40% will abandon a web page if it takes more than 3 seconds to load. 52% of online shoppers claim that quick page loads are important for their loyalty to a site. 14% will start shopping at a different site if page loads are slow, 23% will simply stop shopping. 64% of shoppers who are dissatisfied with their site visit will go somewhere else to shop next time. http://www.akamai.com/dl/reports/Site_Abandonment_Final_Report.pdf http://timkadlec.com/2014/11/performance-budget-metrics/ http://danielmall.com/articles/how-to-make-a-performance-budget/ http://www.nngroup.com/articles/response-times-3-important-limits/ Card, S. K., Robertson, G. G., and Mackinlay, J. D. (1991). The information visualizer: An information workspace. Proc. ACM CHI'91 Conf. (New Orleans, LA, 28 April-2 May), 181-188. Miller, R. B. (1968). Response time in man-computer conversational transactions. Proc. AFIPS Fall Joint Computer Conference Vol. 33, 267-277. Myers, B. A. (1985). The importance of percent-done progress indicators for computer-human interfaces. Proc. ACM CHI'85 Conf. (San Francisco, CA, 14-18 April), 11-17.
  • #15 Image : http://www.flickr.com/photos/wscullin/3770015203
  • #16 In the early 2000s, application architectures were fairly simplistic consisting of a monolithic 3-tier architecture - with a user request resulting in a call to an application server and then a query to some backend database Over time, the application architectures and operating environments have grown in complexity. While these shifts have been good for application developer productivity and agility, they have made modern applications more difficult to manage. The shifts that have had the most impact on IT Operations & App Support teams include SOA: Service Oriented Architecture Cloud Capacity: Usage of Cloud Capacity from providers like Amazon EC2 and private clouds Big Data: Surge in data volumes popularizing Big Data and NoSQL technologies such as Hadoop, Cassandra and MongoDB Mobile: In addition, Businesses are looking at iOS and Android devices as new channels to market Agile: And to complicate things even further, more frequent code release cycles with the adoption of agile development [BUILD BUSINESS TRANSACTION IS THE ONLY CONSTANT] All of these technologies have created the perfect storm for operations and development trying to manage the performance and availability of their application due to the high rate of change these teams are facing. To add to this challenge, legacy monitoring approaches weren’t built to support these environments. Throughout this change and all future change. The only constant is the Business Transaction which is the main unit of measurement within AppDynamics
  • #17 “And this is reality. This is a real customers application” Either just show 1 or flick through 2 or 3 flow maps quickly and stop on one to talk about. This is reality. It's an actual customer application. It's obviously a very complex environment, but this is what applications look like today and what you are looking at is a map of all the transactions that are flowing through that app (or for some examples i would say it is just a single transactions) in the past customers drew a diagram like this manually and it was out of date as soon as it was finished Here we auto discover this environment by mapping the transactions as they flow through the application automatically I'll tell you a bit more about how we do this in a moment (leaving some intrigue on the table) DO NOT NAME CUSTOMERS HERE!
  • #18 “And this is reality. This is a real customers application” Either just show 1 or flick through 2 or 3 flow maps quickly and stop on one to talk about. This is reality. It's an actual customer application. It's obviously a very complex environment, but this is what applications look like today and what you are looking at is a map of all the transactions that are flowing through that app (or for some examples i would say it is just a single transactions) in the past customers drew a diagram like this manually and it was out of date as soon as it was finished Here we auto discover this environment by mapping the transactions as they flow through the application automatically I'll tell you a bit more about how we do this in a moment (leaving some intrigue on the table) DO NOT NAME CUSTOMERS HERE!
  • #19 “And this is reality. This is a real customers application” Either just show 1 or flick through 2 or 3 flow maps quickly and stop on one to talk about. This is reality. It's an actual customer application. It's obviously a very complex environment, but this is what applications look like today and what you are looking at is a map of all the transactions that are flowing through that app (or for some examples i would say it is just a single transactions) in the past customers drew a diagram like this manually and it was out of date as soon as it was finished Here we auto discover this environment by mapping the transactions as they flow through the application automatically I'll tell you a bit more about how we do this in a moment (leaving some intrigue on the table) DO NOT NAME CUSTOMERS HERE!
  • #23 77% of the time at least 5+ people hours needed
  • #25 Image : http://bit.ly/1FUSQl4
  • #26 Image Courtesy of Docklandsboy: http://bit.ly/1tMnHcy Too Many Graphs, Too Much Time Wasted This typical NOC has a wall which looks like this, it's extremely inefficient since you are staring and loads of data, graphs, and other dashboards. Engineers love this stuff, but it's not digestible. People are inundated with alerts, emails, and pages. Cutting this down to what matters should be a focus, but finding the right tools and analytics are a challenge today. In most web-scale shops they build their own tools often cobbled together with very primitive underpinnings and capabilities. The problem with commercial tools is the cost begins to get too high for many organizations, while others invest in them.
  • #32 https://dvcs.w3.org/hg/webperf/raw-file/tip/specs/NavigationTiming/Overview.html http://www.w3.org/TR/2011/WD-resource-timing-20110524/ http://githubengineering.com/browser-monitoring-for-github-com/
  • #33 Moving to monitoring systems instead of servers Applying data science and statistics across operational information New ways to explore complex system data Bringing together metrics and events for a unified look at your system
  • #34 Image : http://bit.ly/1FUUMKi
  • #35 Customers of AppDynamics understand this impact, and in real-time Here is an example dashboard taken from a US eCommerce customer of AppDynamics, highlighting the real time correlation between Application Errors, Response Time, and the Revenue generated by one of the critical Business Transactions <CLICK> At approximately 18:30 we can clearly see that there has been a significant event that has occurred <CLICK> The Application Response time has jumped from 100 ms up to 10.1seconds (100x increase) <CLICK> And at the same time we can see the revenues being generated dropped from $65k per minute down to $12k This dashboard shows the real time business impact of poor performance enabling everyone within the organization to plan, troubleshoot and remediate in the most appropriate way.
  • #37 AppDynamics is proven in enterprise production environments and can support applications with thousands of nodes or significant transaction throughput. Here are some of our largest deployments. ExactTarget was deployed across 5,000 servers in just 30 days, Orbitz also deployed in just 15 days which shows how easy AppDynamics is to scale across your organization.
  • #38 https://codeascraft.com/2013/06/11/introducing-kale/ https://github.com/etsy/statsd https://github.com/etsy/oculus https://github.com/etsy/skyline http://techblog.netflix.com/2015/04/introducing-vector-netflixs-on-host.html Vector is an open source on-host performance monitoring framework which exposes hand picked high resolution system and application metrics to every engineer’s browser. Having the right metrics available on-demand and at a high resolution is key to understand how a system behaves and correctly troubleshoot performance issues. Vector provides a simple way for users to visualize and analyze system and application-level metrics in near real-time. It leverages the battle tested open source system monitoring framework, Performance Co-Pilot (PCP), layering on top a flexible and user-friendly UI. - http://pcp.io/ http://techblog.netflix.com/2013/12/announcing-suro-backbone-of-netflixs.html http://techblog.netflix.com/2014/01/improving-netflixs-operational.html Real-time Event Management System (SURO) Event Stream Aggregation and Dashboard (Hysterix and Turbine) Configuration Management using Asgard, Edda and MyEdda Continuous Optimization using Conformity Monkey and Janitor Monkey Netflix Ice: Cloud Spend and Usage Analytics (FinOps)