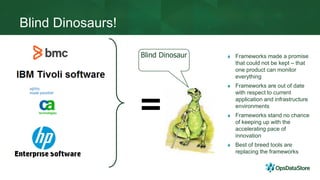
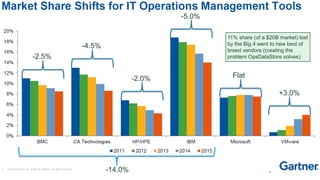
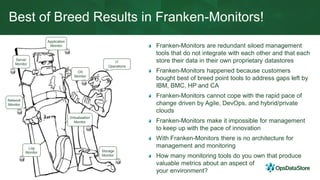
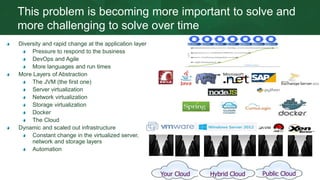
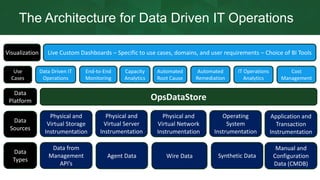
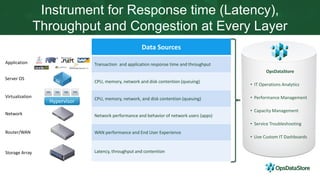
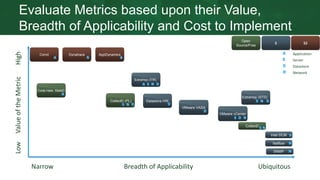
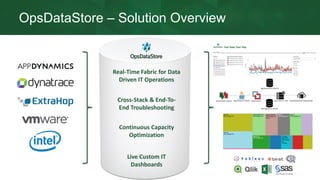
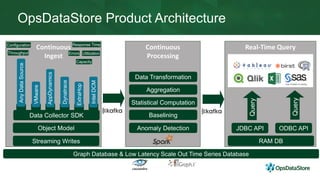
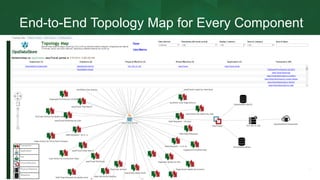
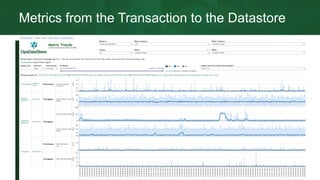
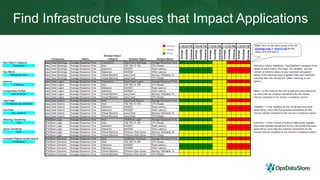
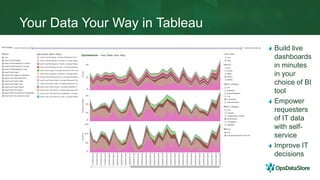
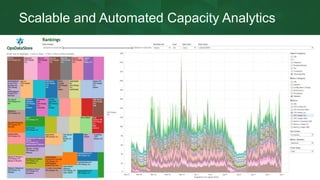
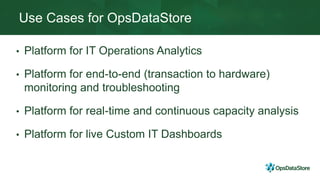
Transaction (Click) to Disk Troubleshooting
with AppDynamics and OpsDataStore
Bernd Harzog
Founder and CEO
My History with AppDynamics – Confidant and Fan
Strategy Consultant Product Selection Consultant
Questions for You
Does everything work as well as it is supposed to all of
the time?
Is your understanding of your infrastructure
performance as robust as is your understanding of
your application performance?
Would you be interested in understanding
infrastructure performance in the context of
transaction performance?
What Has Not Worked?
Blind Dinosaurs!
=
Frameworks made a promise
that could not be kept – that
one product can monitor
everything
Frameworks are out of date
with respect to current
application and infrastructure
environments
Frameworks stand no chance
of keeping up with the
accelerating pace of
innovation
Best of breed tools are
replacing the frameworks
Blind Dinosaur
-2.5%
-4.5%
-2.0%
-5.0%
Flat
+3.0%
11% share (of a $20B market) lost
by the Big 4 went to new best of
breed vendors (creating the
problem OpsDataStore solves)
-14.0%
Best of Breed Results in Franken-Monitors!
Franken-Monitors are redundant siloed management
tools that do not integrate with each other and that each
store their data in their own proprietary datastores
Franken-Monitors happened because customers
bought best of breed point tools to address gaps left by
IBM, BMC, HP and CA
Franken-Monitors cannot cope with the rapid pace of
change driven by Agile, DevOps, and hybrid/private
clouds
Franken-Monitors make it impossible for management
to keep up with the pace of innovation
With Franken-Monitors there is no architecture for
management and monitoring
How many monitoring tools do you own that produce
valuable metrics about an aspect of
your environment?
Network
Monitor
Storage
Monitor
Application
Monitor
Server
Monitor
Virtualization
Monitor
OS
Monitor
IT
Operations
Log
Monitor
This problem is becoming more important to solve and
more challenging to solve over time
Diversity and rapid change at the application layer
Pressure to respond to the business
DevOps and Agile
More languages and run times
More Layers of Abstraction
The JVM (the first one)
Server virtualization
Network virtualization
Storage virtualization
Docker
The Cloud
Dynamic and scaled out infrastructure
Constant change in the virtualized server,
network and storage layers
Automation
Your Cloud Public CloudHybrid Cloud
Data Driven IT Operations
to the Rescue
The Architecture for Data Driven IT Operations
Physical and
Virtual Storage
Instrumentation
Physical and
Virtual Server
Instrumentation
Physical and
Virtual Network
Instrumentation
Operating
System
Instrumentation
Application and
Transaction
Instrumentation
Data
Sources
Live Custom Dashboards – Specific to use cases, domains, and user requirements – Choice of BI ToolsVisualization
End-to-End
Monitoring
Capacity
Analytics
Automated
Root Cause
Automated
Remediation
IT Operations
Analytics
Cost
Management
Use
Cases
Data Driven IT
Operations
OpsDataStore
Data
Platform
Data
Types
Data from
Management
API’s
Agent Data Wire Data Synthetic Data
Manual and
Configuration
Data (CMDB)
The New Metric Collection Requirements
Continuous – Near Real Time – Streaming – Coarse grained
intervals (minutes) no longer frequent enough
Consistent – Gaps in metric collection are no longer acceptable
Deterministic – Rolled up averages are dangerously misleading
Accurate – measurement bias (i.e., time shifting) no longer
tolerable
Efficient – not influenced by the metric collection process –
“outside-in” observation preferable
Instrument for Response time (Latency),
Throughput and Congestion at Every Layer
Storage Array
Router/WAN
Network
Server OS
Hypervisor
Virtualization
Data Sources
Transaction and application response time and throughput
CPU, memory, network and disk contention (queuing)
CPU, memory, network, and disk contention (queuing)
Network performance and behavior of network users (apps)
WAN performance and End User Experience
Latency, throughput and contention
Application
OpsDataStore
• IT Operations Analytics
• Performance Management
• Capacity Management
• Service Troubleshooting
• Live Custom IT Dashboards
Evaluate Metrics based upon their Value,
Breadth of Applicability and Cost to Implement
LowValueoftheMetricHigh
Narrow Breadth of Applicability Ubiquitous
Open
Source/Free
$ $$
Application
Server
Datastore
Dynatrace AppDynamics
Coda Hale, StatsD
Corvil
Intel DCM
Network
SNMP
VMware VASA
Datastore HW
Netflow
VMware vCenter
CollectD
ExtraHop (STD)
ExtraHop (ITR)
CollectD (PL)
The Solution
OpsDataStore
The Real-Time Platform for Data Driven IT Operations
OpsDataStore – Solution Overview
Live Custom IT
Dashboards
Cross-Stack & End-To-
End Troubleshooting
Real-Time Fabric for Data
Driven IT Operations
Continuous Capacity
Optimization
OpsDataStore Ecosystem Strategy
OpsDataStore
Cirba
NPM Cloud Auto AutomationOps Mgmt. App Perf. Mgmt.Platforms
Sevone VMware ApptioRiverbed ServiceNowVMware
Riverbed Dell/EMC Puppet
VMware
New Relic
Virtual Inst.
Linux
AppDynamics
Moogsoft
Arista Dell
Cisco UCS
Nutanix
GigaMon Red Hat Chef
VMTurbo Dynatrace
Prelert
GigaMonWindows GigaMon
INETCO
CSCNagios
AppNeta
AppEnsure Big Panda
CSCEMC
Mirantis
Ansible
Apteligent
NetuitiveExtraHop
NetApp Kentik
Analytics Cost Mgmt. Service Mgmt.IPM
Zenoss
Zabbix
Corvil
ExtraHop
Key OpsDataStore Features
Open Ingest – collect data from any platform, management tool or API
Dynamic Object Model – all data is related at ingest time, stored in a graph
database and shown in a topology map
Highly Scalable Real Time Back End – designed for infinite horizontal scalability,
high ingest rate and low latency queries of metrics and relationships
Continuous Data Transformation – into a form usable by BI tools
Open Query Architecture – all data and topologies are accessible through
ODBC/JDBC
Easily Extensible User Interface - user interface (dashboards) built in the
leading BI tool (Tableau)
OpsDataStore Object Model – Organizing Streams
of IT Operations Data
Transaction
Application
Tier
Virtual
Server
ClusterData
Store
Data
Center
Tenant
Transaction Transaction
Physical
Server
Objects, Metrics, Configuration Items, and Relationships through Time
Real-Time QueryContinuous
Processing
Continuous
Ingest
OpsDataStore Product Architecture
Graph Database & Low Latency Scale Out Time Series Database
Streaming Writes
Object Model
Data Collector SDK
Errors
Capacity
UtilizationThroughput
Response TimeConfiguration
ExtraHop
AnyDataSource
IntelDCM
Dynatrace
AppDynamics
Query
VMware
ODBC API
RAM DB
Data Transformation
Aggregation
Statistical Computation
Baselining
Anomaly Detection JDBC API
Query
End-to-End Topology Map for Every Component
Metrics from the Transaction to the Datastore
Find Infrastructure Issues that Impact Applications
Your Data Your Way in Tableau
Build live
dashboards
in minutes
in your
choice of BI
tool
Empower
requesters
of IT data
with self-
service
Improve IT
decisions
Scalable and Automated Capacity Analytics
Use Cases for OpsDataStore
• Platform for IT Operations Analytics
• Platform for end-to-end (transaction to hardware)
monitoring and troubleshooting
• Platform for real-time and continuous capacity analysis
• Platform for live Custom IT Dashboards
Questions?
www.opsdatastore.com
bernd@opsdatastore.com
Send me an email for
a copy of the slides
Please give us your feedback—Session T15450
• Complete the online survey you'll receive via
email later today or via text at:
Text this number: 878787
Text this word: APPSPHERE
• Every time you submit a session survey, your
name will be entered in a random drawing.
We're giving away Amazon Echos
to 5 lucky winners!
• Thank you for your input
APPDYNAMICS CONFIDENTIAL AND PROPRIETARY 27
Win!
Thank you

Click to Disk Troubleshooting with AppDynamics and OpsDataStore - AppSphere16

  • 1.
    Transaction (Click) toDisk Troubleshooting with AppDynamics and OpsDataStore Bernd Harzog Founder and CEO
  • 2.
    My History withAppDynamics – Confidant and Fan Strategy Consultant Product Selection Consultant
  • 3.
    Questions for You Doeseverything work as well as it is supposed to all of the time? Is your understanding of your infrastructure performance as robust as is your understanding of your application performance? Would you be interested in understanding infrastructure performance in the context of transaction performance?
  • 4.
    What Has NotWorked?
  • 5.
    Blind Dinosaurs! = Frameworks madea promise that could not be kept – that one product can monitor everything Frameworks are out of date with respect to current application and infrastructure environments Frameworks stand no chance of keeping up with the accelerating pace of innovation Best of breed tools are replacing the frameworks Blind Dinosaur
  • 6.
    -2.5% -4.5% -2.0% -5.0% Flat +3.0% 11% share (ofa $20B market) lost by the Big 4 went to new best of breed vendors (creating the problem OpsDataStore solves) -14.0%
  • 7.
    Best of BreedResults in Franken-Monitors! Franken-Monitors are redundant siloed management tools that do not integrate with each other and that each store their data in their own proprietary datastores Franken-Monitors happened because customers bought best of breed point tools to address gaps left by IBM, BMC, HP and CA Franken-Monitors cannot cope with the rapid pace of change driven by Agile, DevOps, and hybrid/private clouds Franken-Monitors make it impossible for management to keep up with the pace of innovation With Franken-Monitors there is no architecture for management and monitoring How many monitoring tools do you own that produce valuable metrics about an aspect of your environment? Network Monitor Storage Monitor Application Monitor Server Monitor Virtualization Monitor OS Monitor IT Operations Log Monitor
  • 8.
    This problem isbecoming more important to solve and more challenging to solve over time Diversity and rapid change at the application layer Pressure to respond to the business DevOps and Agile More languages and run times More Layers of Abstraction The JVM (the first one) Server virtualization Network virtualization Storage virtualization Docker The Cloud Dynamic and scaled out infrastructure Constant change in the virtualized server, network and storage layers Automation Your Cloud Public CloudHybrid Cloud
  • 9.
    Data Driven ITOperations to the Rescue
  • 10.
    The Architecture forData Driven IT Operations Physical and Virtual Storage Instrumentation Physical and Virtual Server Instrumentation Physical and Virtual Network Instrumentation Operating System Instrumentation Application and Transaction Instrumentation Data Sources Live Custom Dashboards – Specific to use cases, domains, and user requirements – Choice of BI ToolsVisualization End-to-End Monitoring Capacity Analytics Automated Root Cause Automated Remediation IT Operations Analytics Cost Management Use Cases Data Driven IT Operations OpsDataStore Data Platform Data Types Data from Management API’s Agent Data Wire Data Synthetic Data Manual and Configuration Data (CMDB)
  • 11.
    The New MetricCollection Requirements Continuous – Near Real Time – Streaming – Coarse grained intervals (minutes) no longer frequent enough Consistent – Gaps in metric collection are no longer acceptable Deterministic – Rolled up averages are dangerously misleading Accurate – measurement bias (i.e., time shifting) no longer tolerable Efficient – not influenced by the metric collection process – “outside-in” observation preferable
  • 12.
    Instrument for Responsetime (Latency), Throughput and Congestion at Every Layer Storage Array Router/WAN Network Server OS Hypervisor Virtualization Data Sources Transaction and application response time and throughput CPU, memory, network and disk contention (queuing) CPU, memory, network, and disk contention (queuing) Network performance and behavior of network users (apps) WAN performance and End User Experience Latency, throughput and contention Application OpsDataStore • IT Operations Analytics • Performance Management • Capacity Management • Service Troubleshooting • Live Custom IT Dashboards
  • 13.
    Evaluate Metrics basedupon their Value, Breadth of Applicability and Cost to Implement LowValueoftheMetricHigh Narrow Breadth of Applicability Ubiquitous Open Source/Free $ $$ Application Server Datastore Dynatrace AppDynamics Coda Hale, StatsD Corvil Intel DCM Network SNMP VMware VASA Datastore HW Netflow VMware vCenter CollectD ExtraHop (STD) ExtraHop (ITR) CollectD (PL)
  • 14.
    The Solution OpsDataStore The Real-TimePlatform for Data Driven IT Operations
  • 15.
    OpsDataStore – SolutionOverview Live Custom IT Dashboards Cross-Stack & End-To- End Troubleshooting Real-Time Fabric for Data Driven IT Operations Continuous Capacity Optimization
  • 16.
    OpsDataStore Ecosystem Strategy OpsDataStore Cirba NPMCloud Auto AutomationOps Mgmt. App Perf. Mgmt.Platforms Sevone VMware ApptioRiverbed ServiceNowVMware Riverbed Dell/EMC Puppet VMware New Relic Virtual Inst. Linux AppDynamics Moogsoft Arista Dell Cisco UCS Nutanix GigaMon Red Hat Chef VMTurbo Dynatrace Prelert GigaMonWindows GigaMon INETCO CSCNagios AppNeta AppEnsure Big Panda CSCEMC Mirantis Ansible Apteligent NetuitiveExtraHop NetApp Kentik Analytics Cost Mgmt. Service Mgmt.IPM Zenoss Zabbix Corvil ExtraHop
  • 17.
    Key OpsDataStore Features OpenIngest – collect data from any platform, management tool or API Dynamic Object Model – all data is related at ingest time, stored in a graph database and shown in a topology map Highly Scalable Real Time Back End – designed for infinite horizontal scalability, high ingest rate and low latency queries of metrics and relationships Continuous Data Transformation – into a form usable by BI tools Open Query Architecture – all data and topologies are accessible through ODBC/JDBC Easily Extensible User Interface - user interface (dashboards) built in the leading BI tool (Tableau)
  • 18.
    OpsDataStore Object Model– Organizing Streams of IT Operations Data Transaction Application Tier Virtual Server ClusterData Store Data Center Tenant Transaction Transaction Physical Server Objects, Metrics, Configuration Items, and Relationships through Time
  • 19.
    Real-Time QueryContinuous Processing Continuous Ingest OpsDataStore ProductArchitecture Graph Database & Low Latency Scale Out Time Series Database Streaming Writes Object Model Data Collector SDK Errors Capacity UtilizationThroughput Response TimeConfiguration ExtraHop AnyDataSource IntelDCM Dynatrace AppDynamics Query VMware ODBC API RAM DB Data Transformation Aggregation Statistical Computation Baselining Anomaly Detection JDBC API Query
  • 20.
    End-to-End Topology Mapfor Every Component
  • 21.
    Metrics from theTransaction to the Datastore
  • 22.
    Find Infrastructure Issuesthat Impact Applications
  • 23.
    Your Data YourWay in Tableau Build live dashboards in minutes in your choice of BI tool Empower requesters of IT data with self- service Improve IT decisions
  • 24.
    Scalable and AutomatedCapacity Analytics
  • 25.
    Use Cases forOpsDataStore • Platform for IT Operations Analytics • Platform for end-to-end (transaction to hardware) monitoring and troubleshooting • Platform for real-time and continuous capacity analysis • Platform for live Custom IT Dashboards
  • 26.
  • 27.
    Please give usyour feedback—Session T15450 • Complete the online survey you'll receive via email later today or via text at: Text this number: 878787 Text this word: APPSPHERE • Every time you submit a session survey, your name will be entered in a random drawing. We're giving away Amazon Echos to 5 lucky winners! • Thank you for your input APPDYNAMICS CONFIDENTIAL AND PROPRIETARY 27 Win!
  • 28.