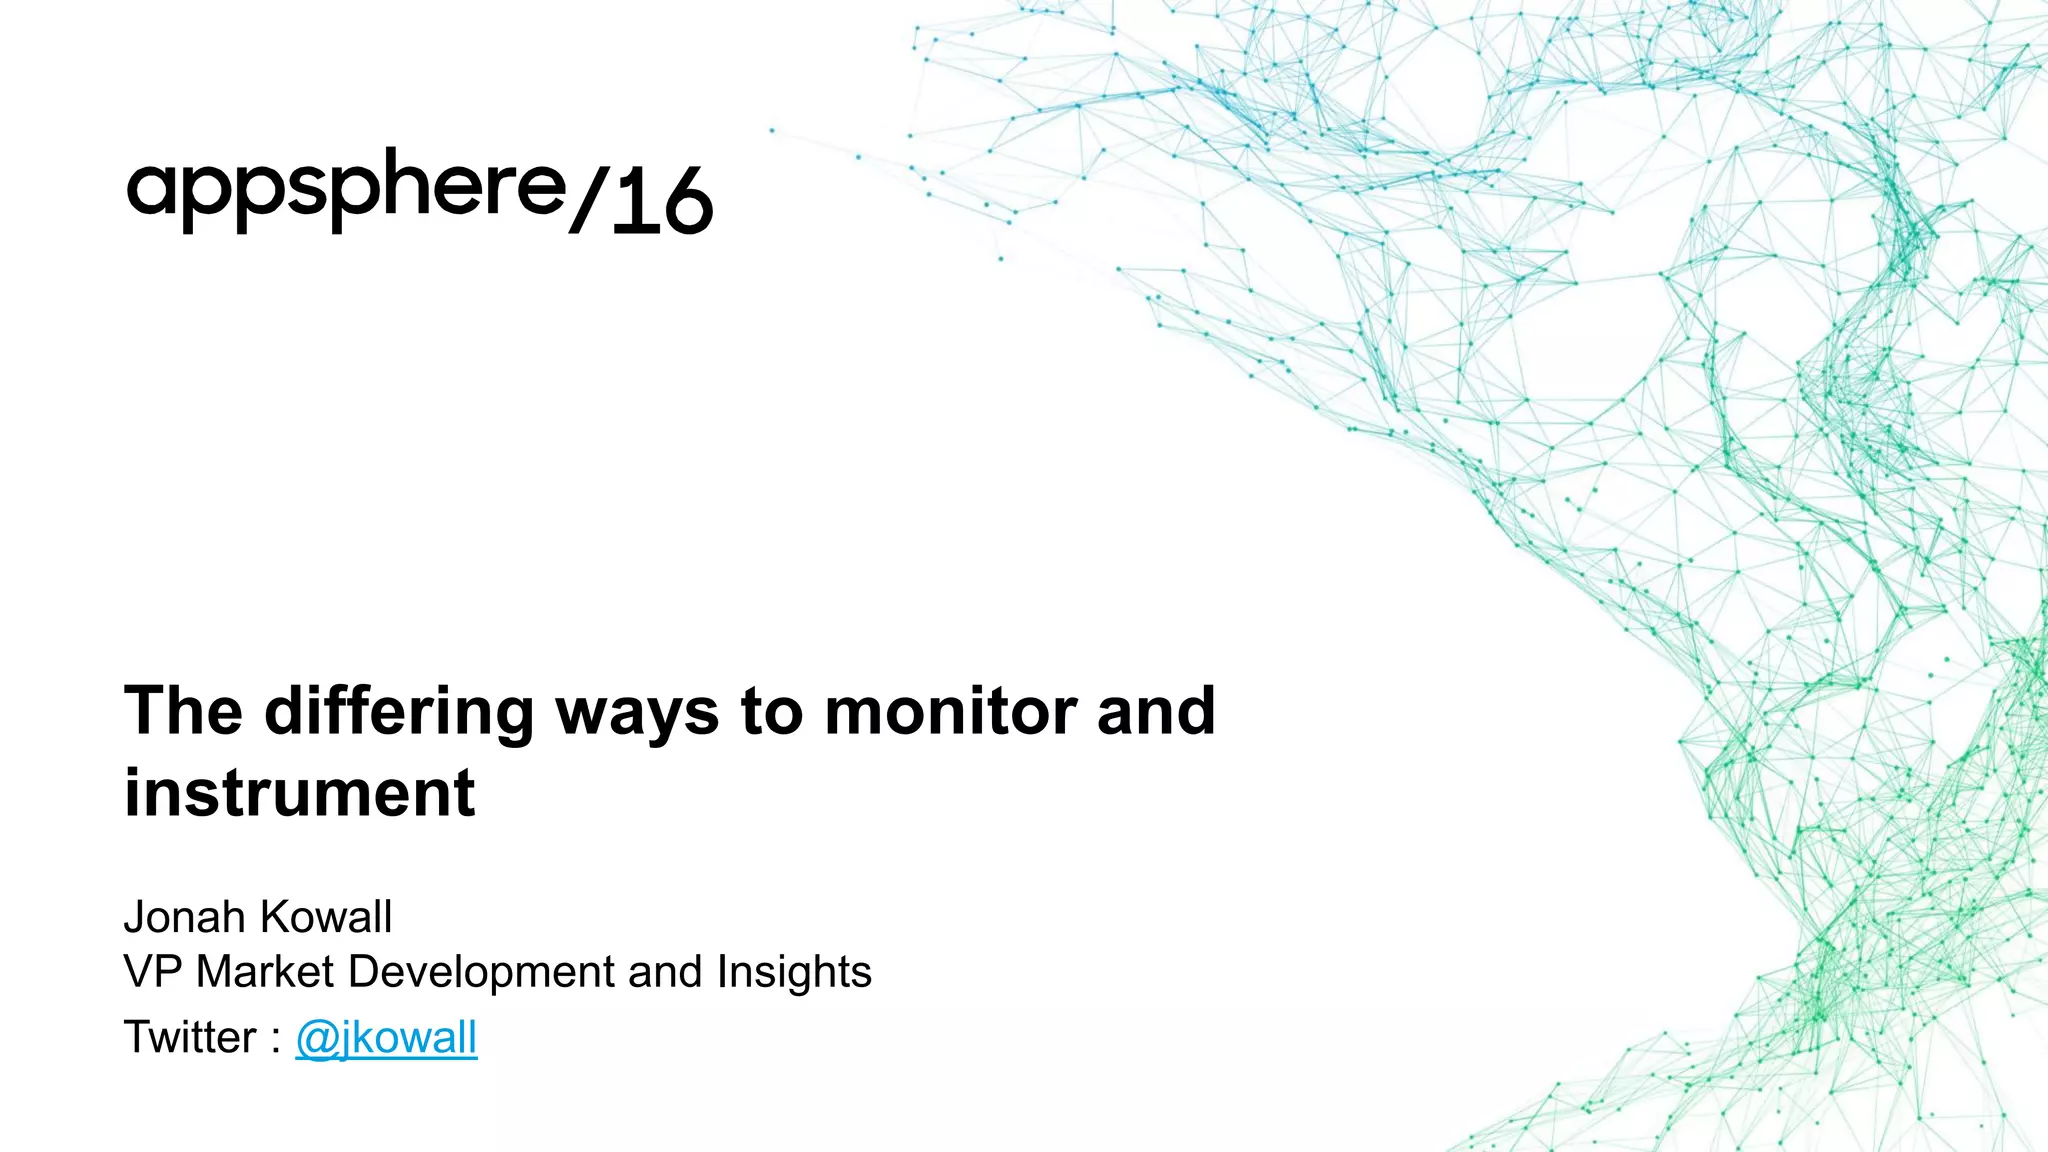
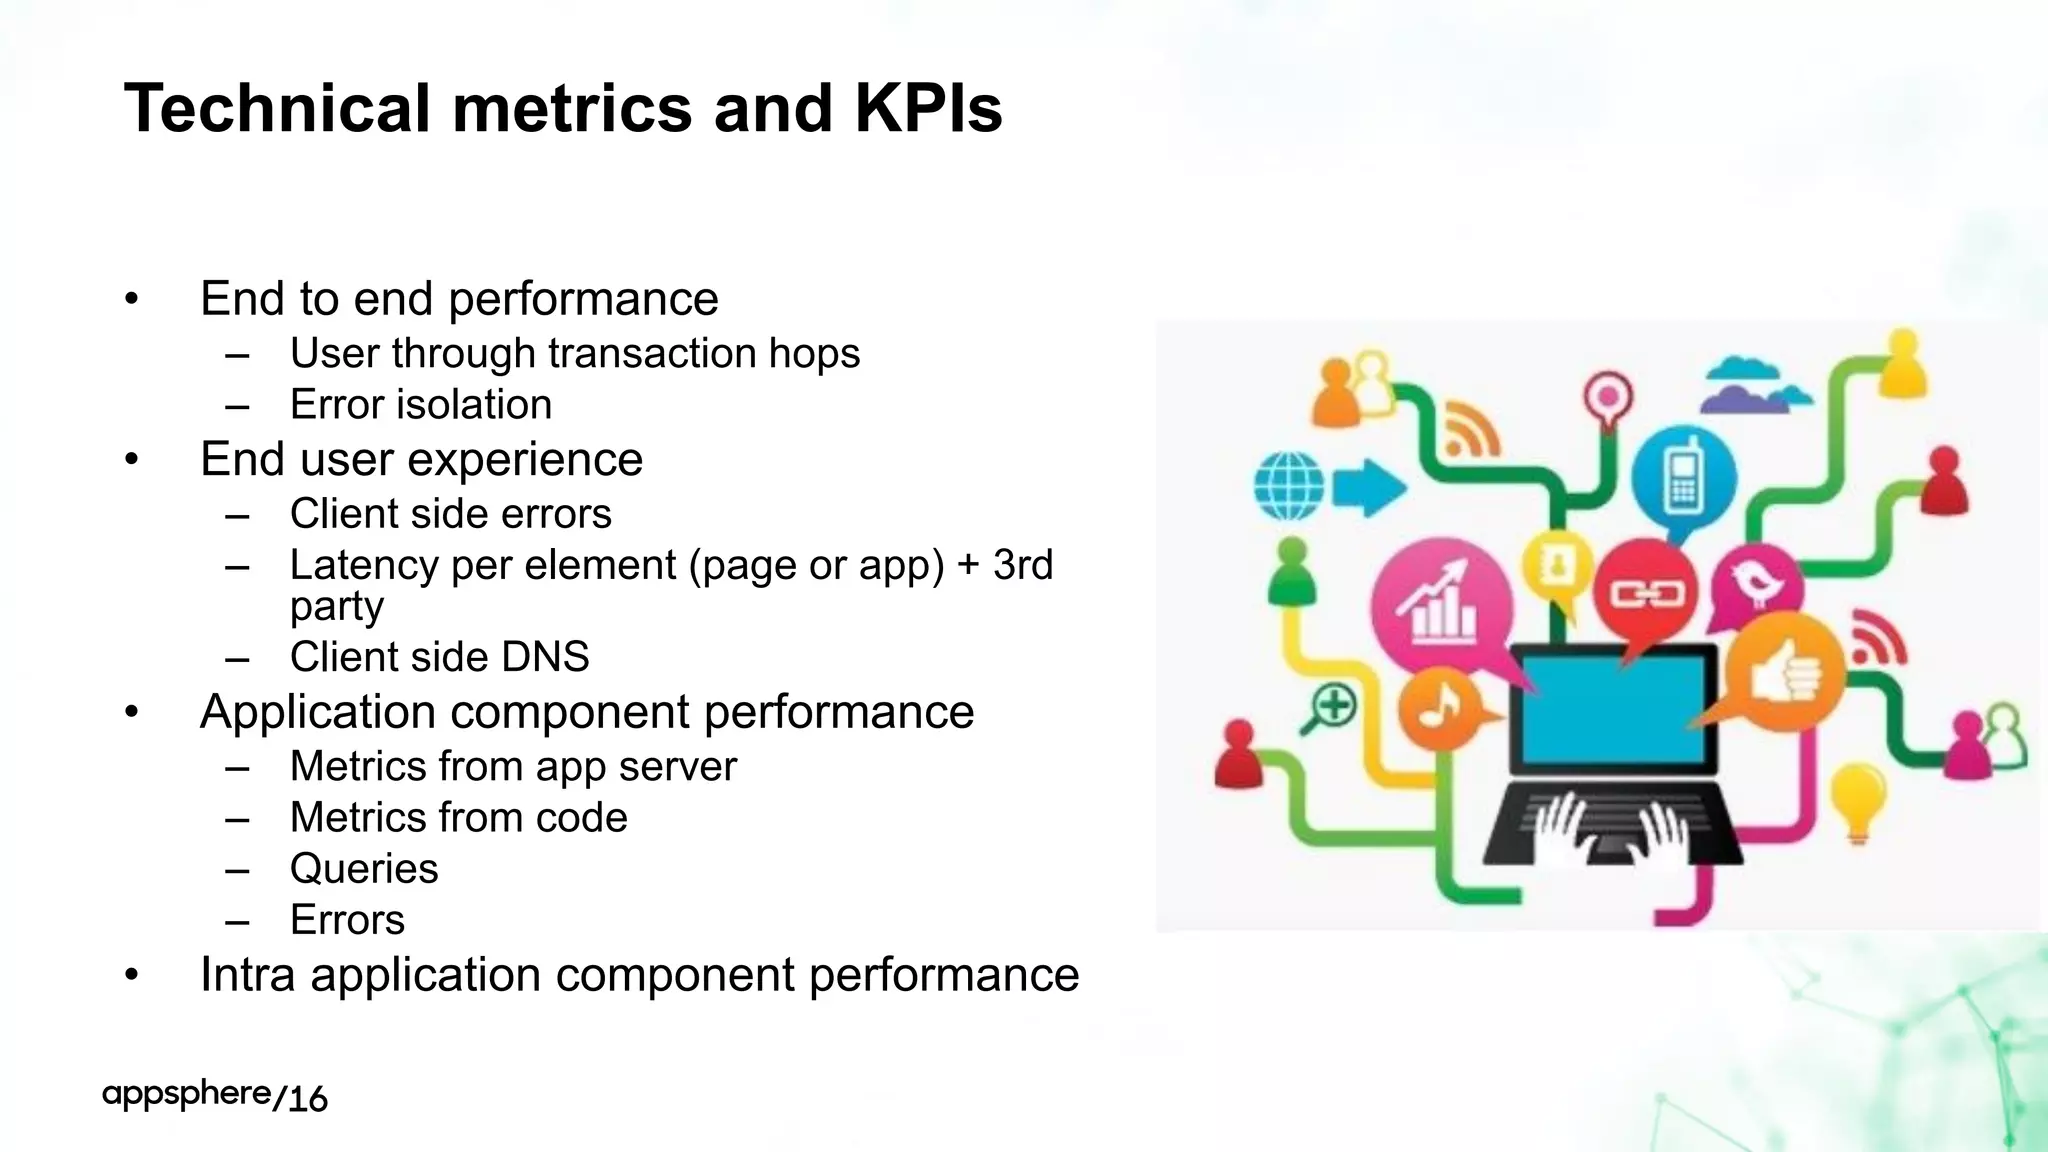
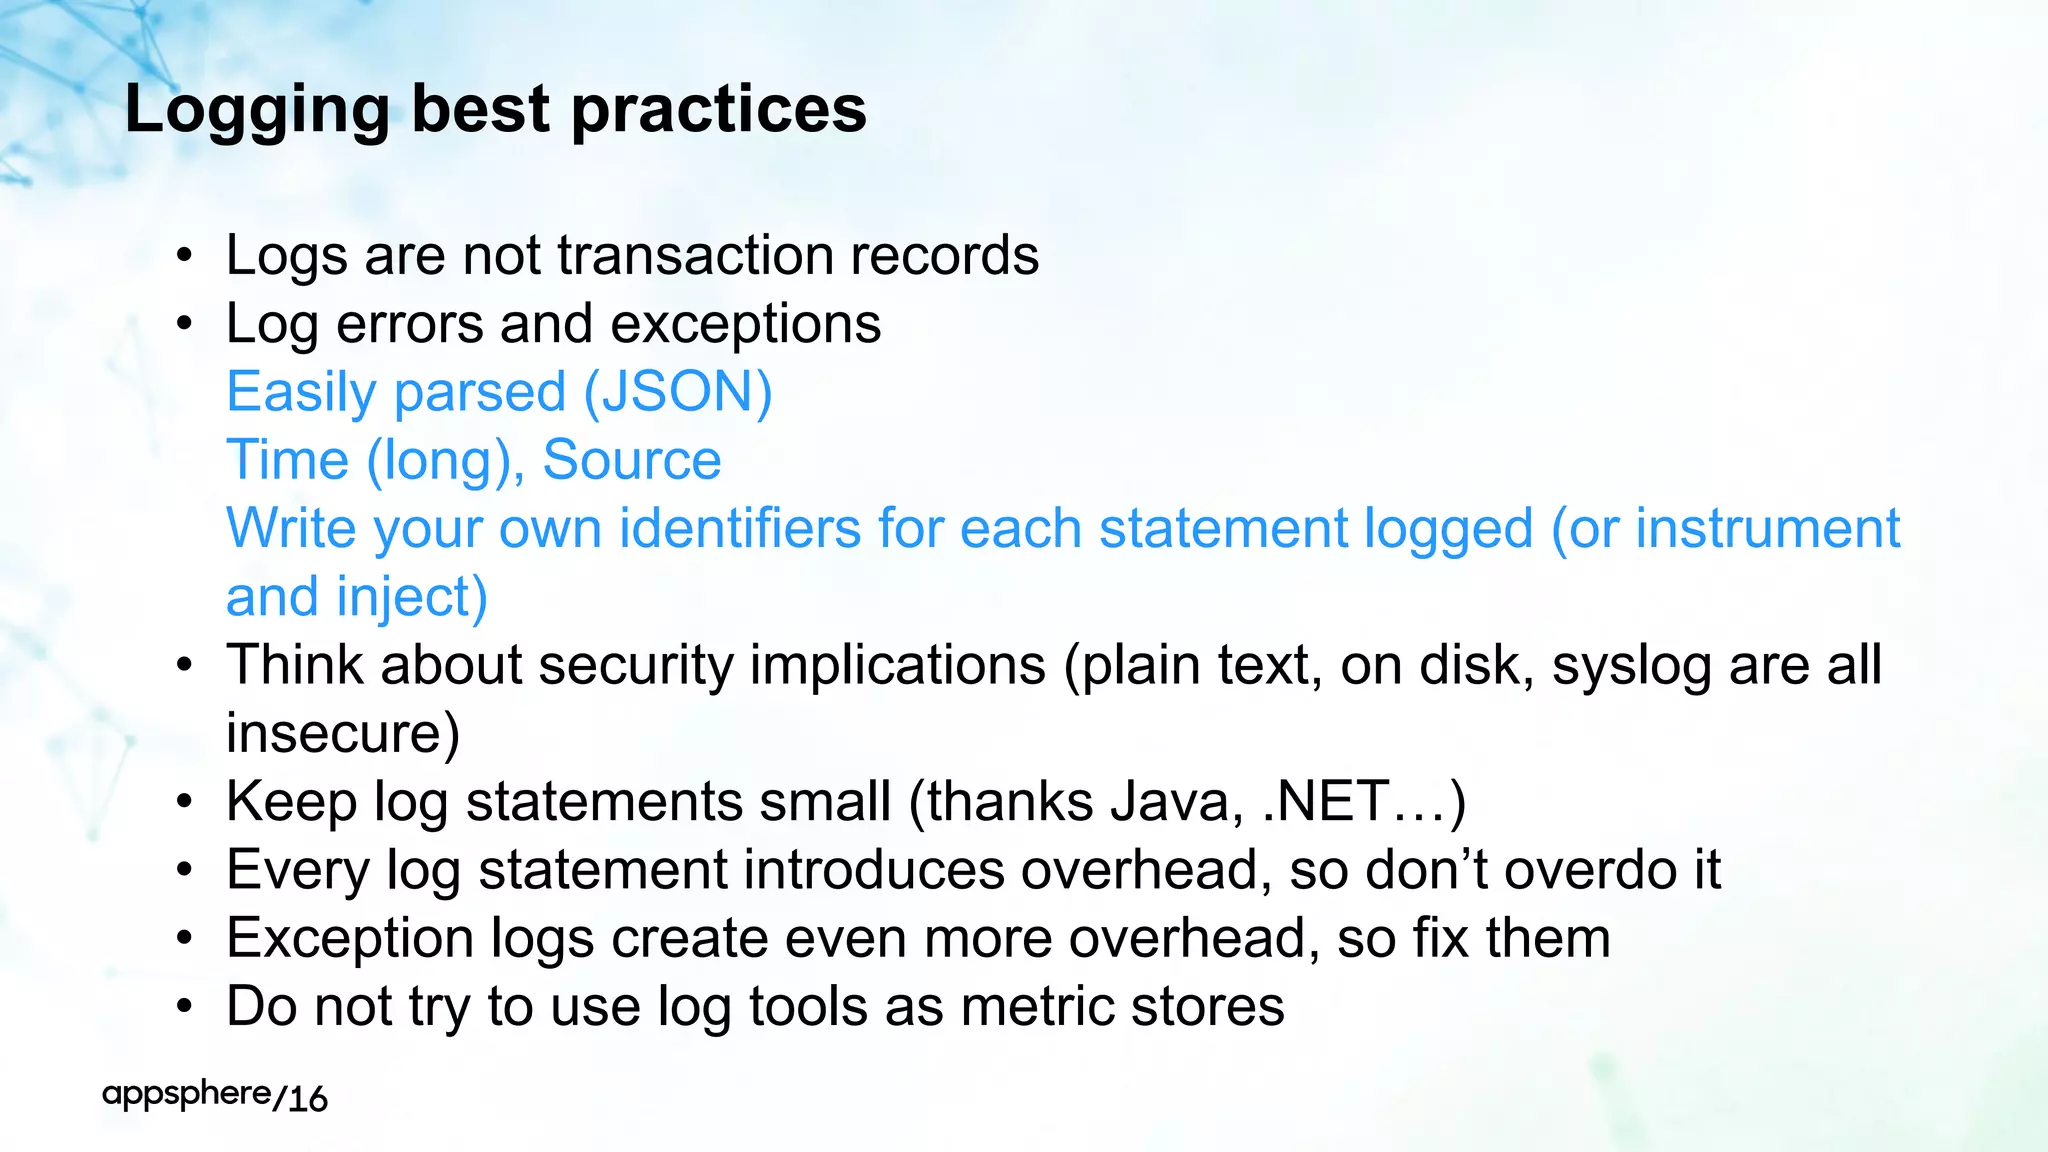
![Monkey patching
Wikipedia relevant definition:
In Ruby,[3] Python,[4] and many other dynamic
programming languages... dynamic modifications of a
class or module at runtime, motivated by the intent to
patch existing third-party code as a workaround to a
bug or feature which does not act as desired
Disclaimer : Can be very dangerous, hard to maintain
• Replace methods / attributes / functions at runtime
• Apply a patch at runtime to the objects in memory,
instead of the source code on disk;](https://image.slidesharecdn.com/t8455-kowall-161123000824/75/Monitoring-and-Instrumentation-Strategies-Tips-and-Best-Practices-AppSphere16-23-2048.jpg)
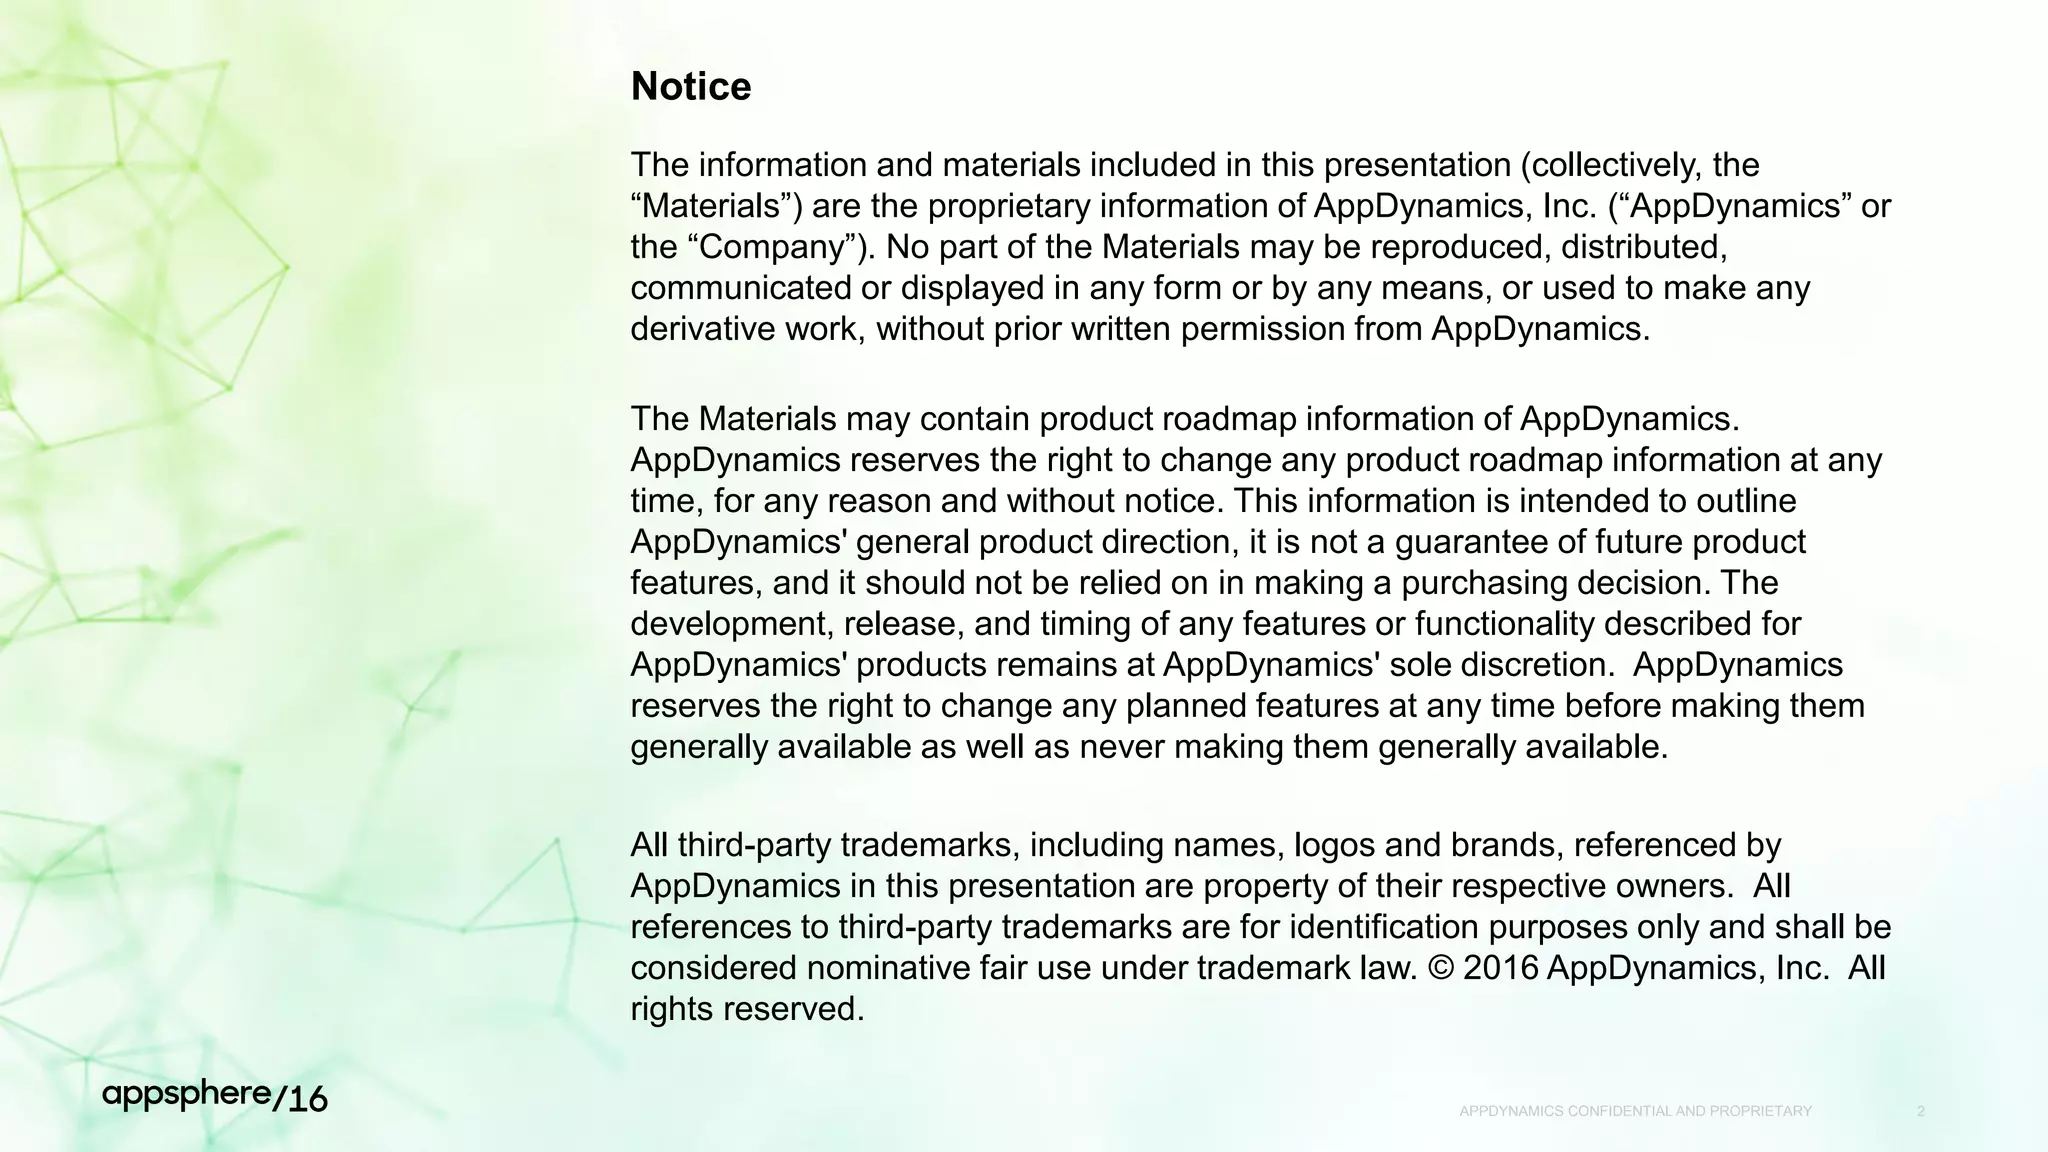
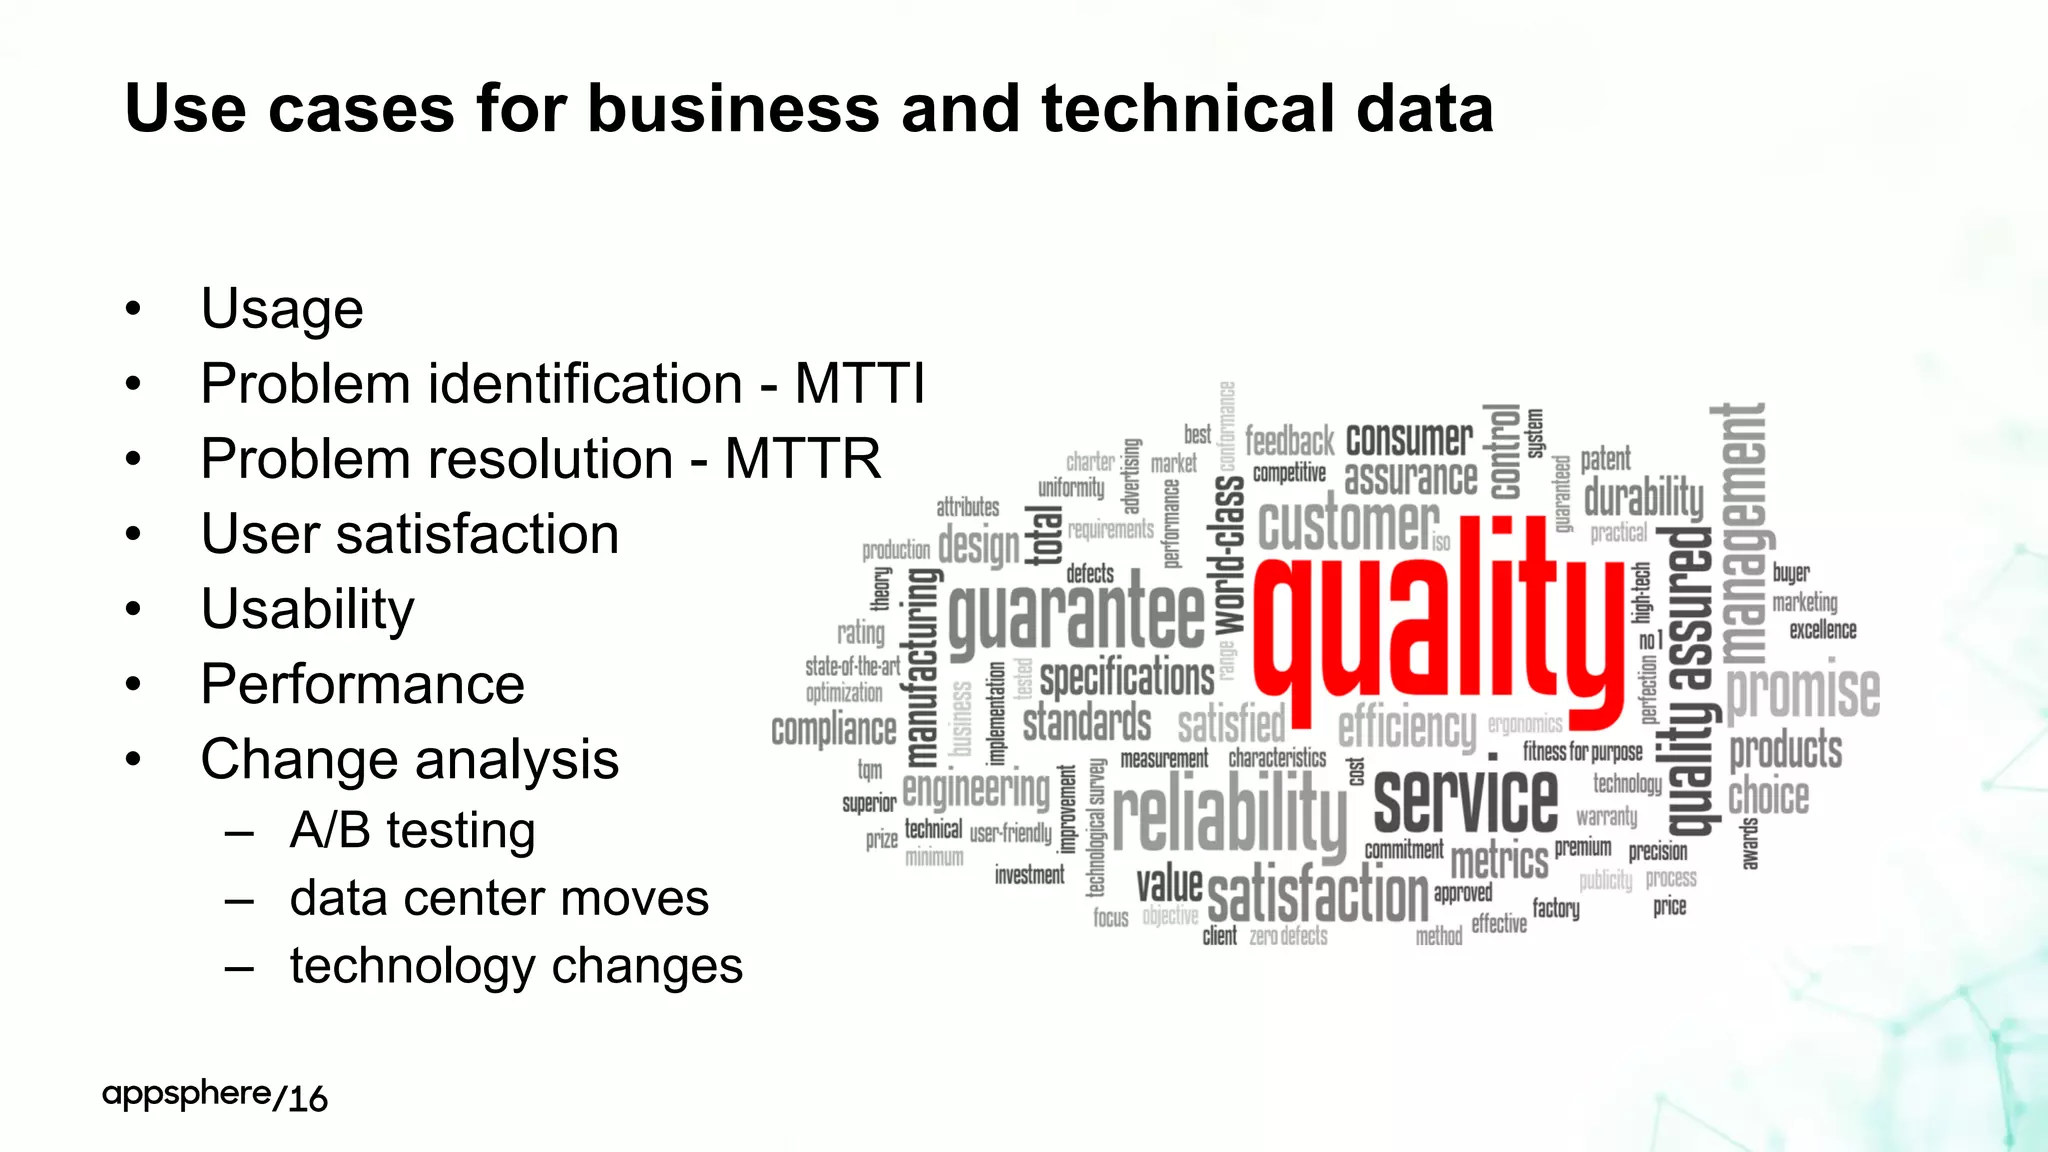
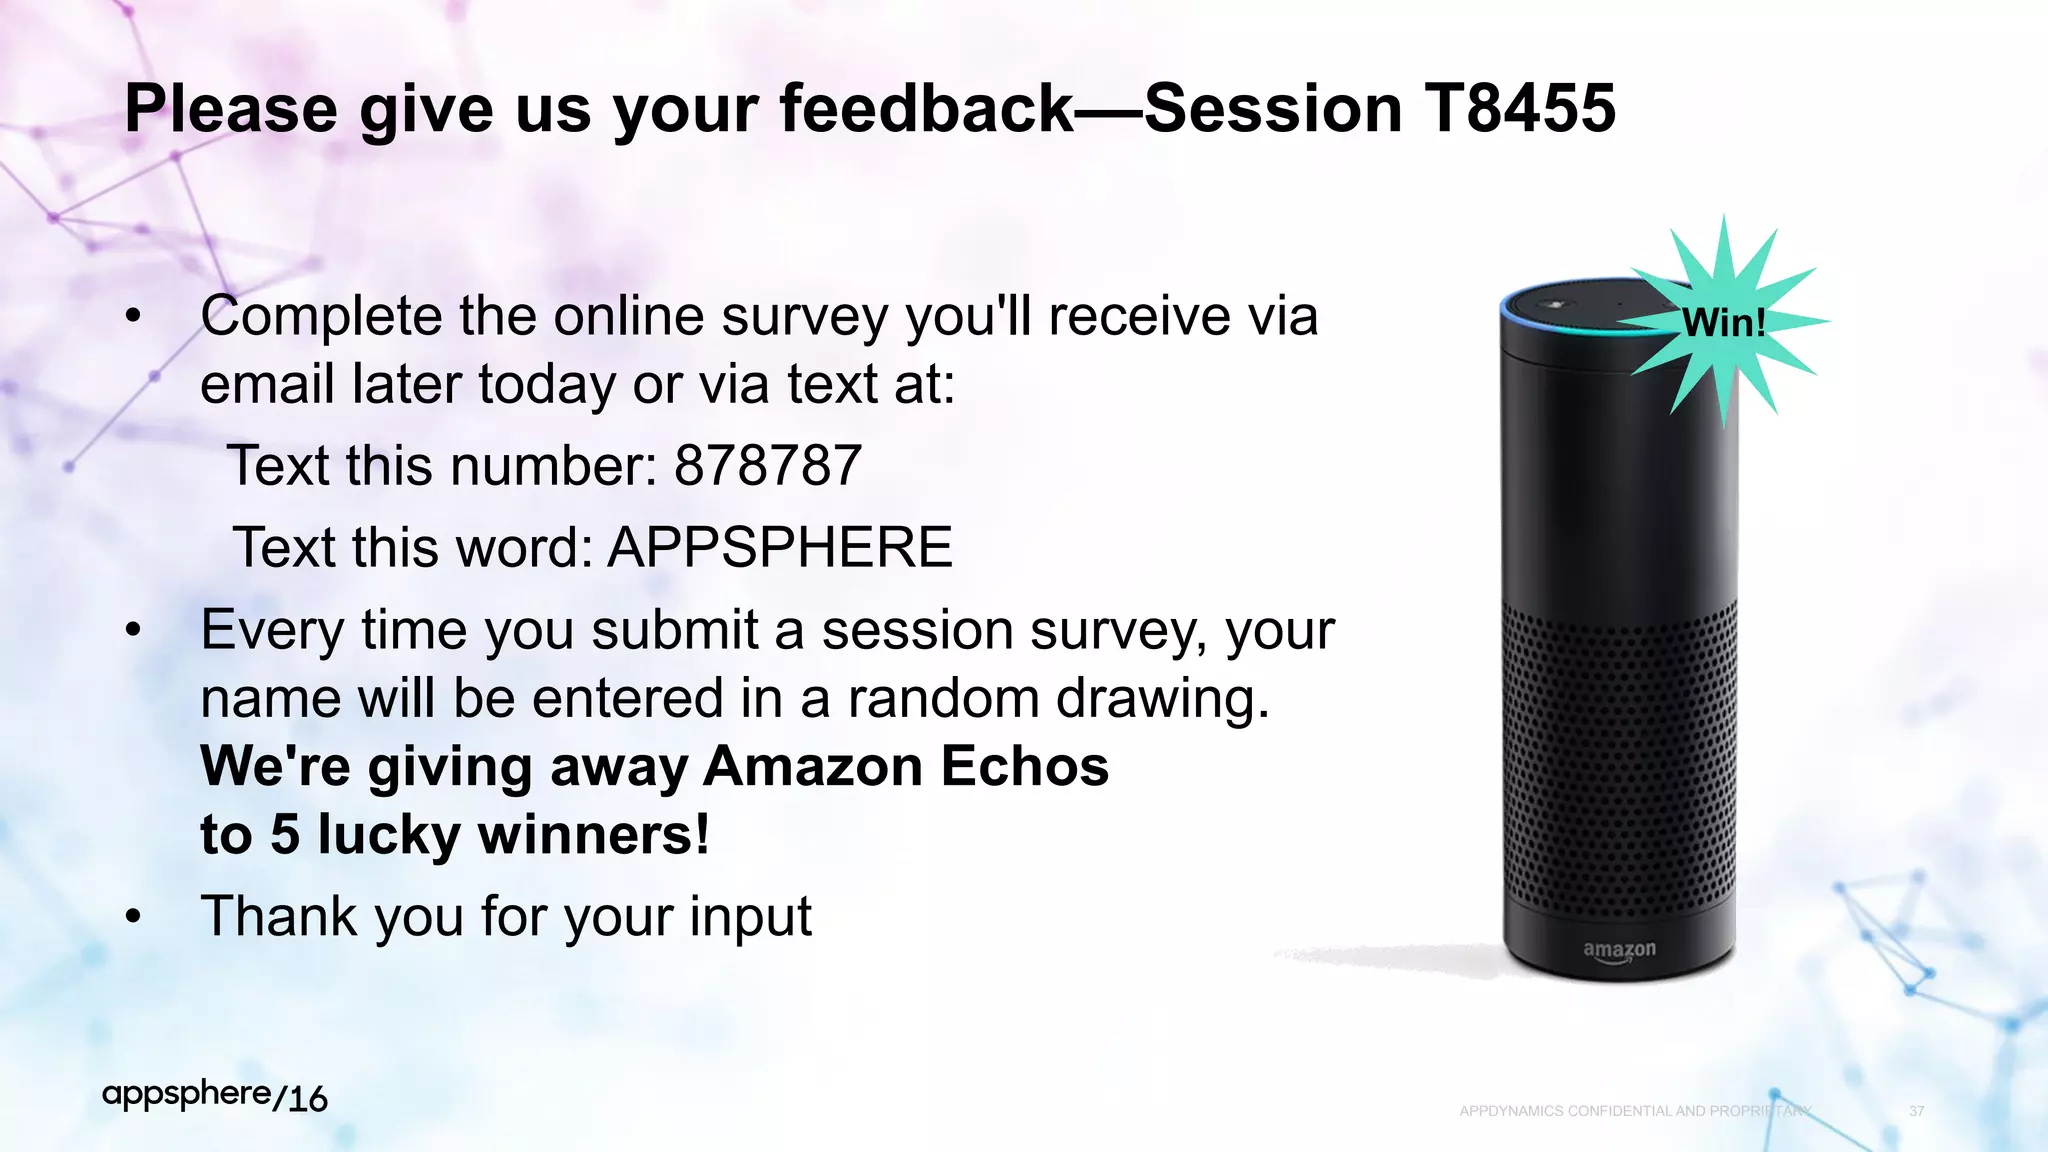
![Correlation in logs
• Log every transaction segment
• Persist a GUID or transaction ID
• This is very difficult in large teams
• Inefficient to analyze and pull metrics from logs
• Doesn’t work unless you own the code
[code]
PERF,2013-04-03 11:29:52.640,external,0x123456,NA,service1,MyAPP,jimmy,NA,336,NA,NA
INFO,2013-04-03 11:29:53.189,internal,789012,0x123456,service2,TheirApp,jimmy,NA,174,NA,NA
INFO,2013-04-03 11:29:52.892,internal,345678,789012,service3,TheirApp,jimmy,NA,163,NA,NA
[/code]](https://image.slidesharecdn.com/t8455-kowall-161123000824/75/Monitoring-and-Instrumentation-Strategies-Tips-and-Best-Practices-AppSphere16-35-2048.jpg)
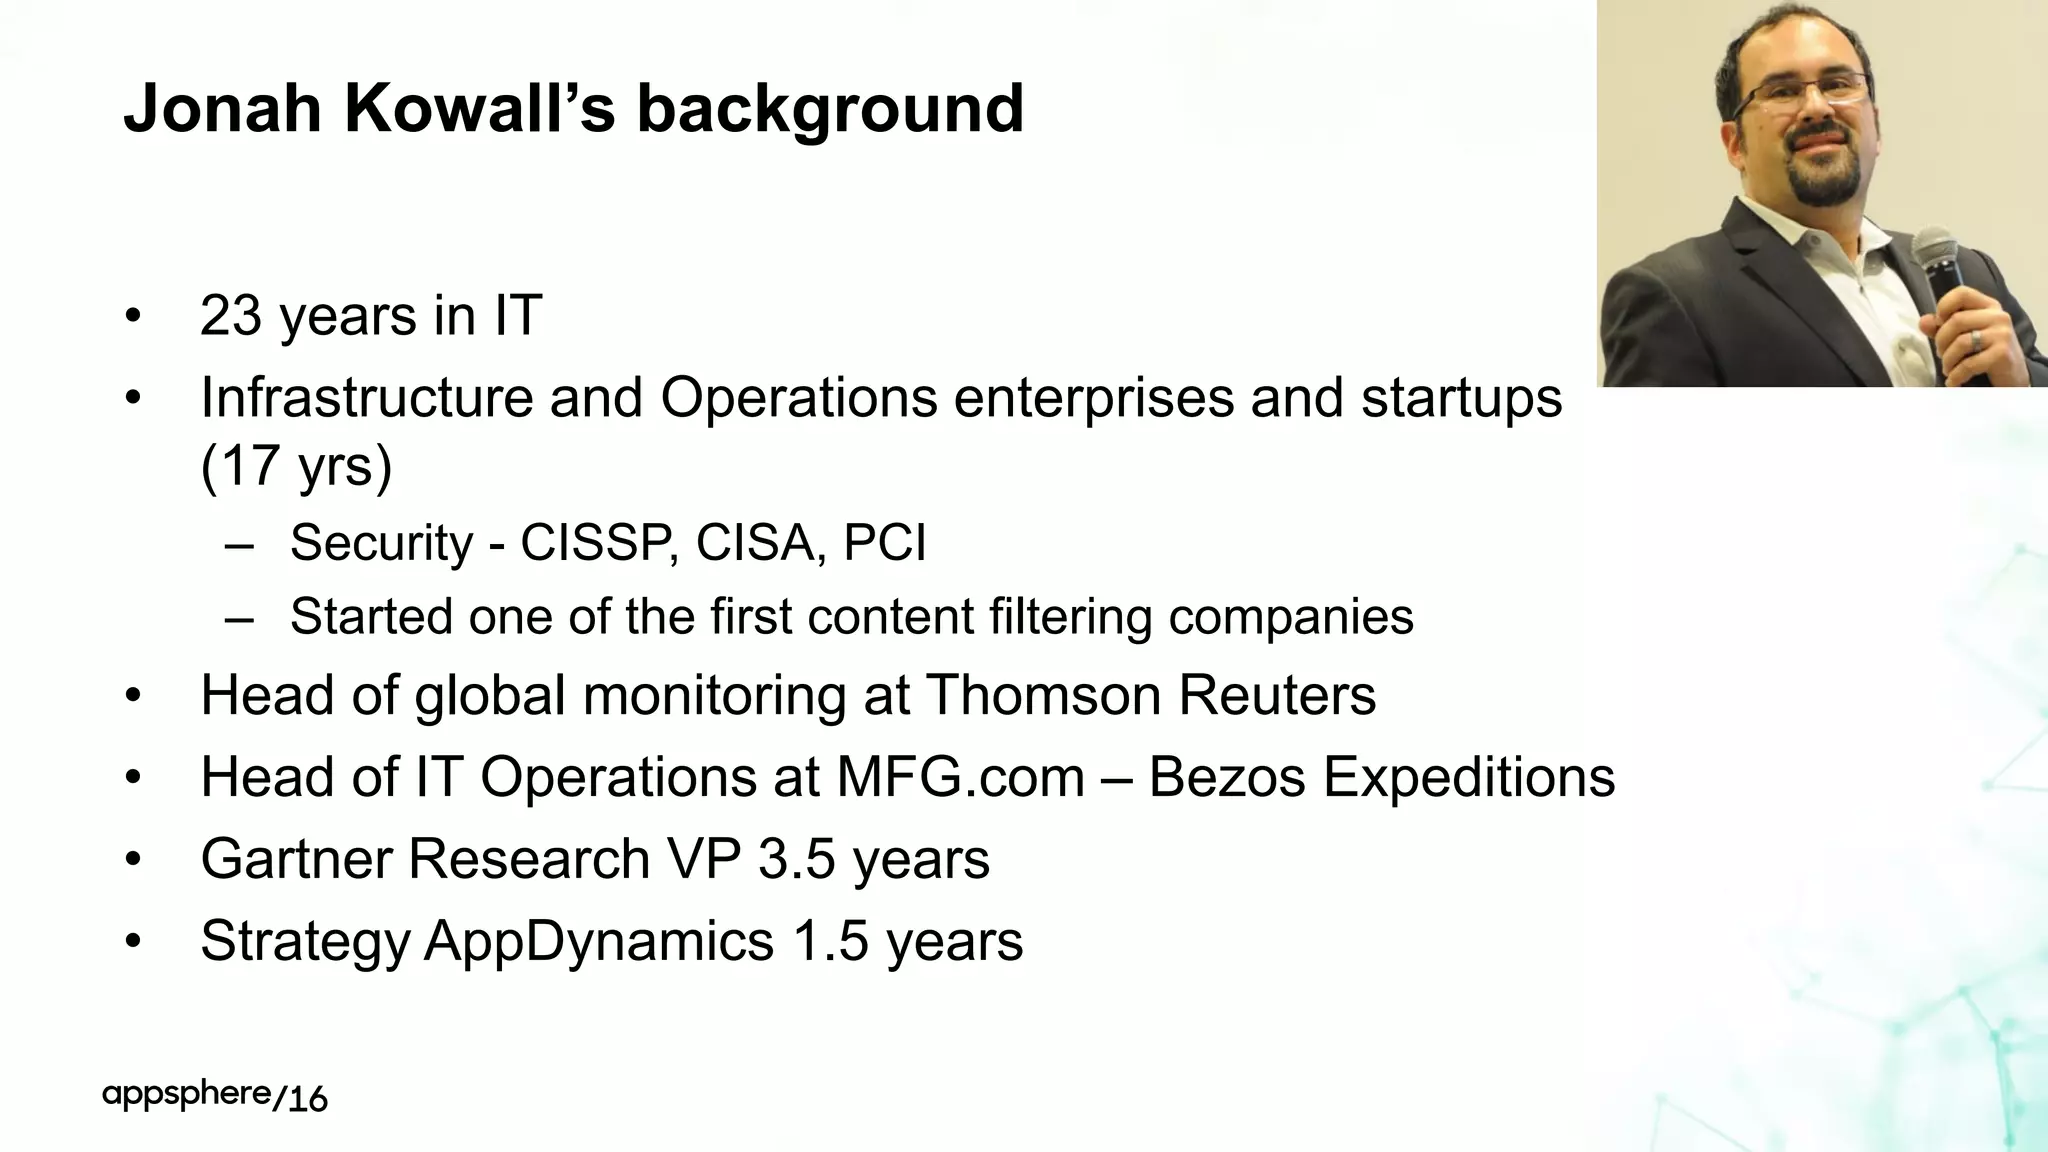
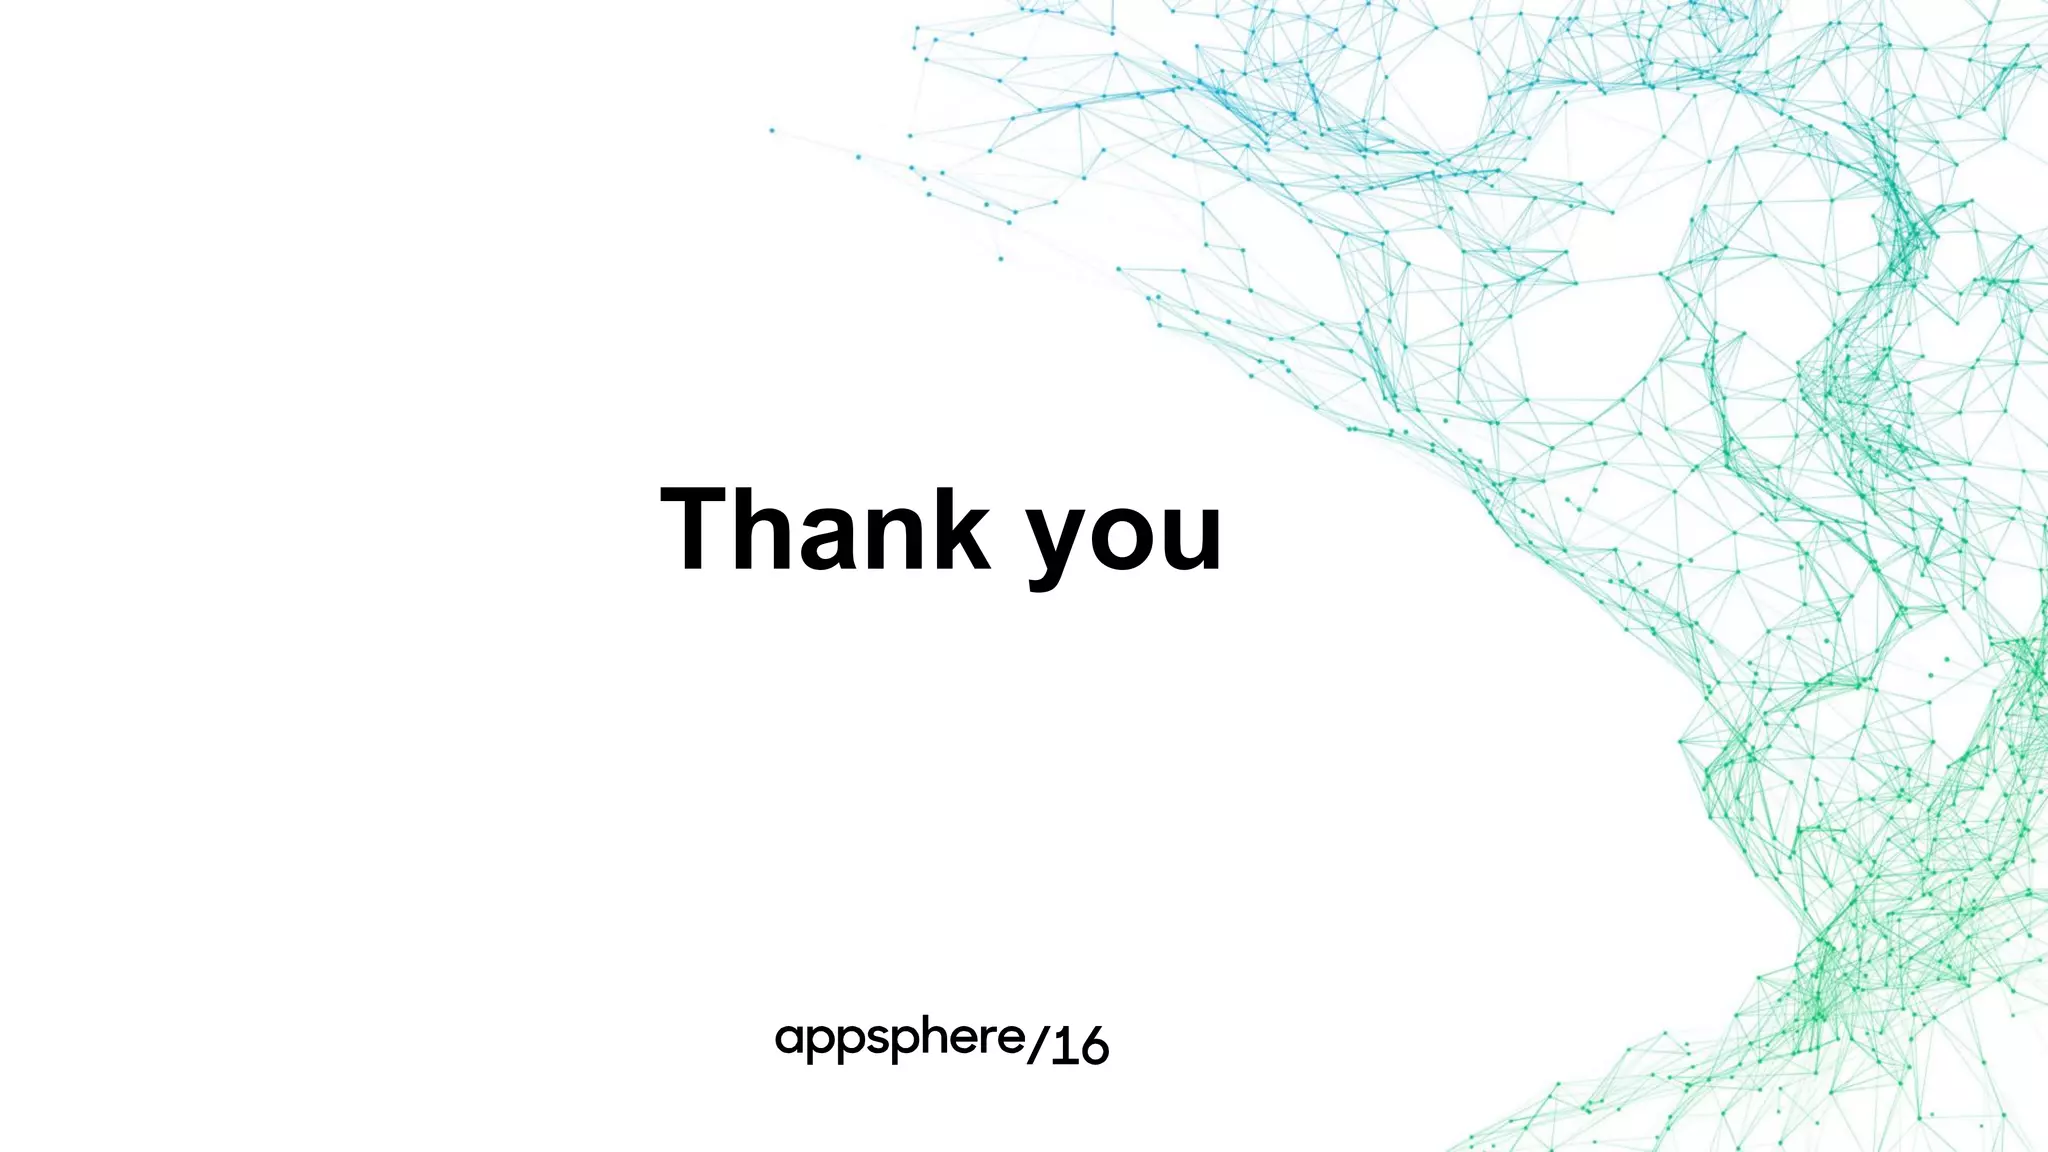
![Transaction correlation and logs!
• Many integrations across APM
and Log vendors
• Can add correlation in code
and use any log tool
– ex: [%X{AD.requestGUID}]
• We auto inject and correlate
(one platform)](https://image.slidesharecdn.com/t8455-kowall-161123000824/75/Monitoring-and-Instrumentation-Strategies-Tips-and-Best-Practices-AppSphere16-36-2048.jpg)

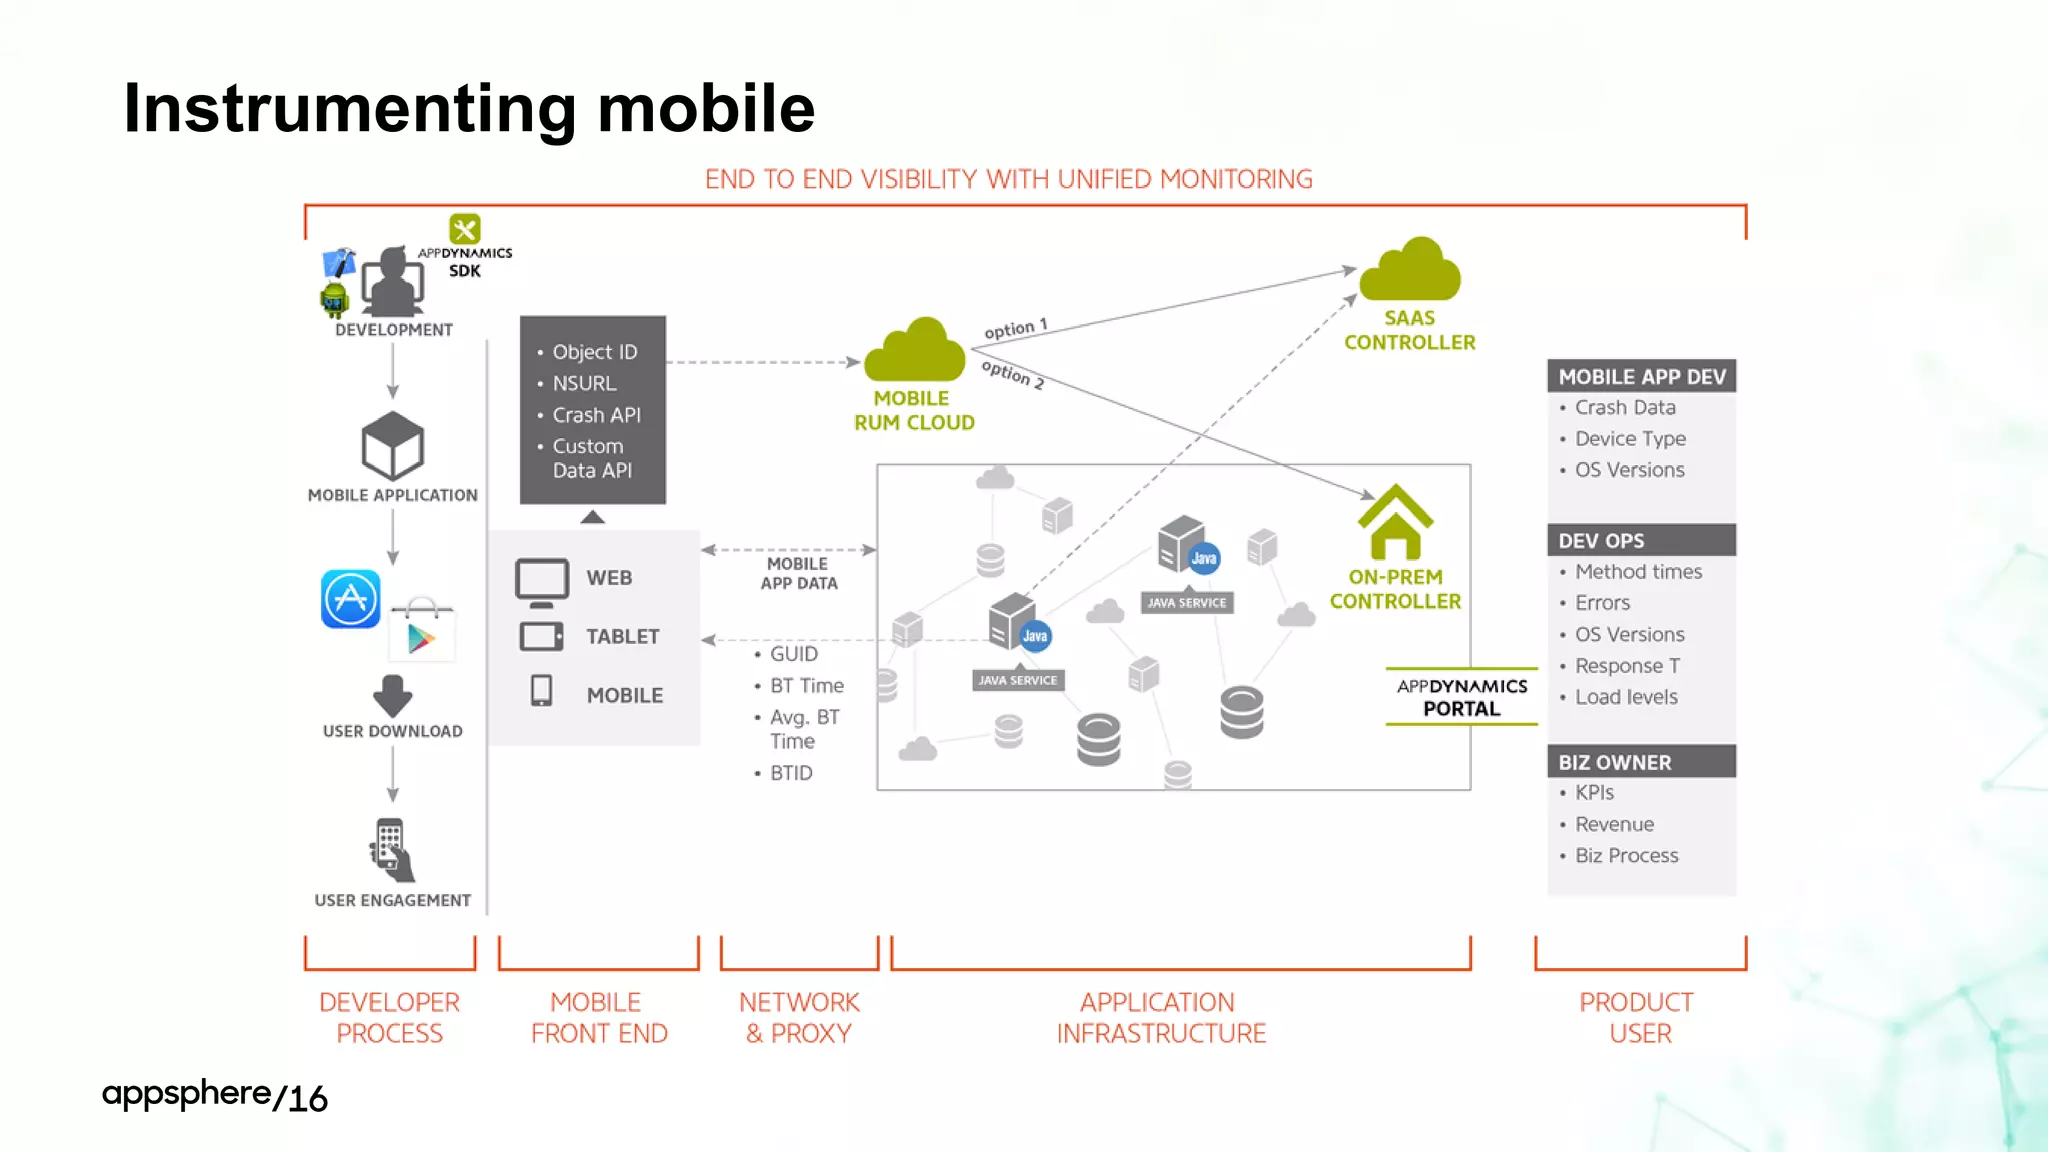
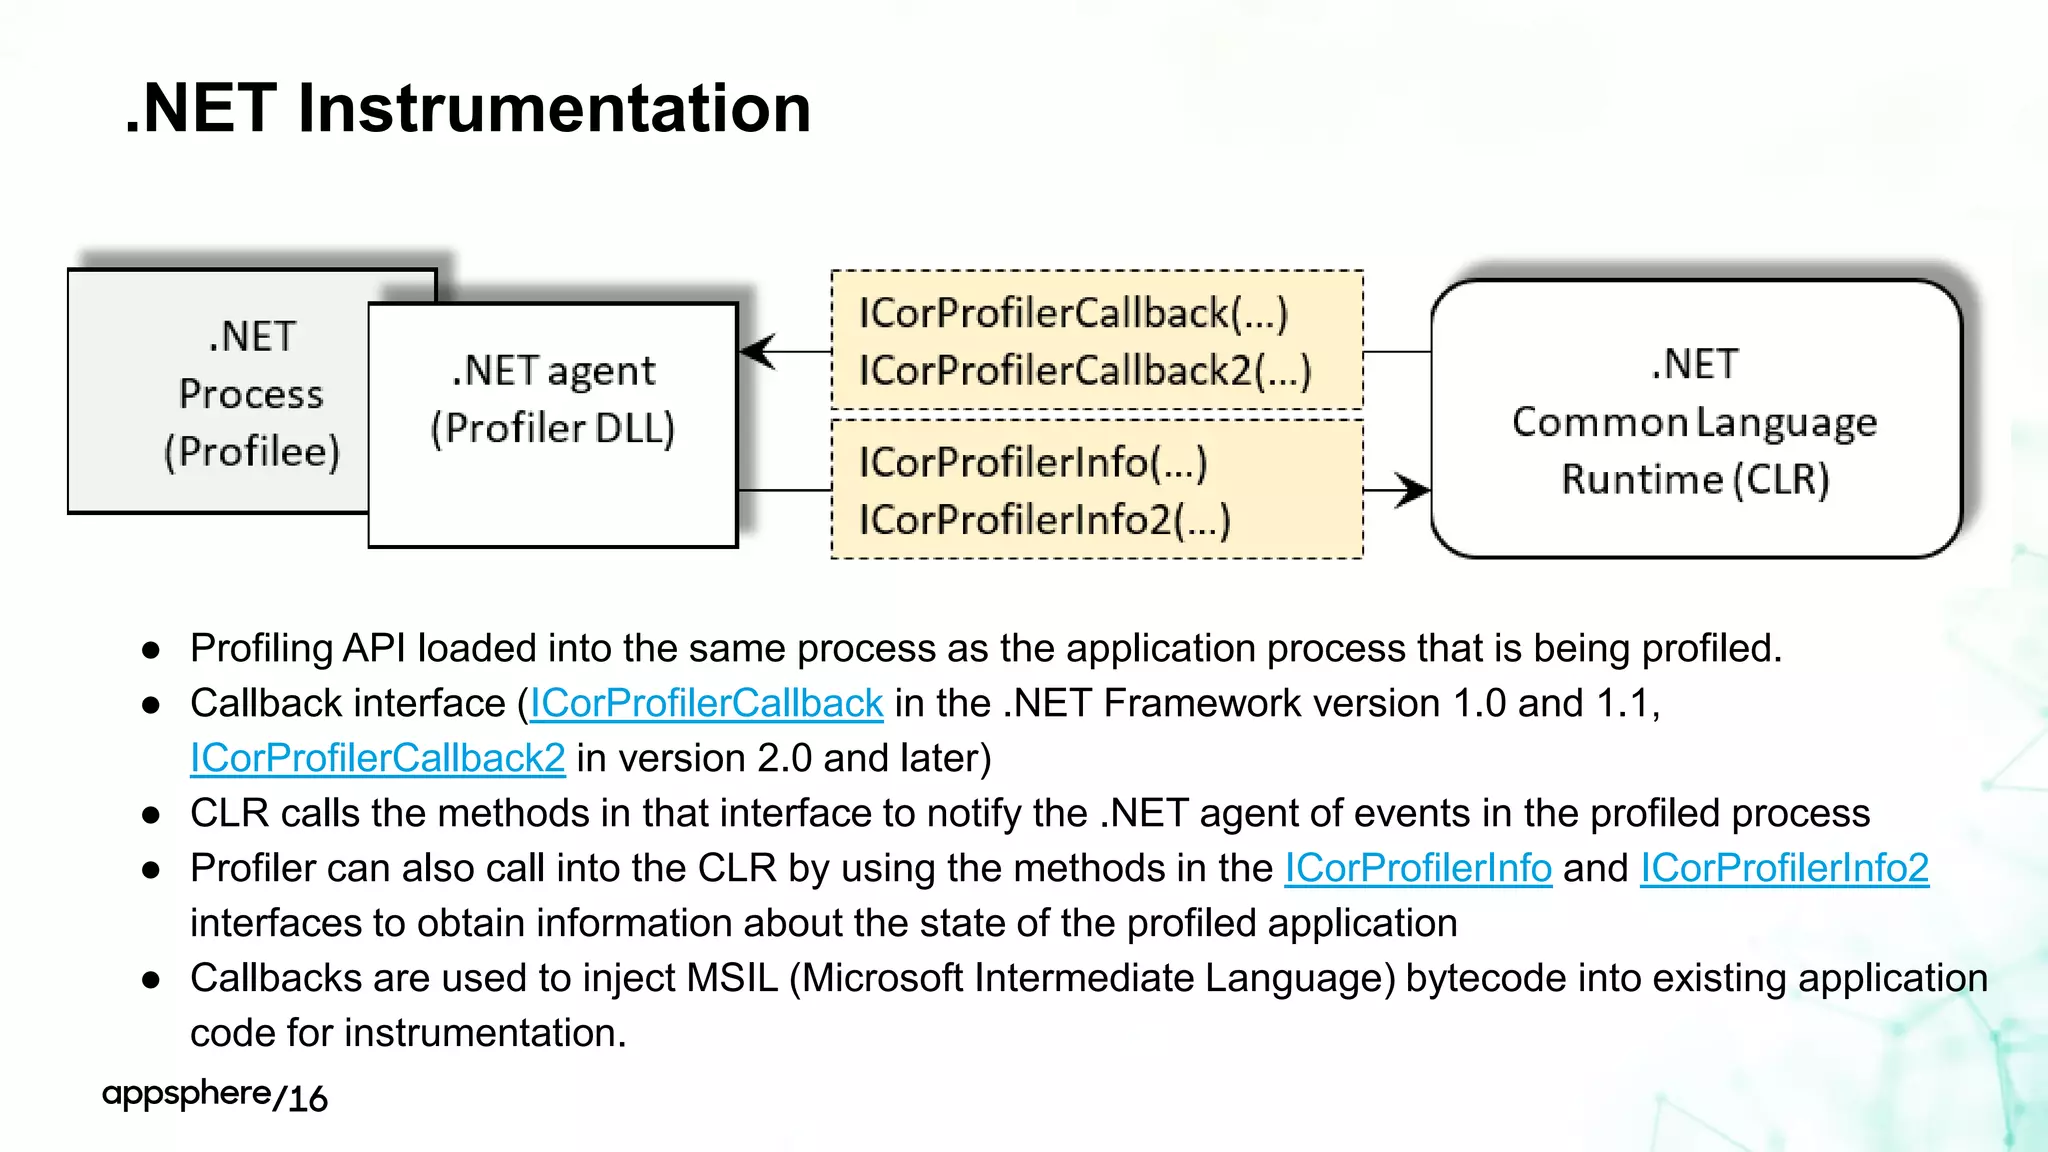
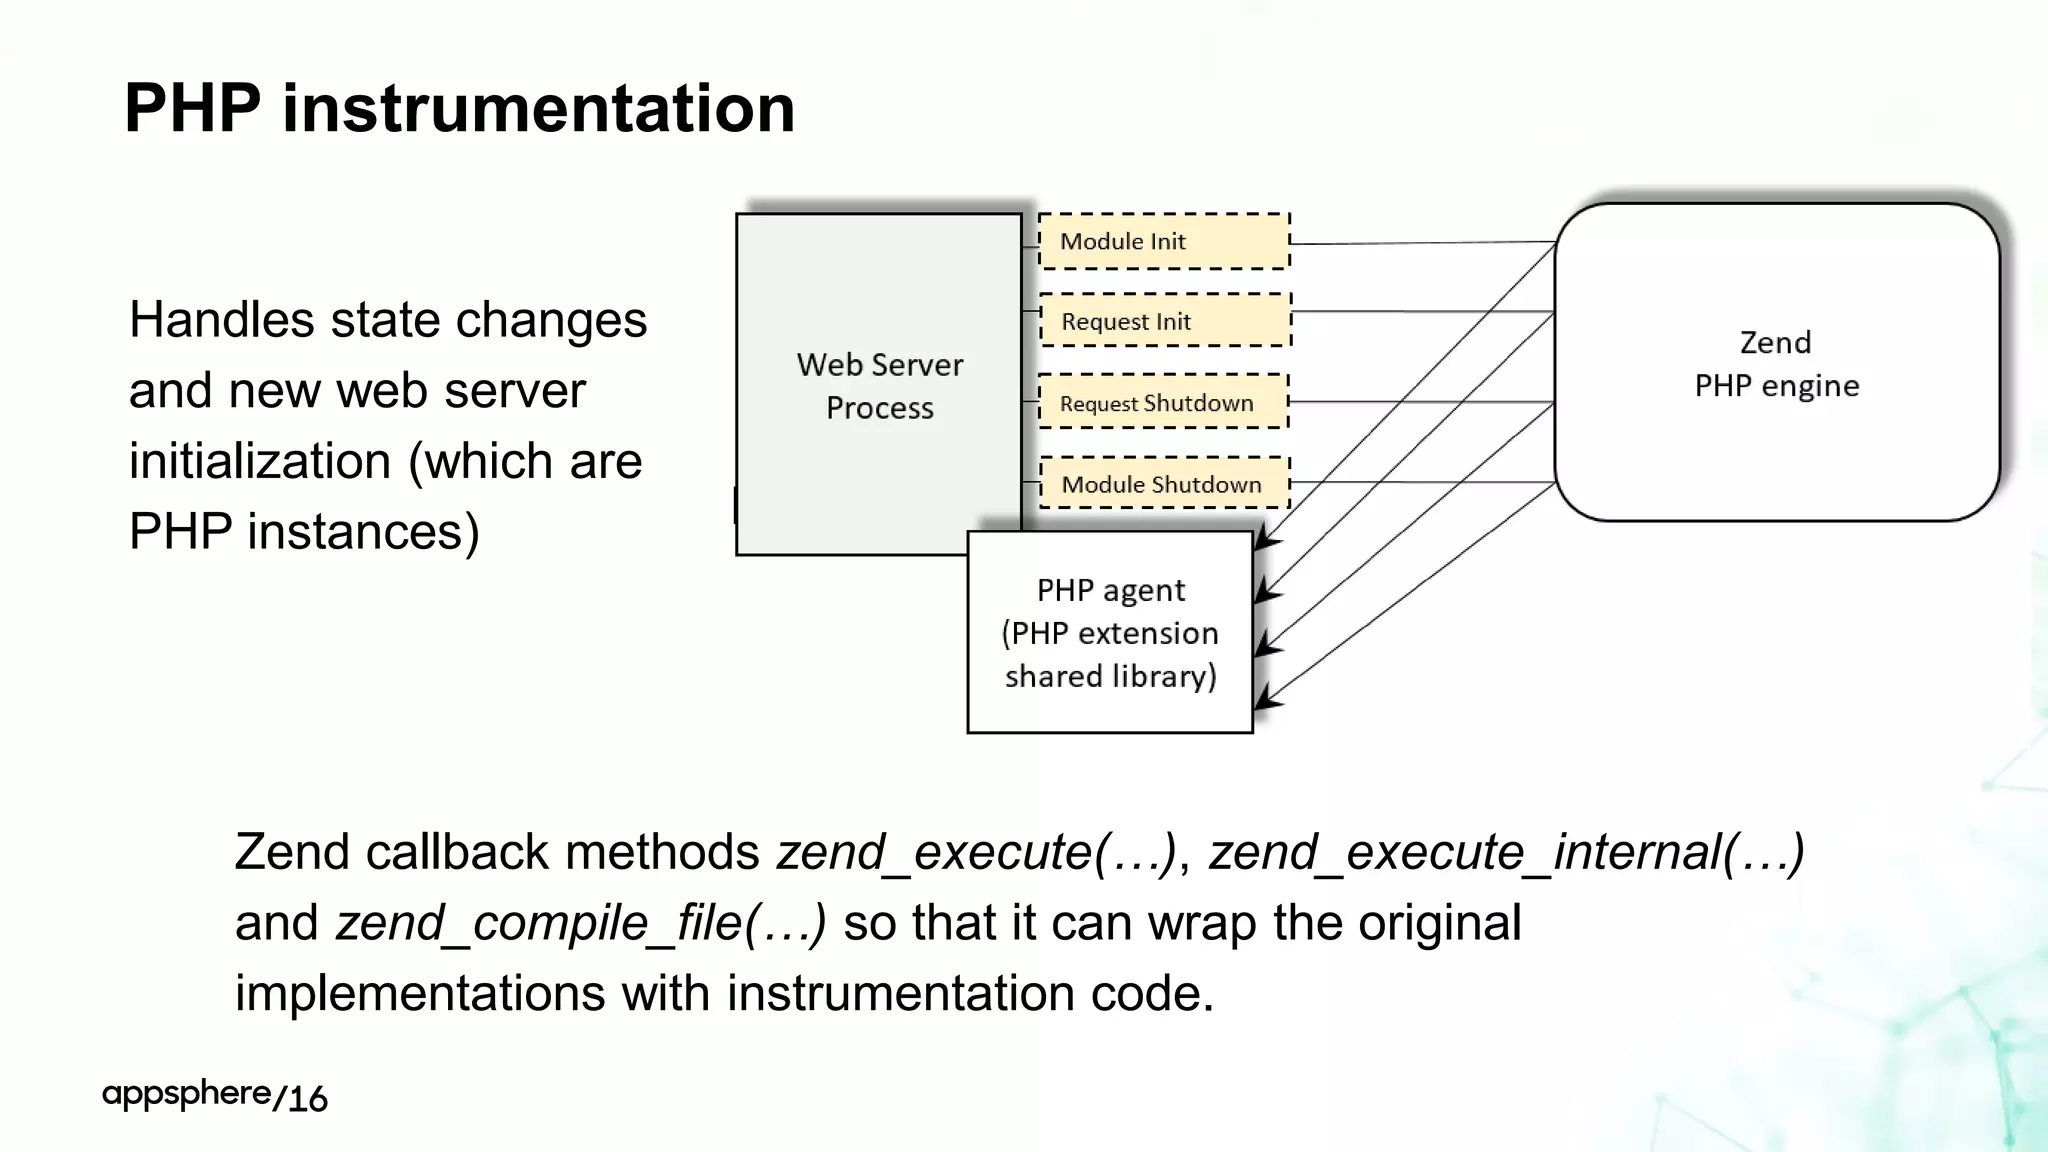
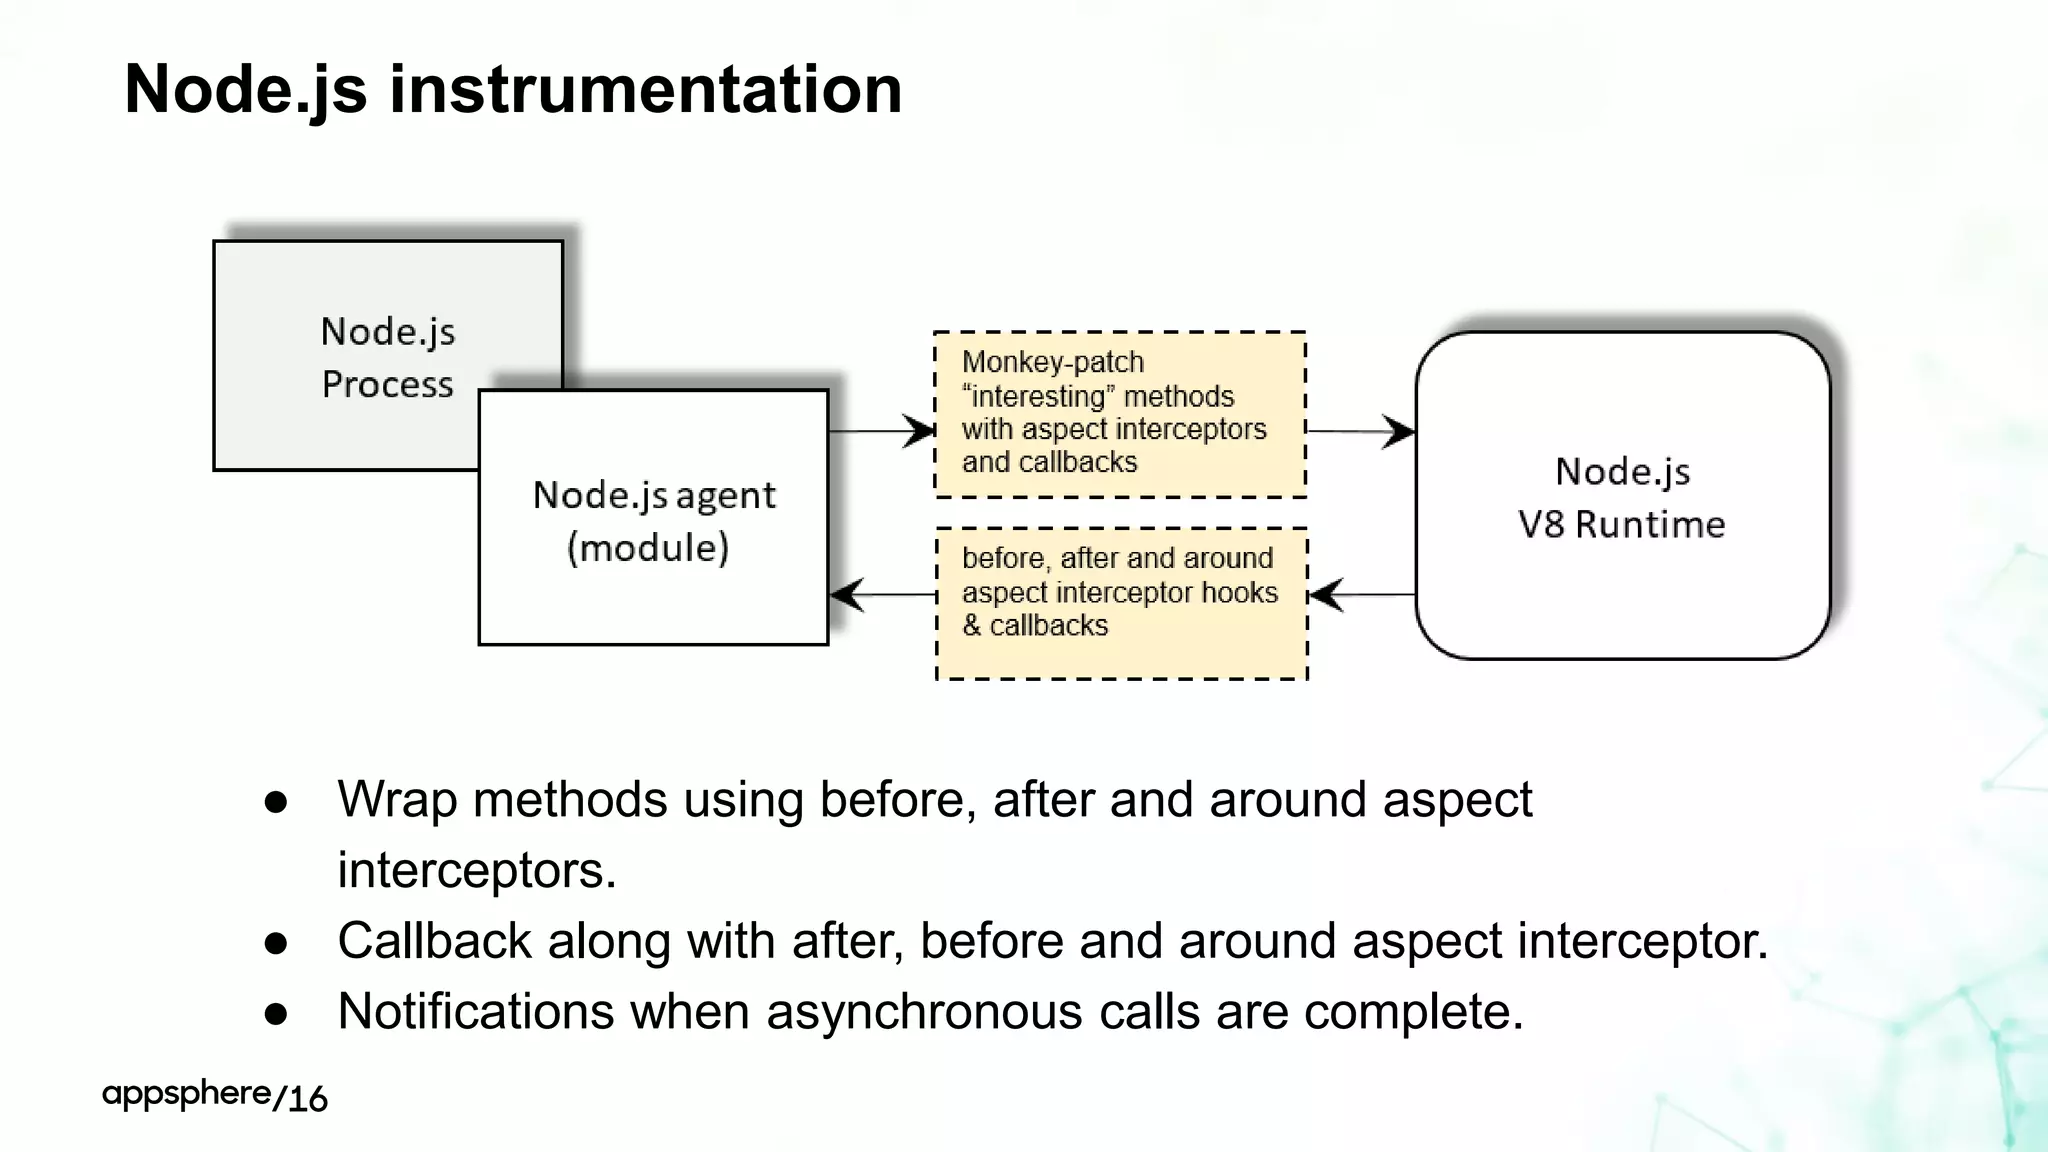
This document discusses different ways to instrument software applications for monitoring purposes. It begins with definitions of instrumentation and telemetry. It then discusses the different types of data that can be collected through instrumentation like metrics and events. It describes how to instrument various parts of applications including the frontend like browsers and mobile apps as well as the backend for languages like Java, .NET, Node.js and PHP. It provides best practices for instrumentation and logging. Finally, it discusses challenges with correlating data across distributed systems and some open source options and solutions for transaction correlation.