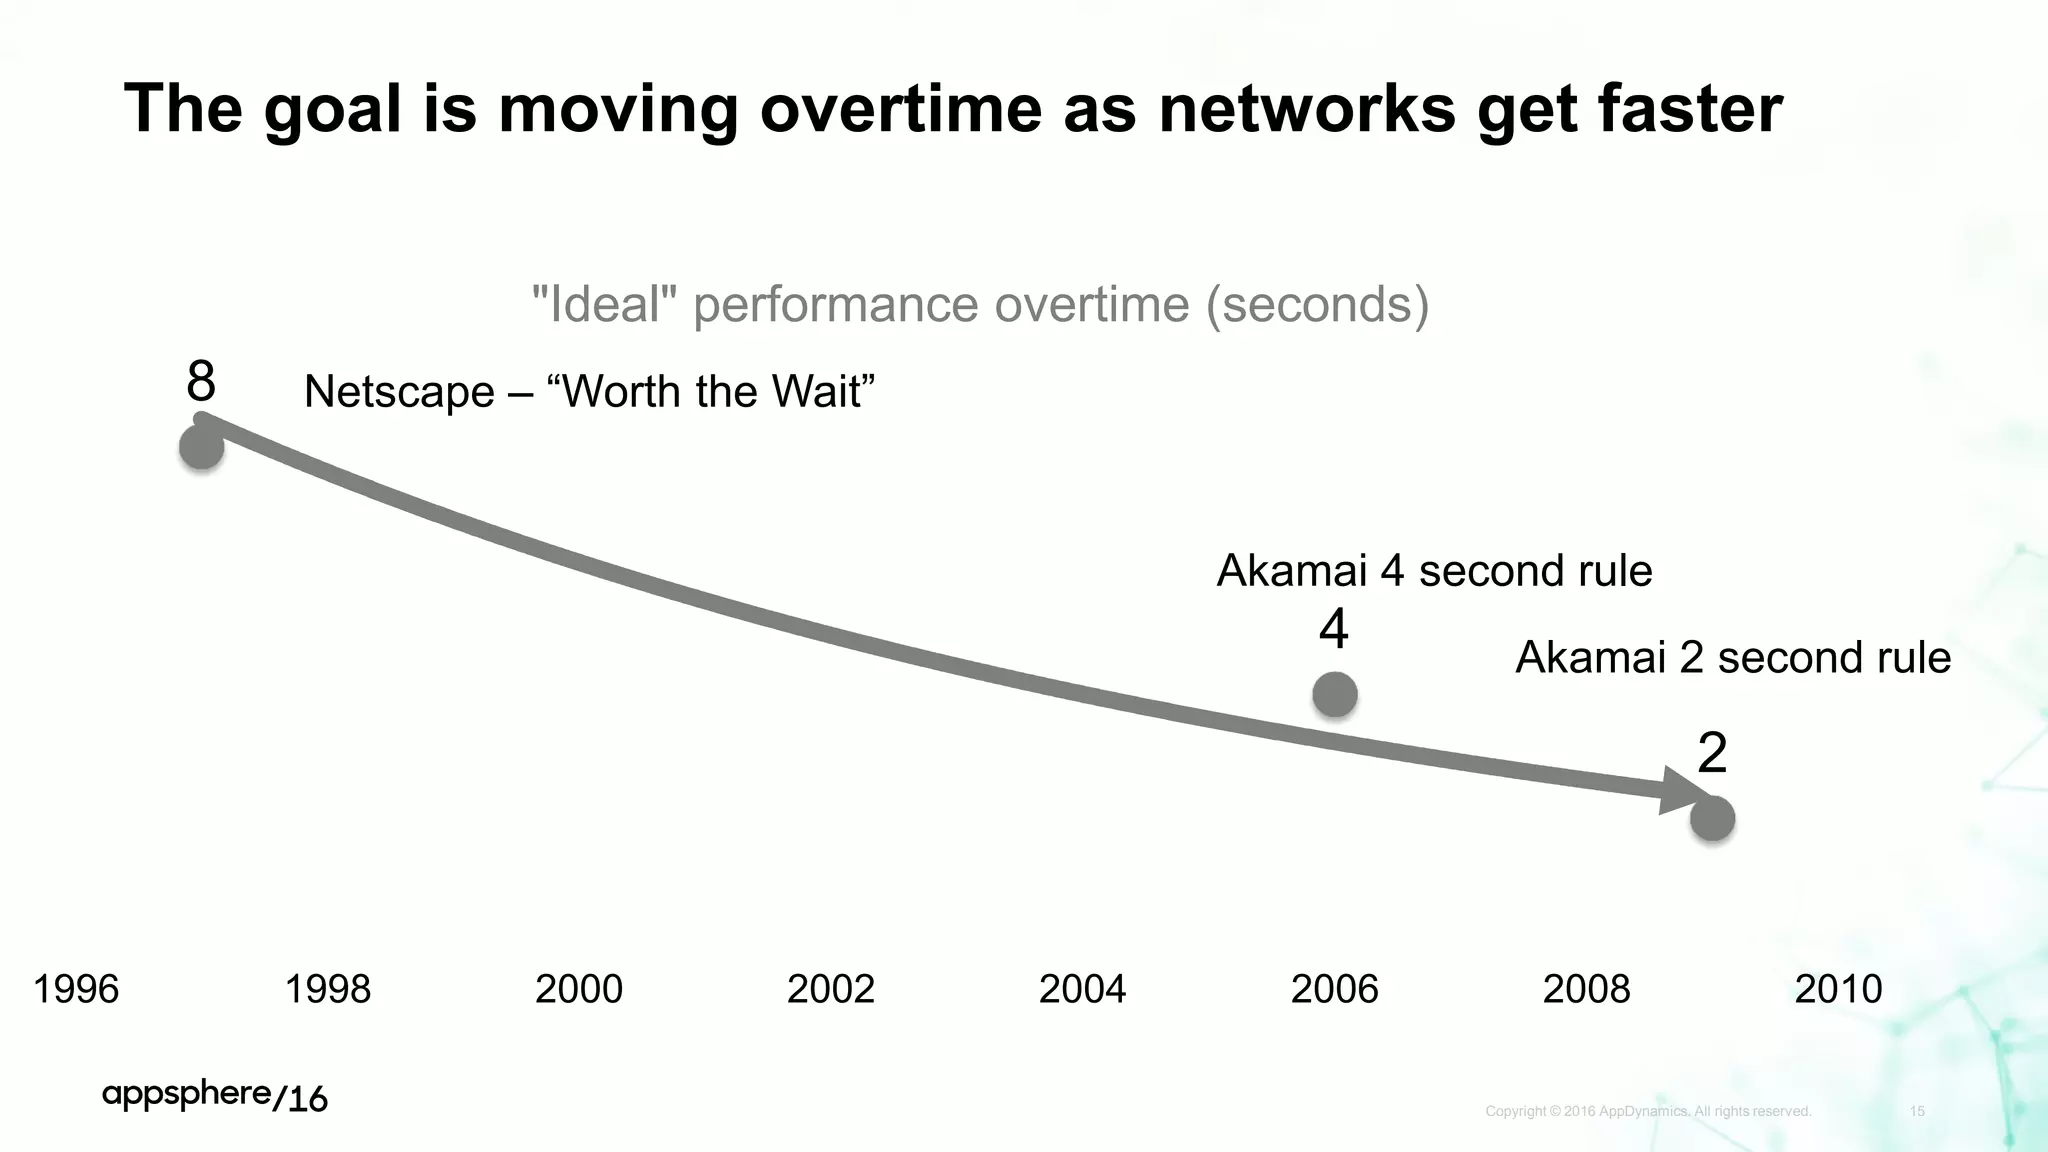
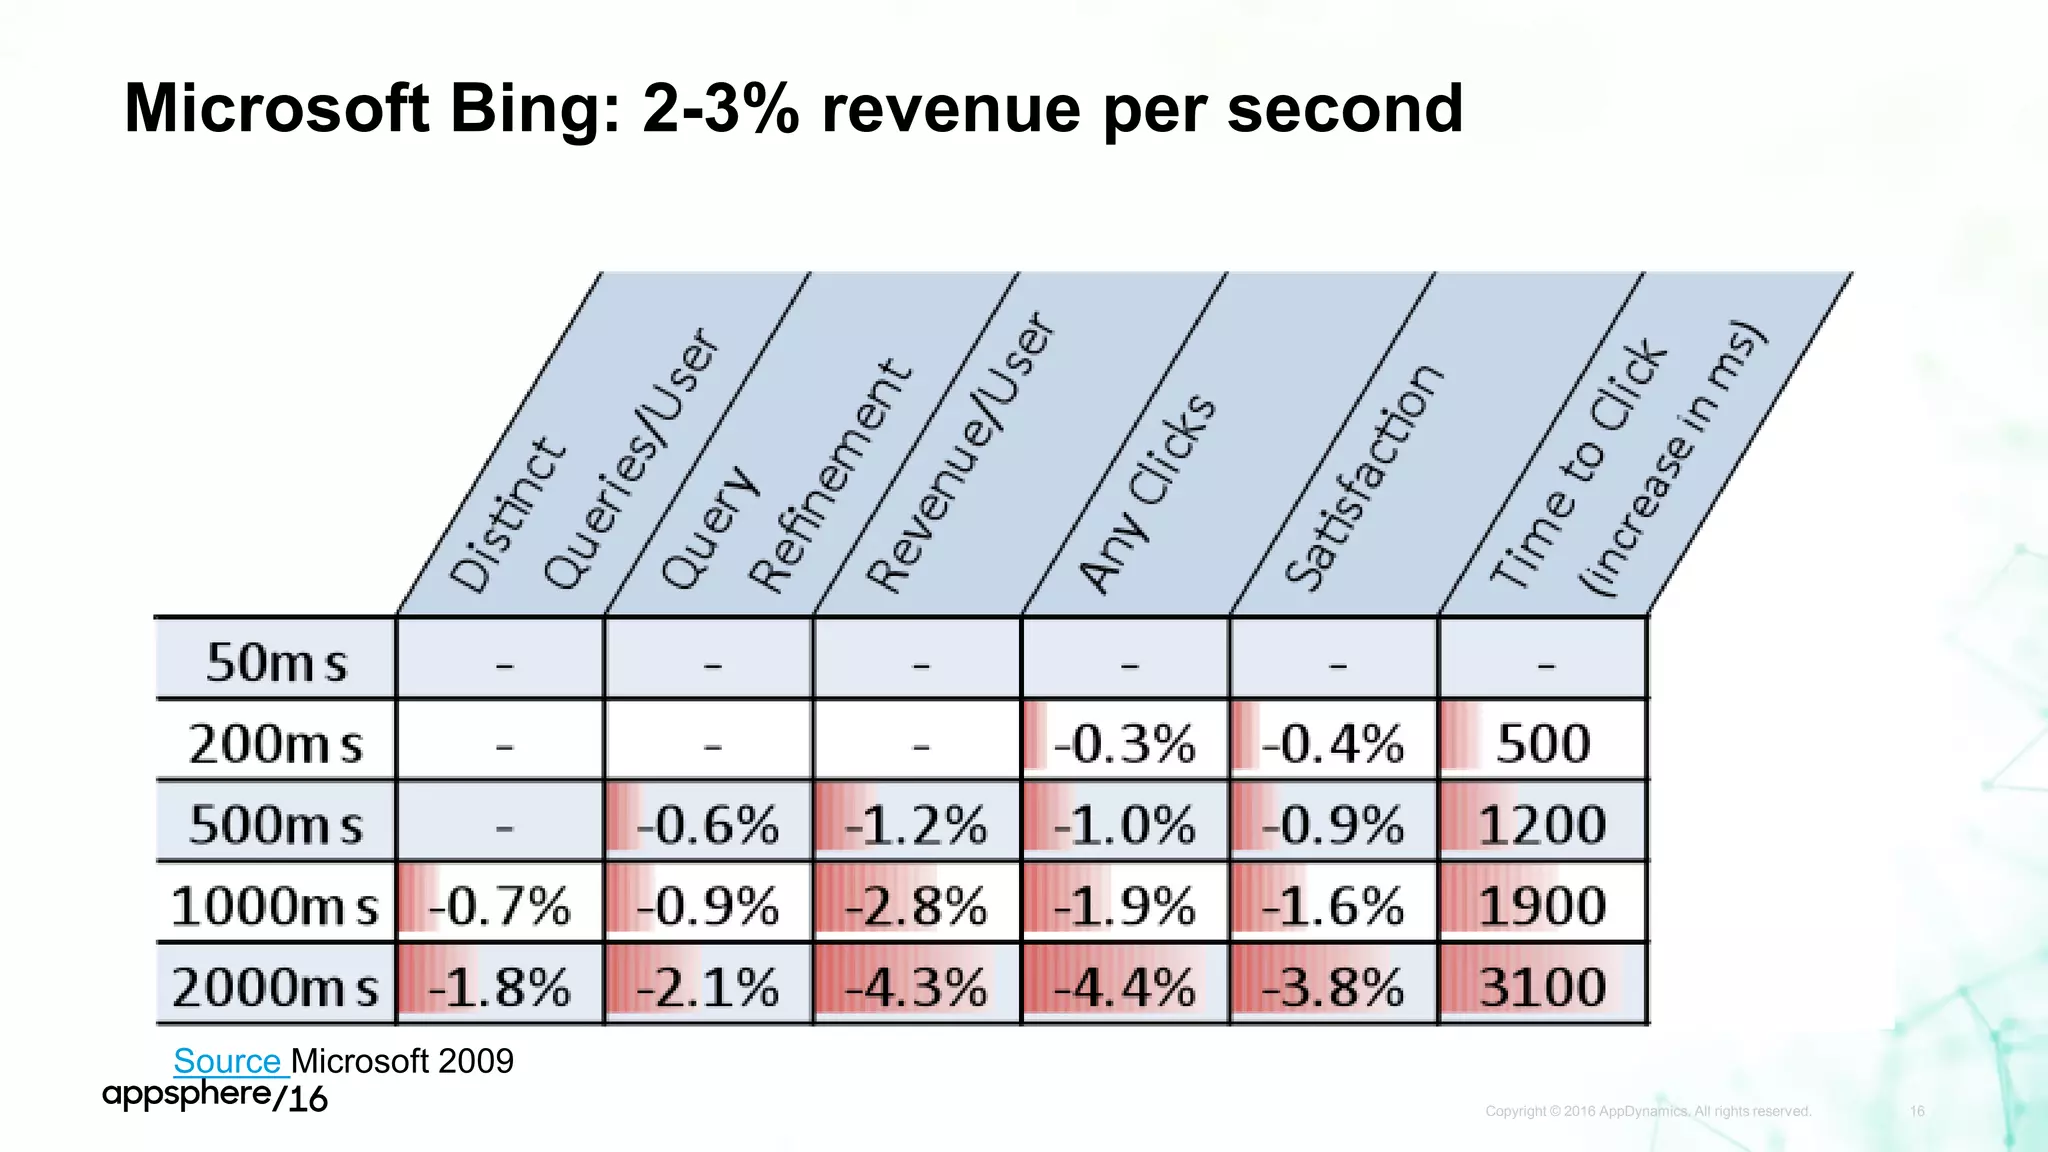
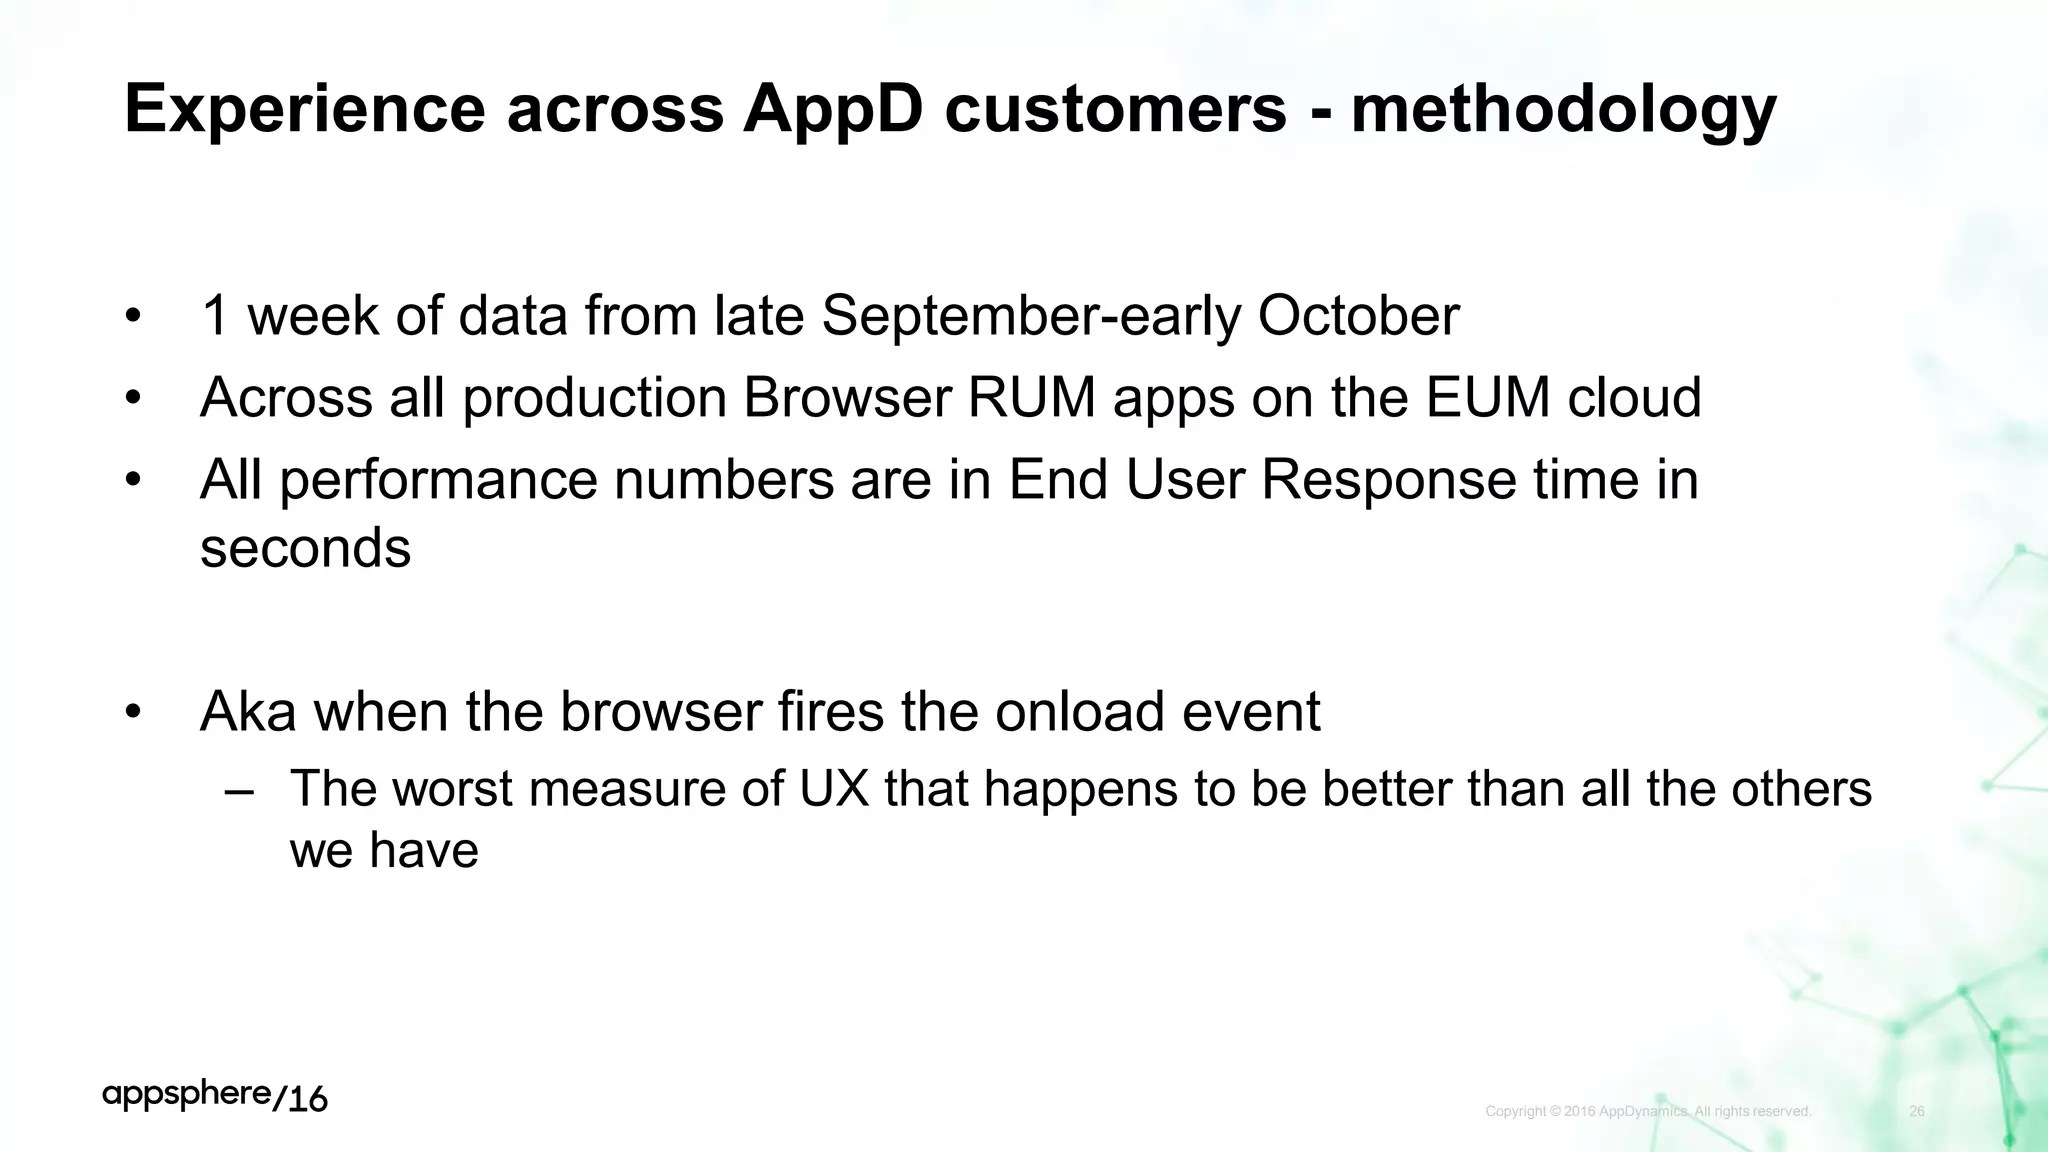
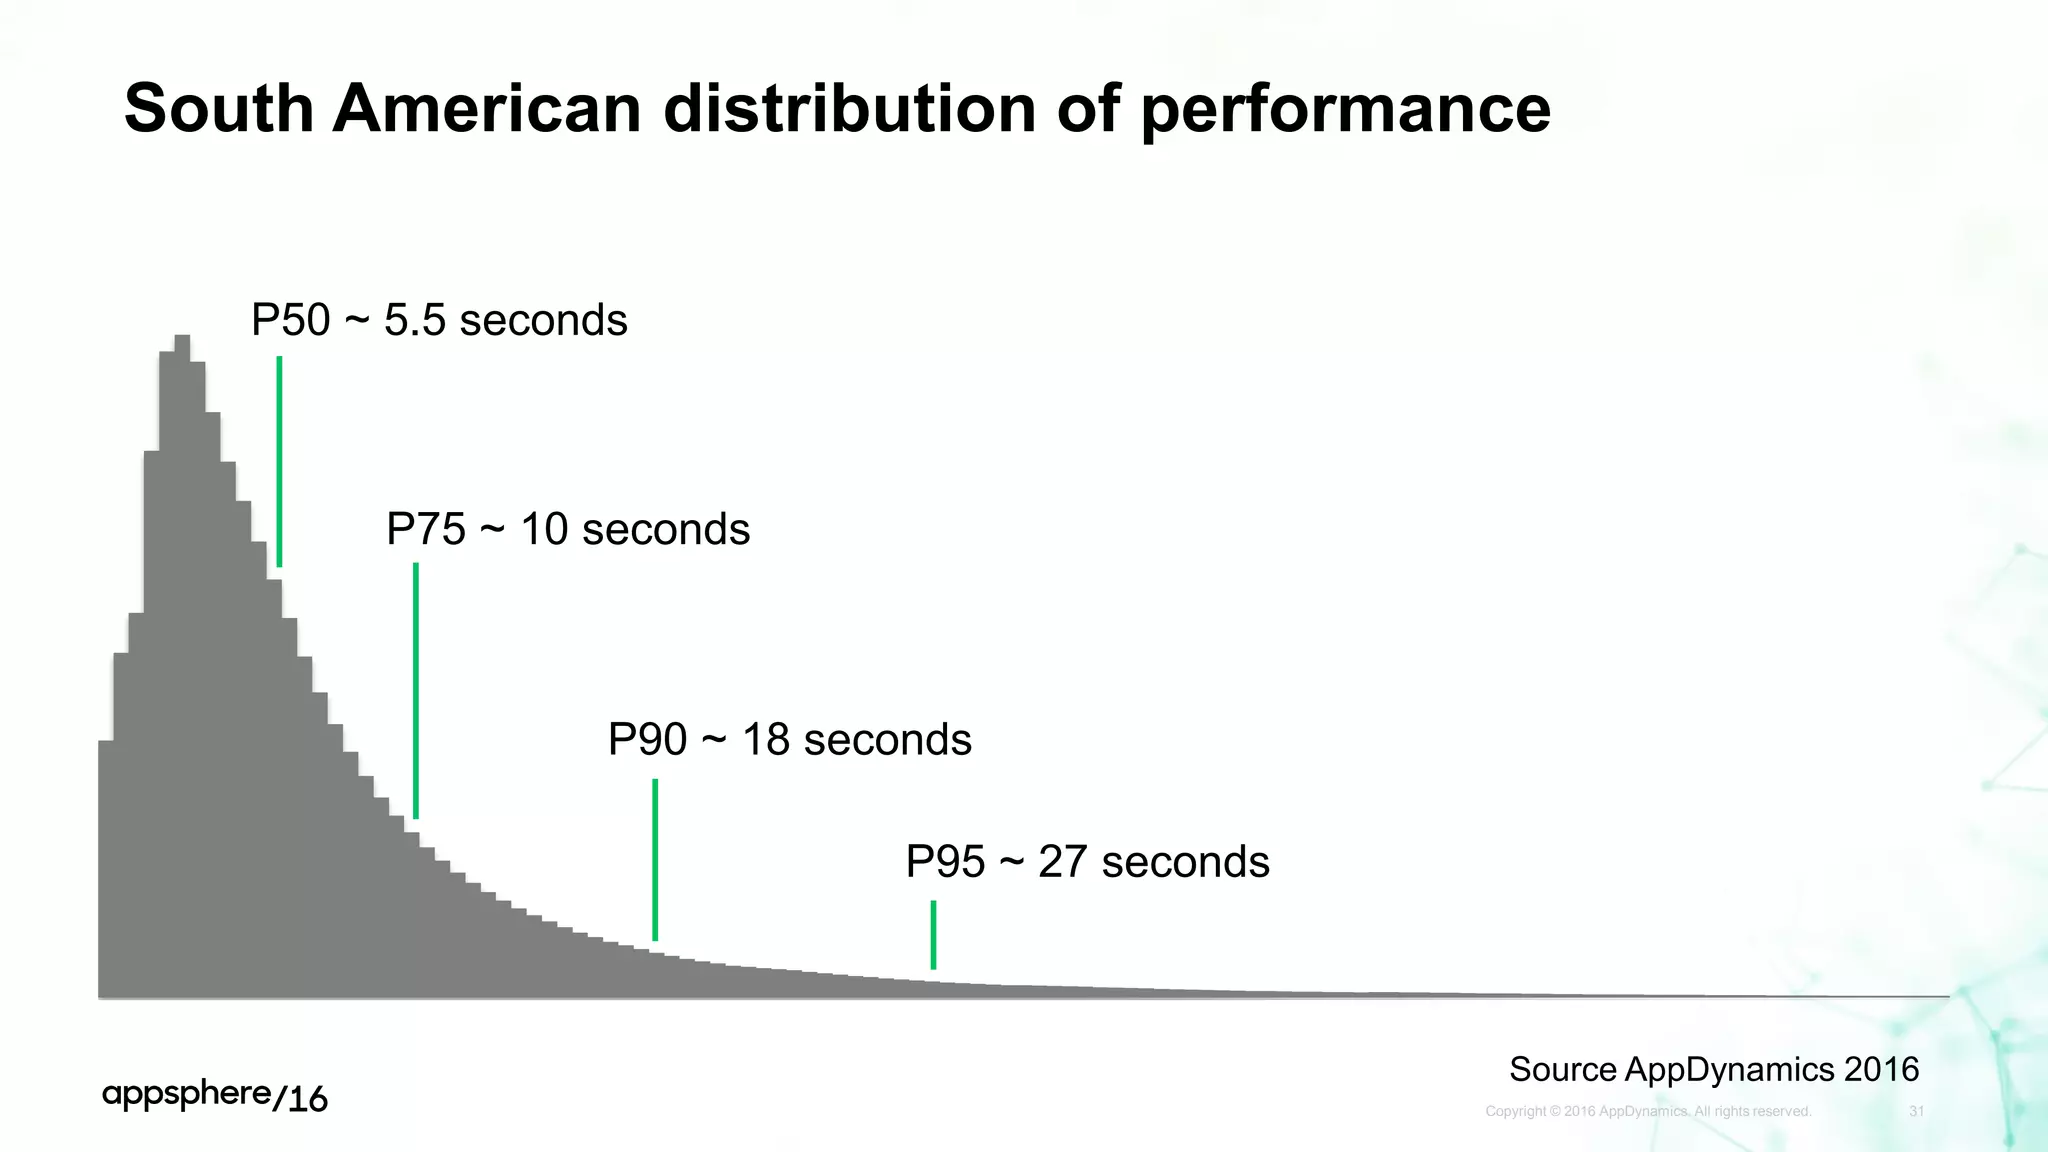
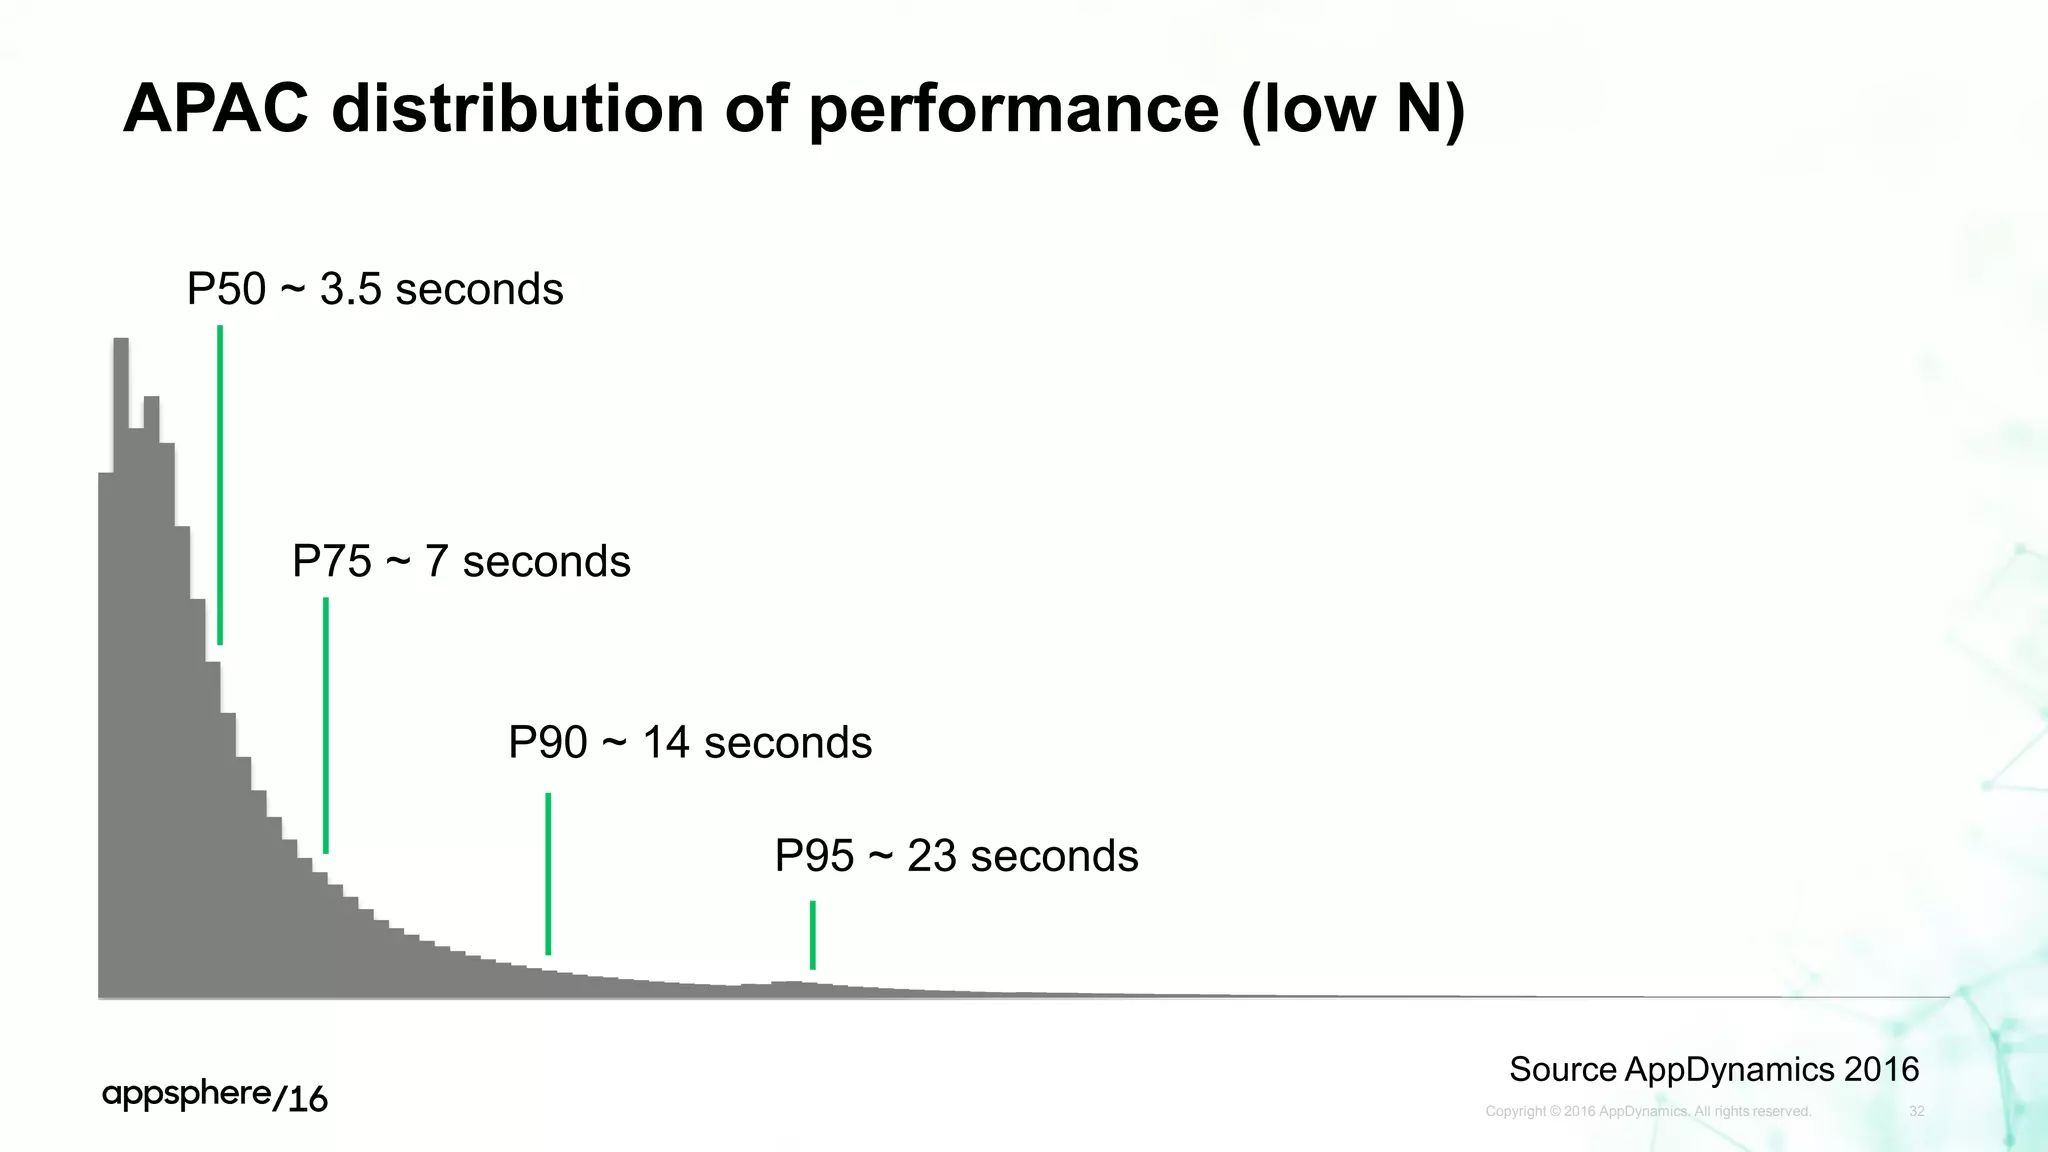
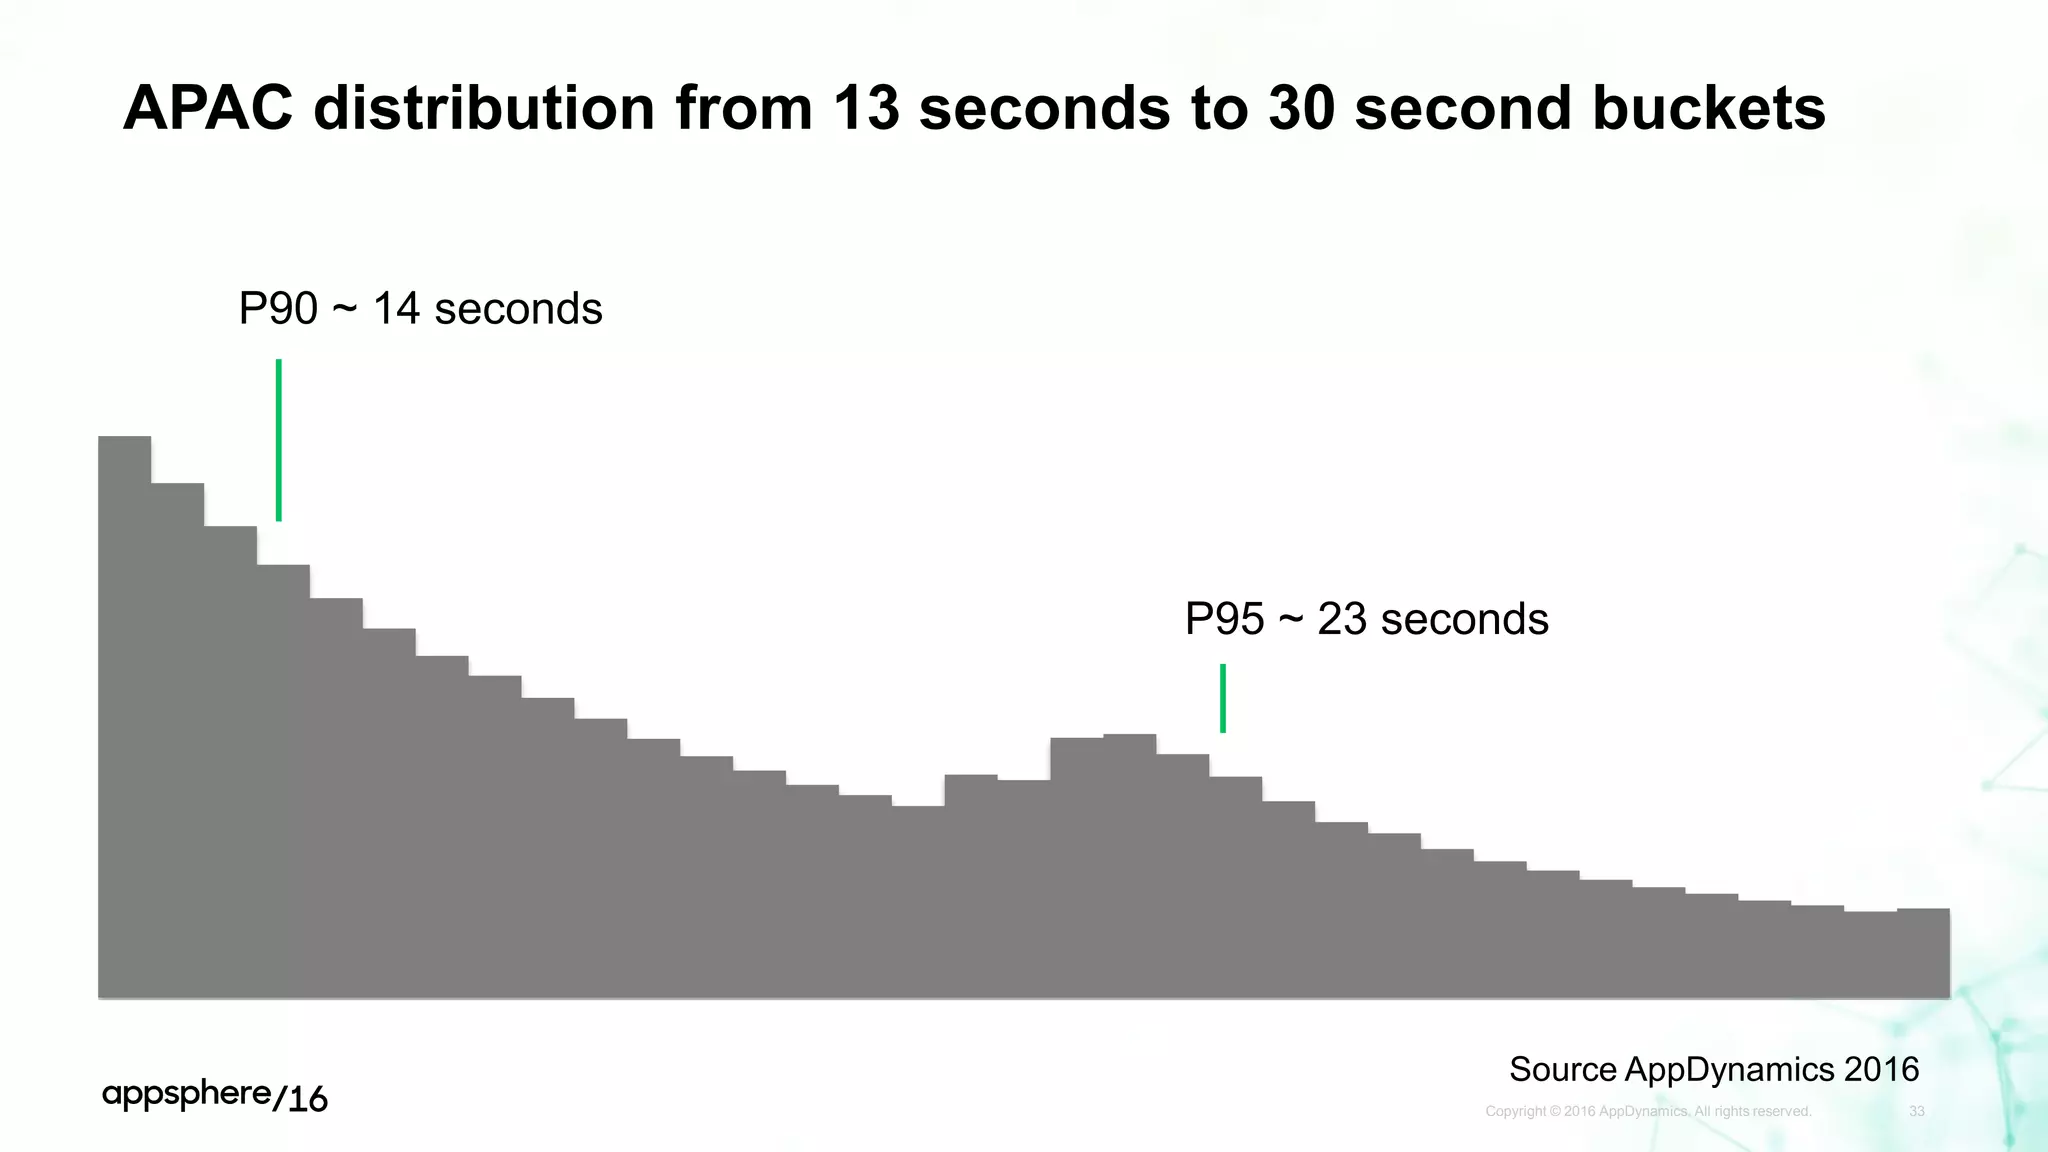
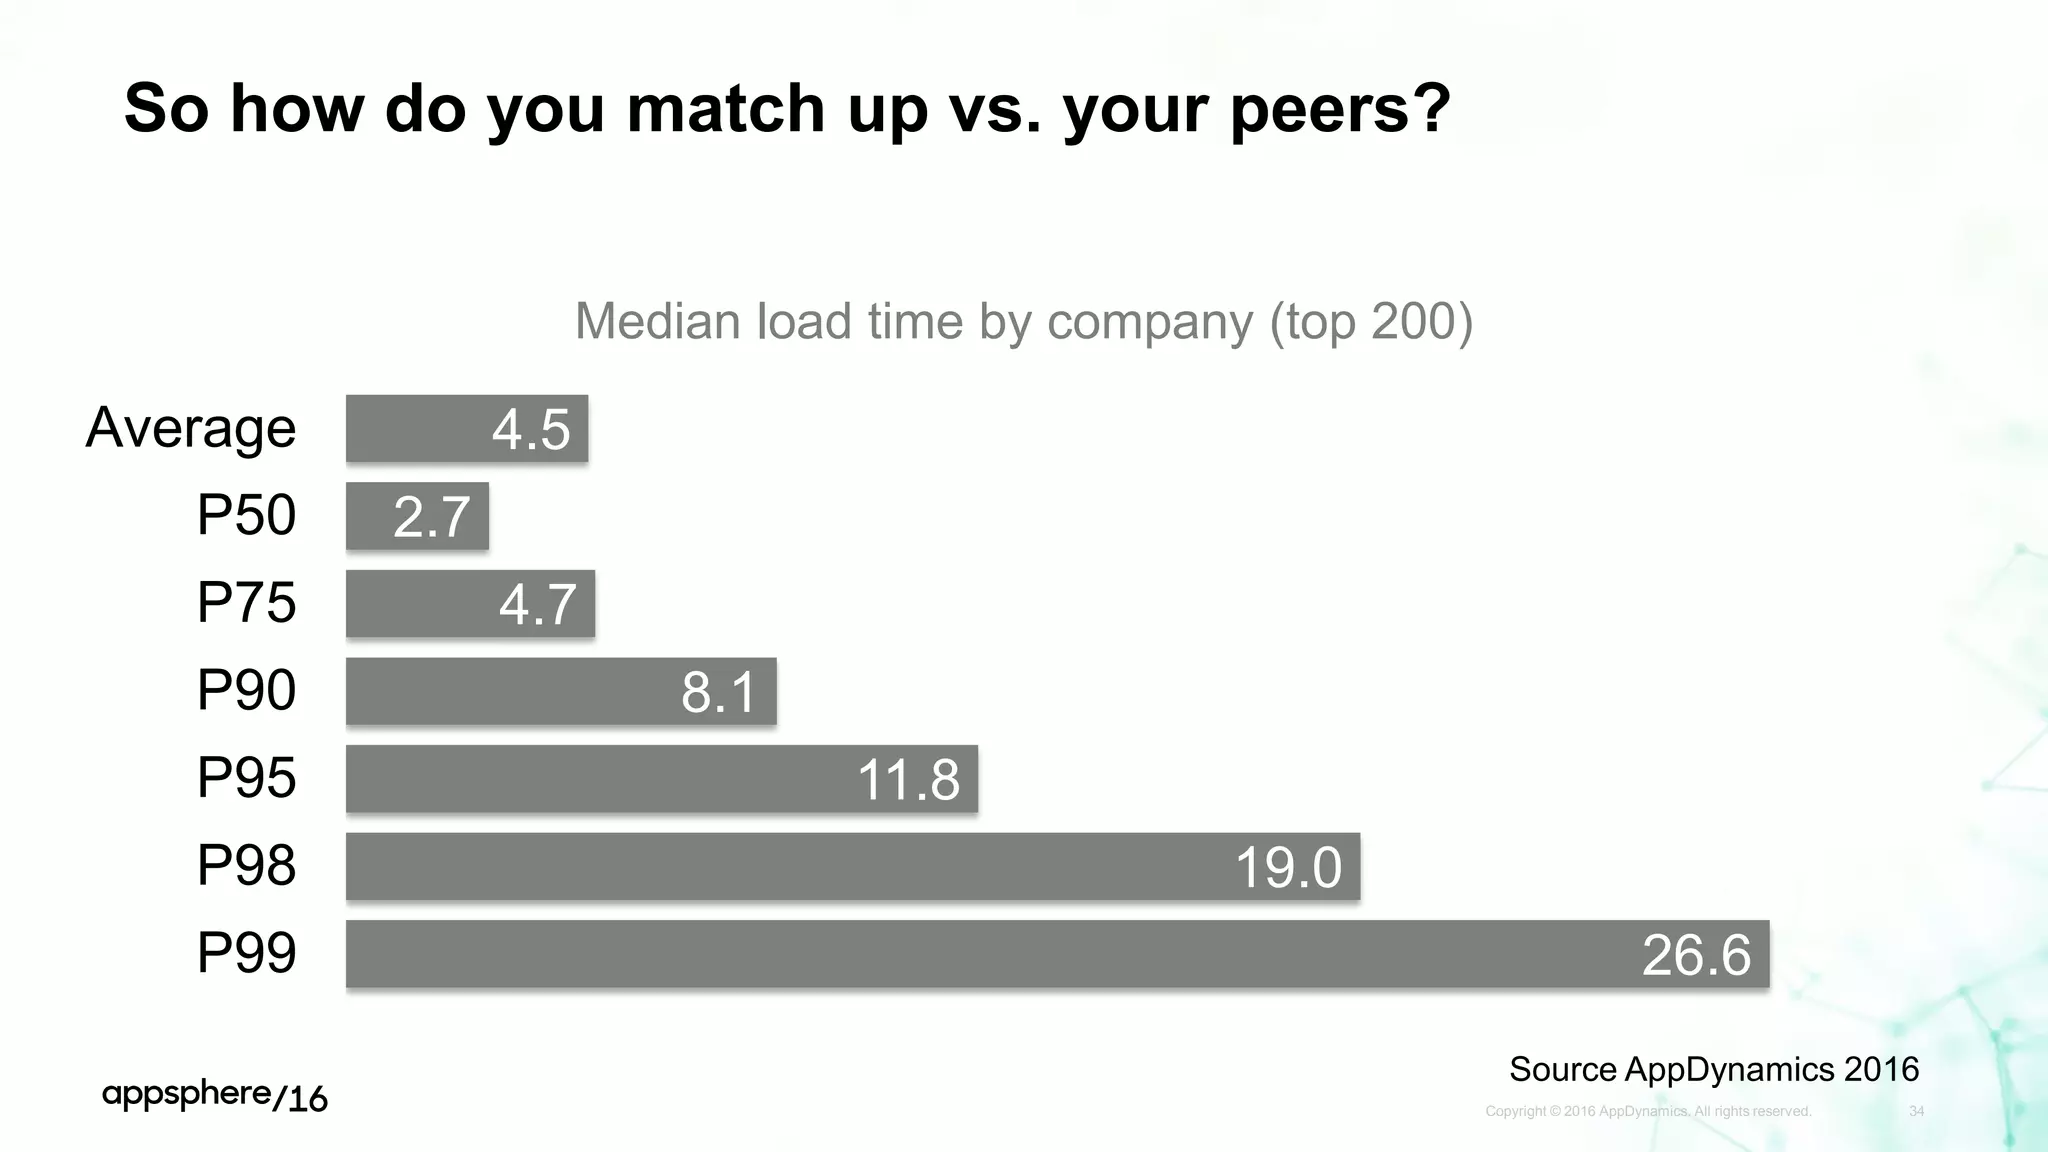
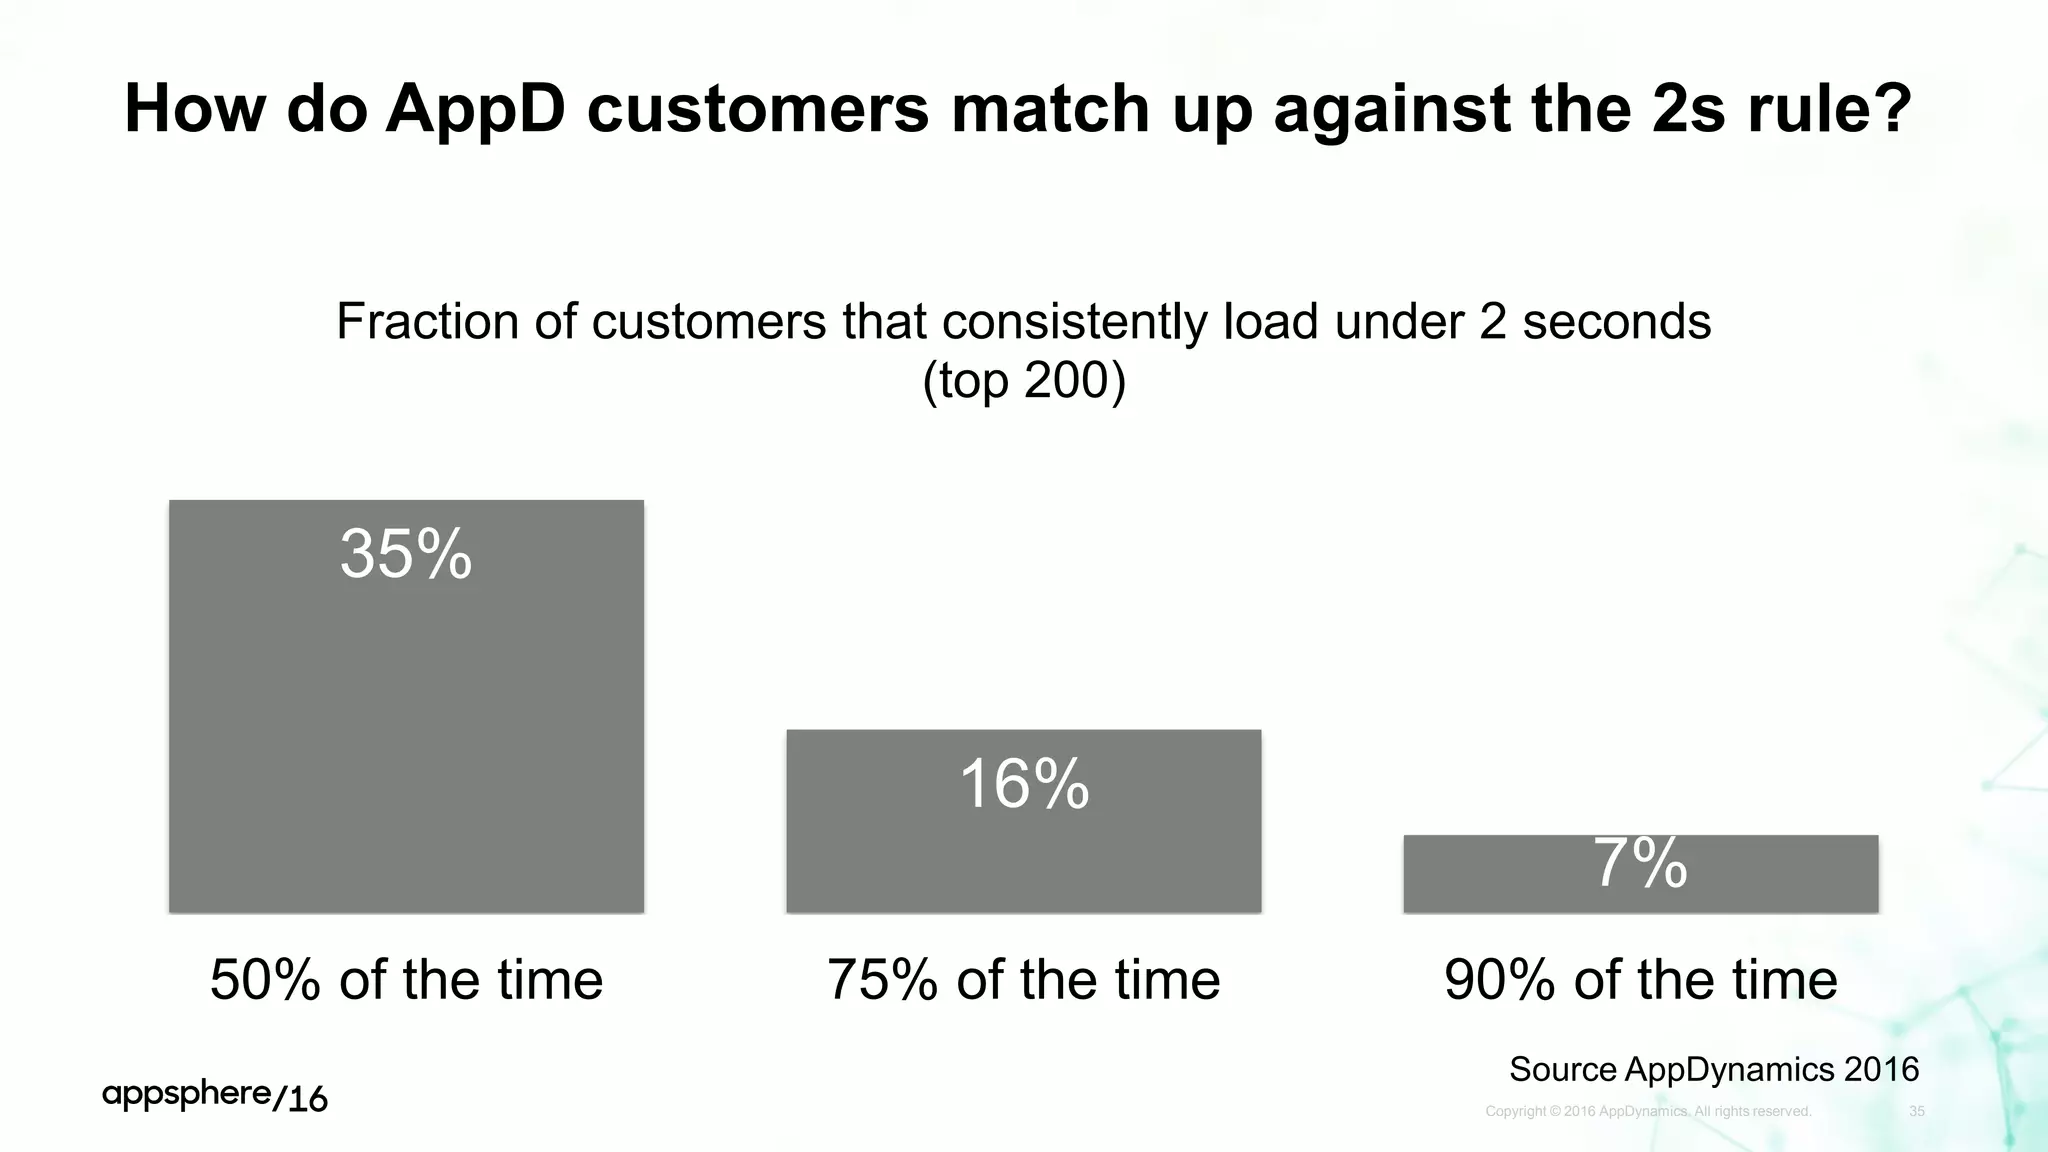
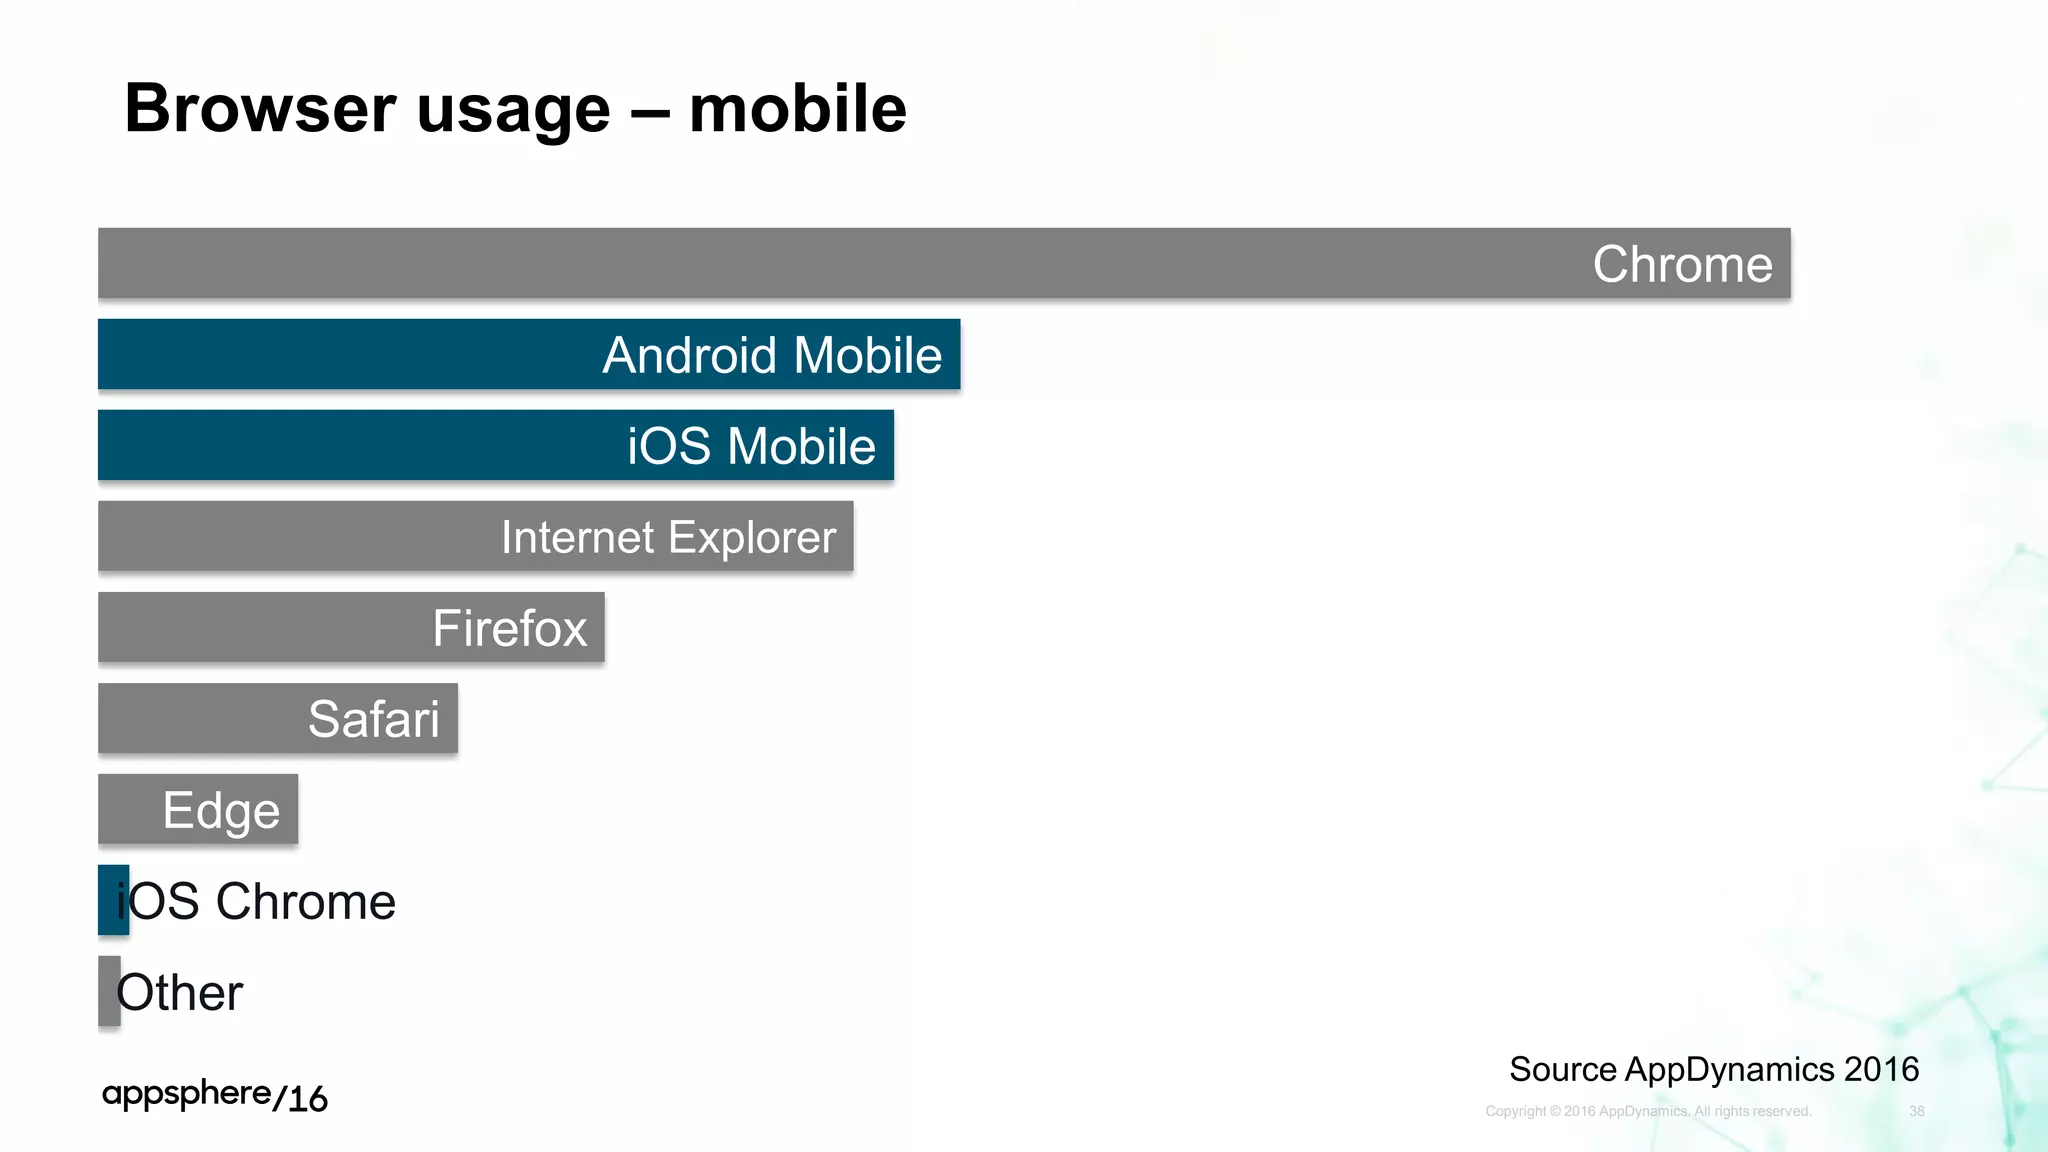
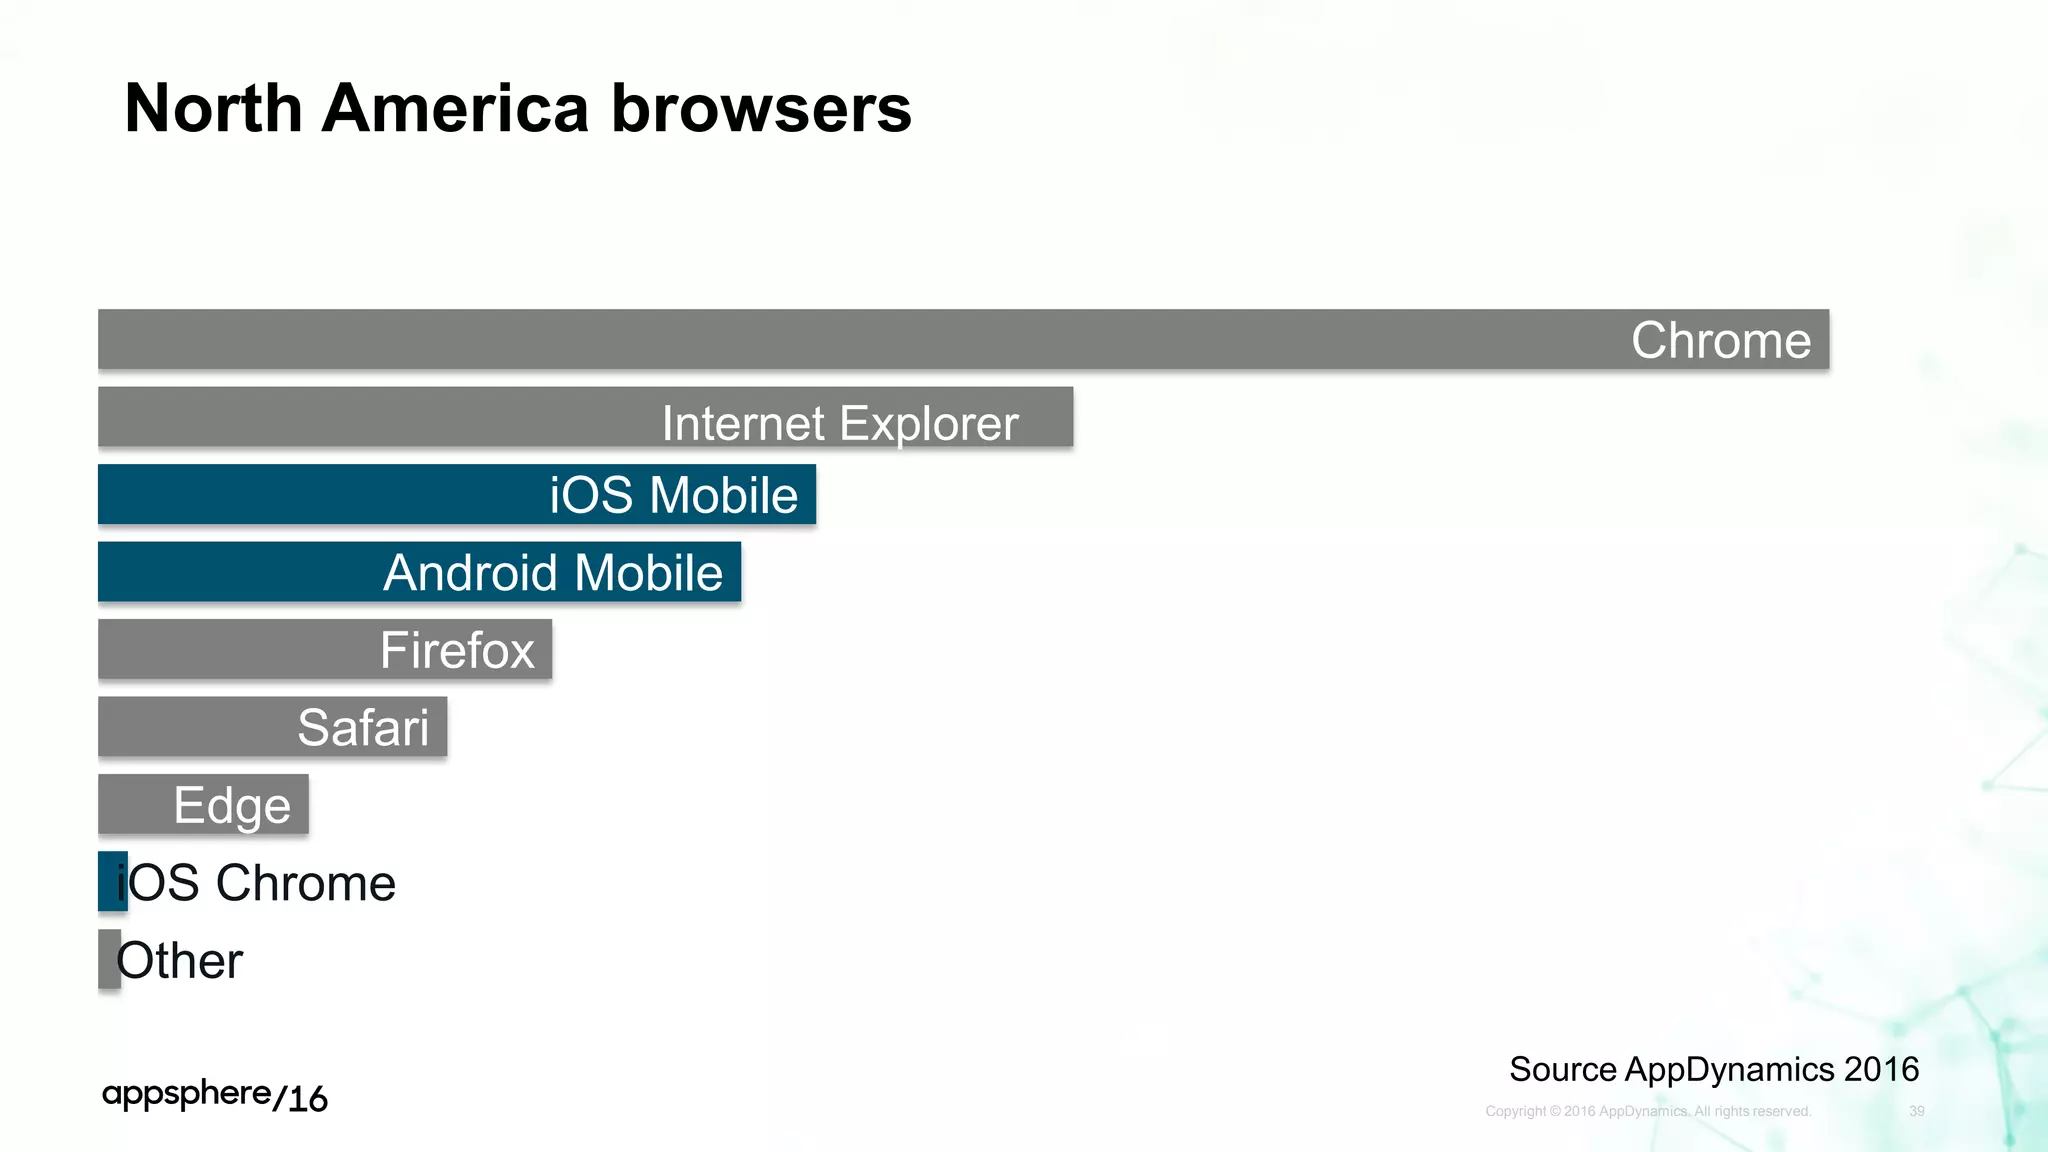
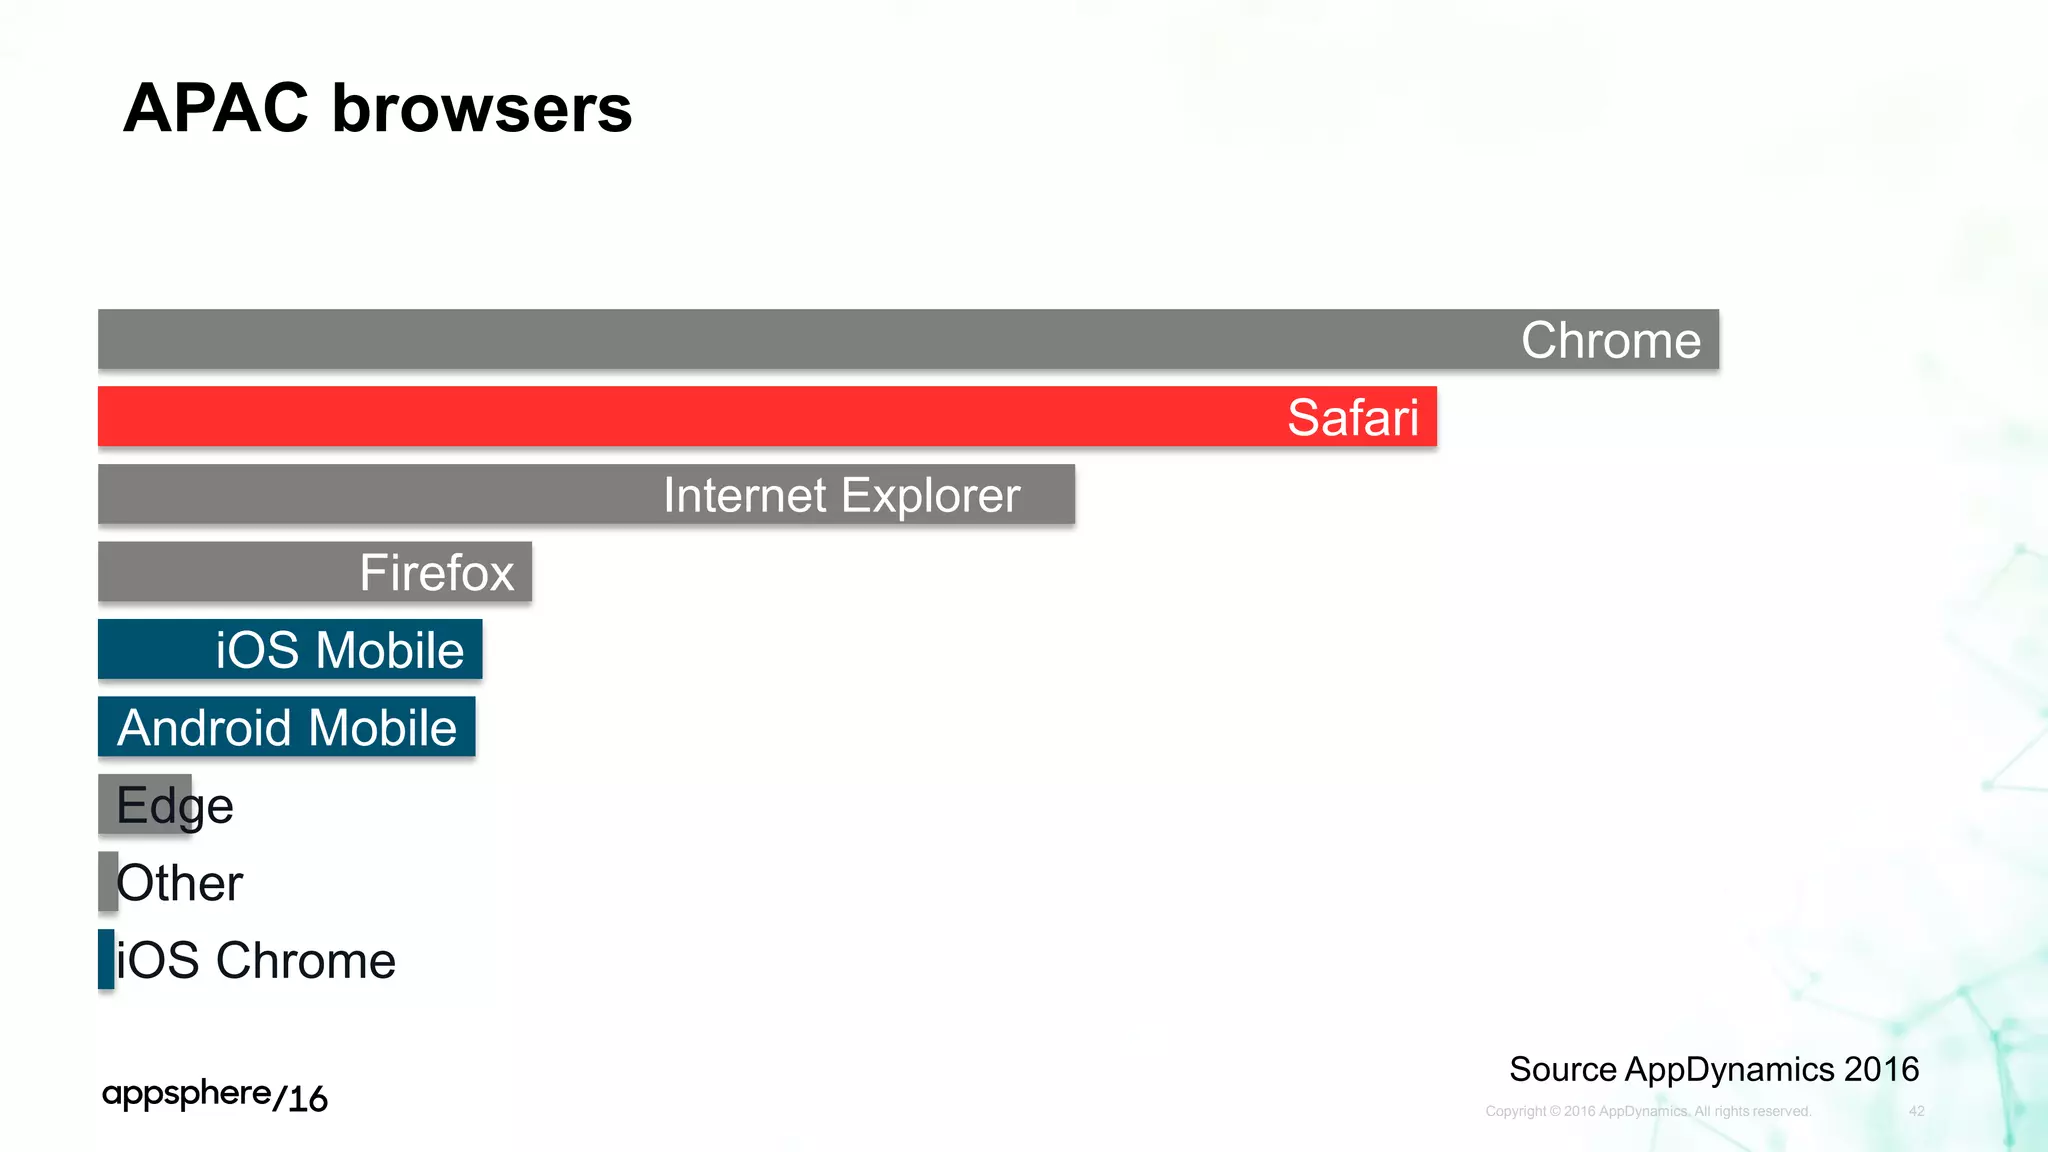
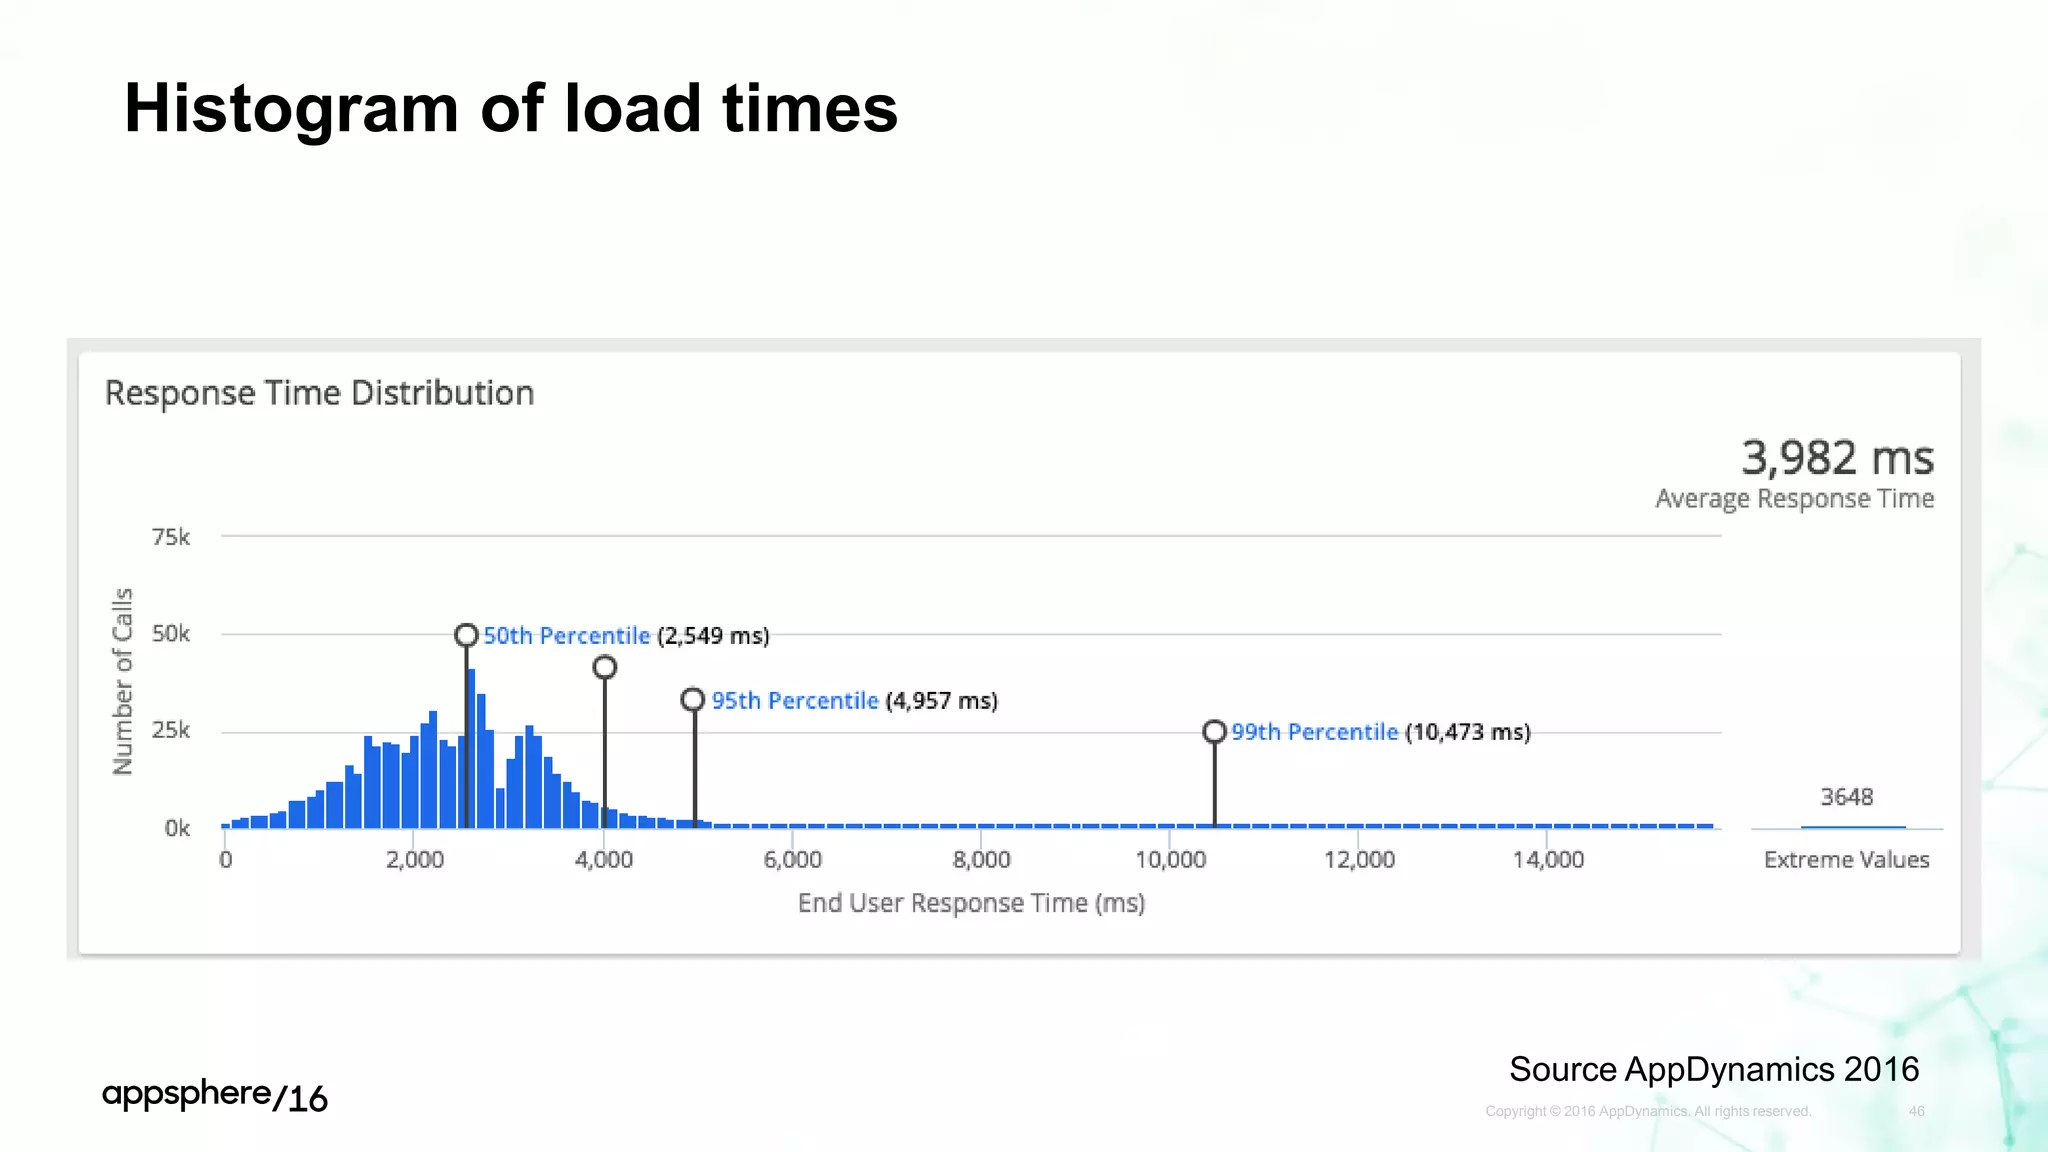
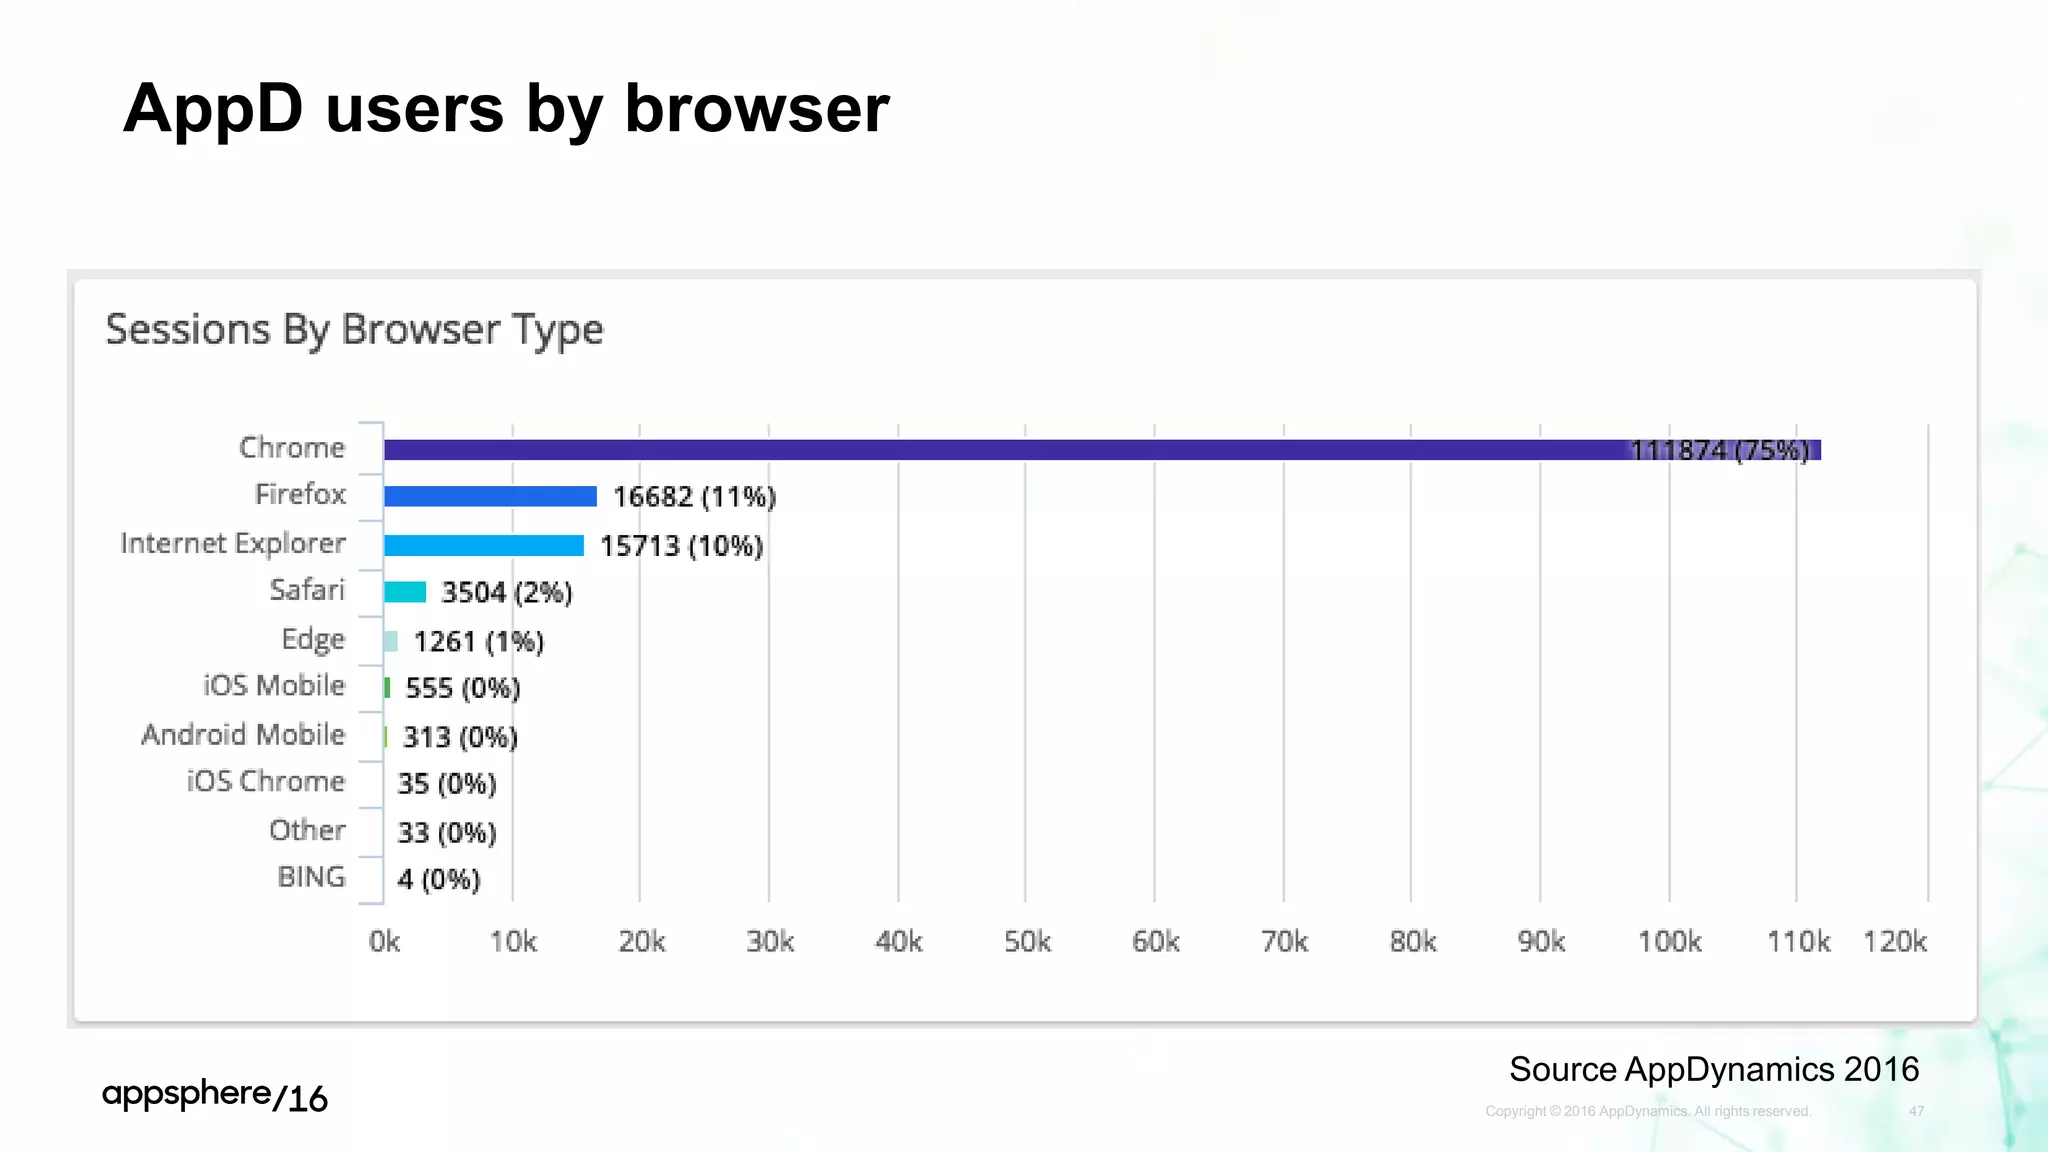
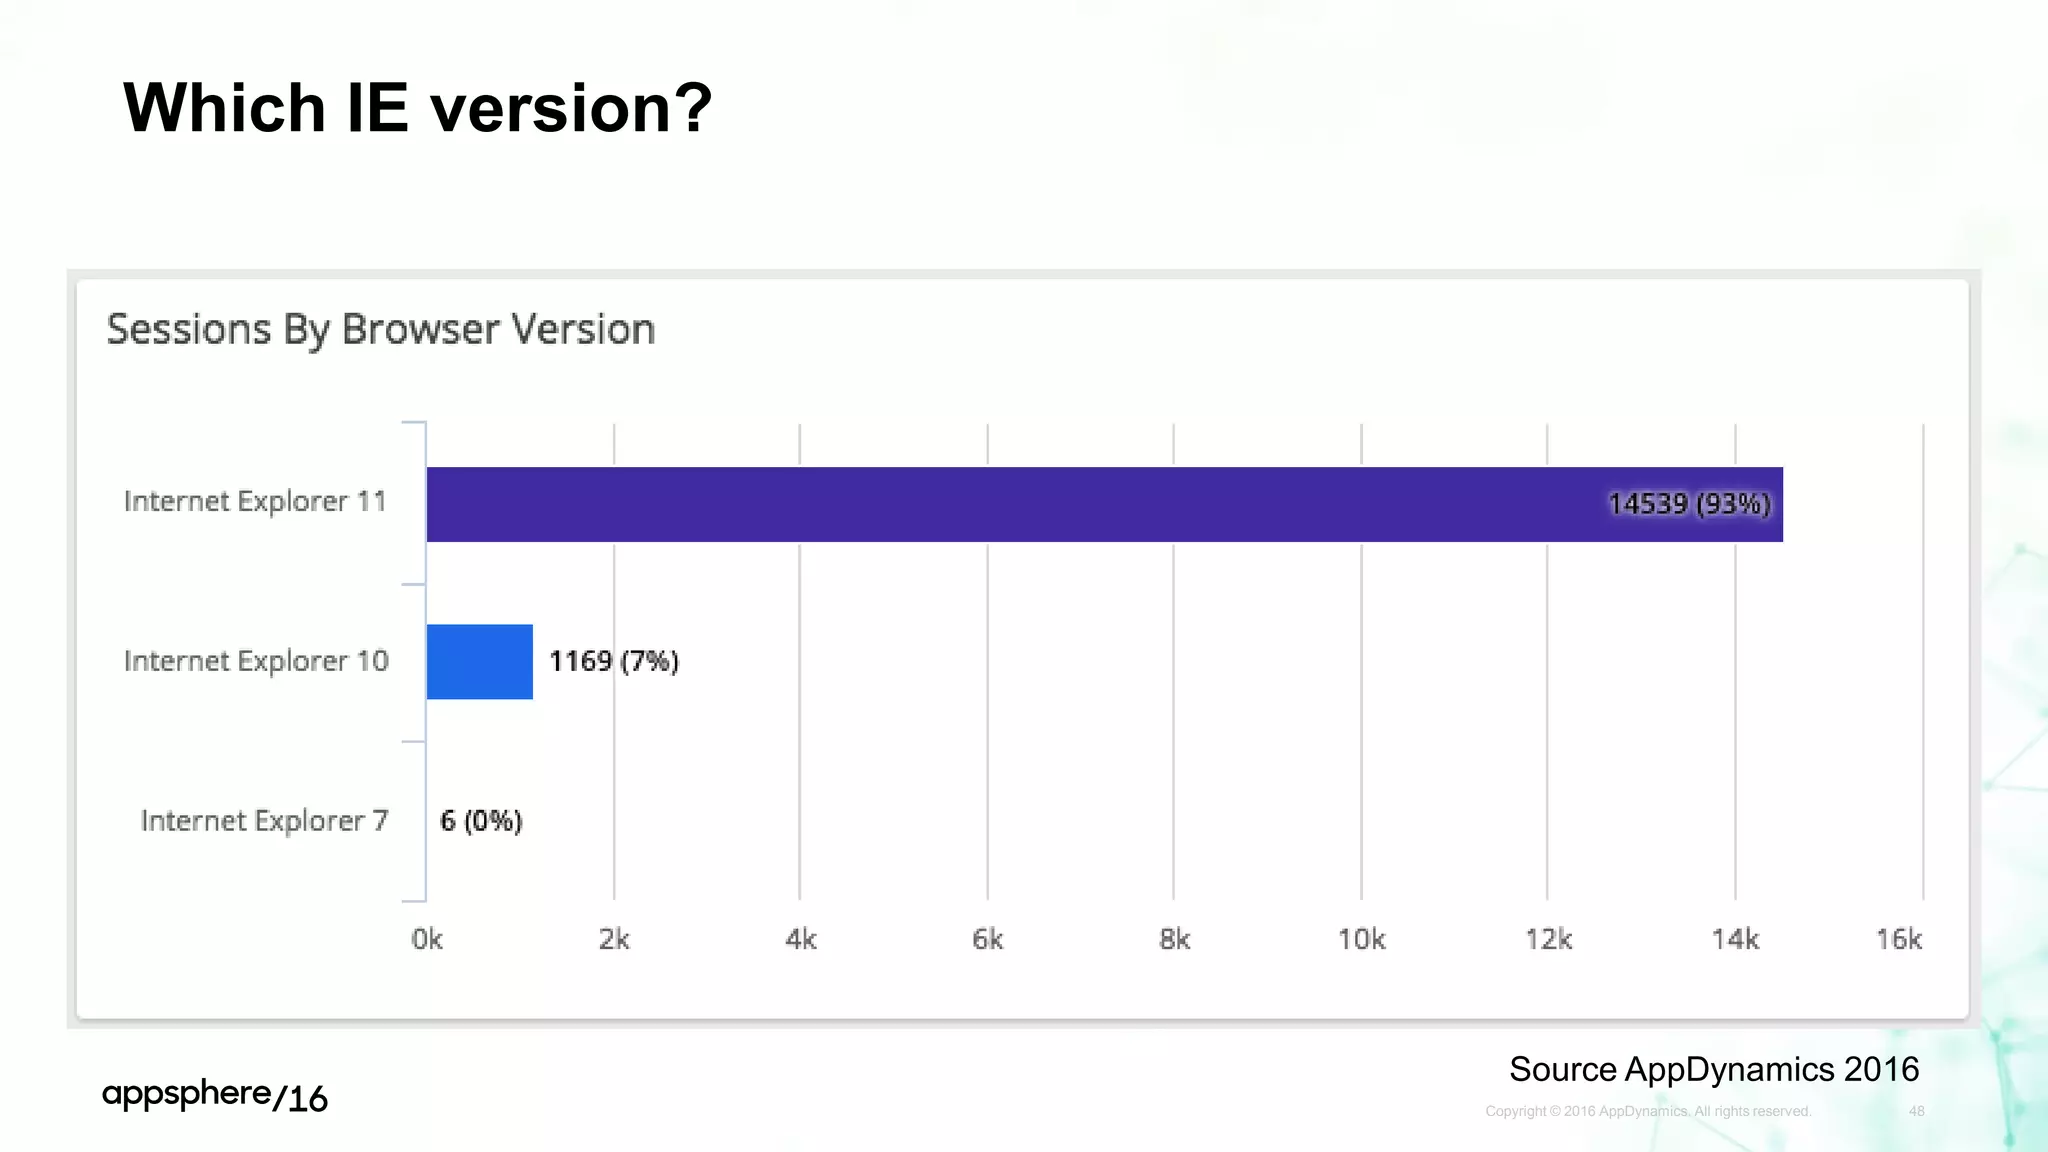
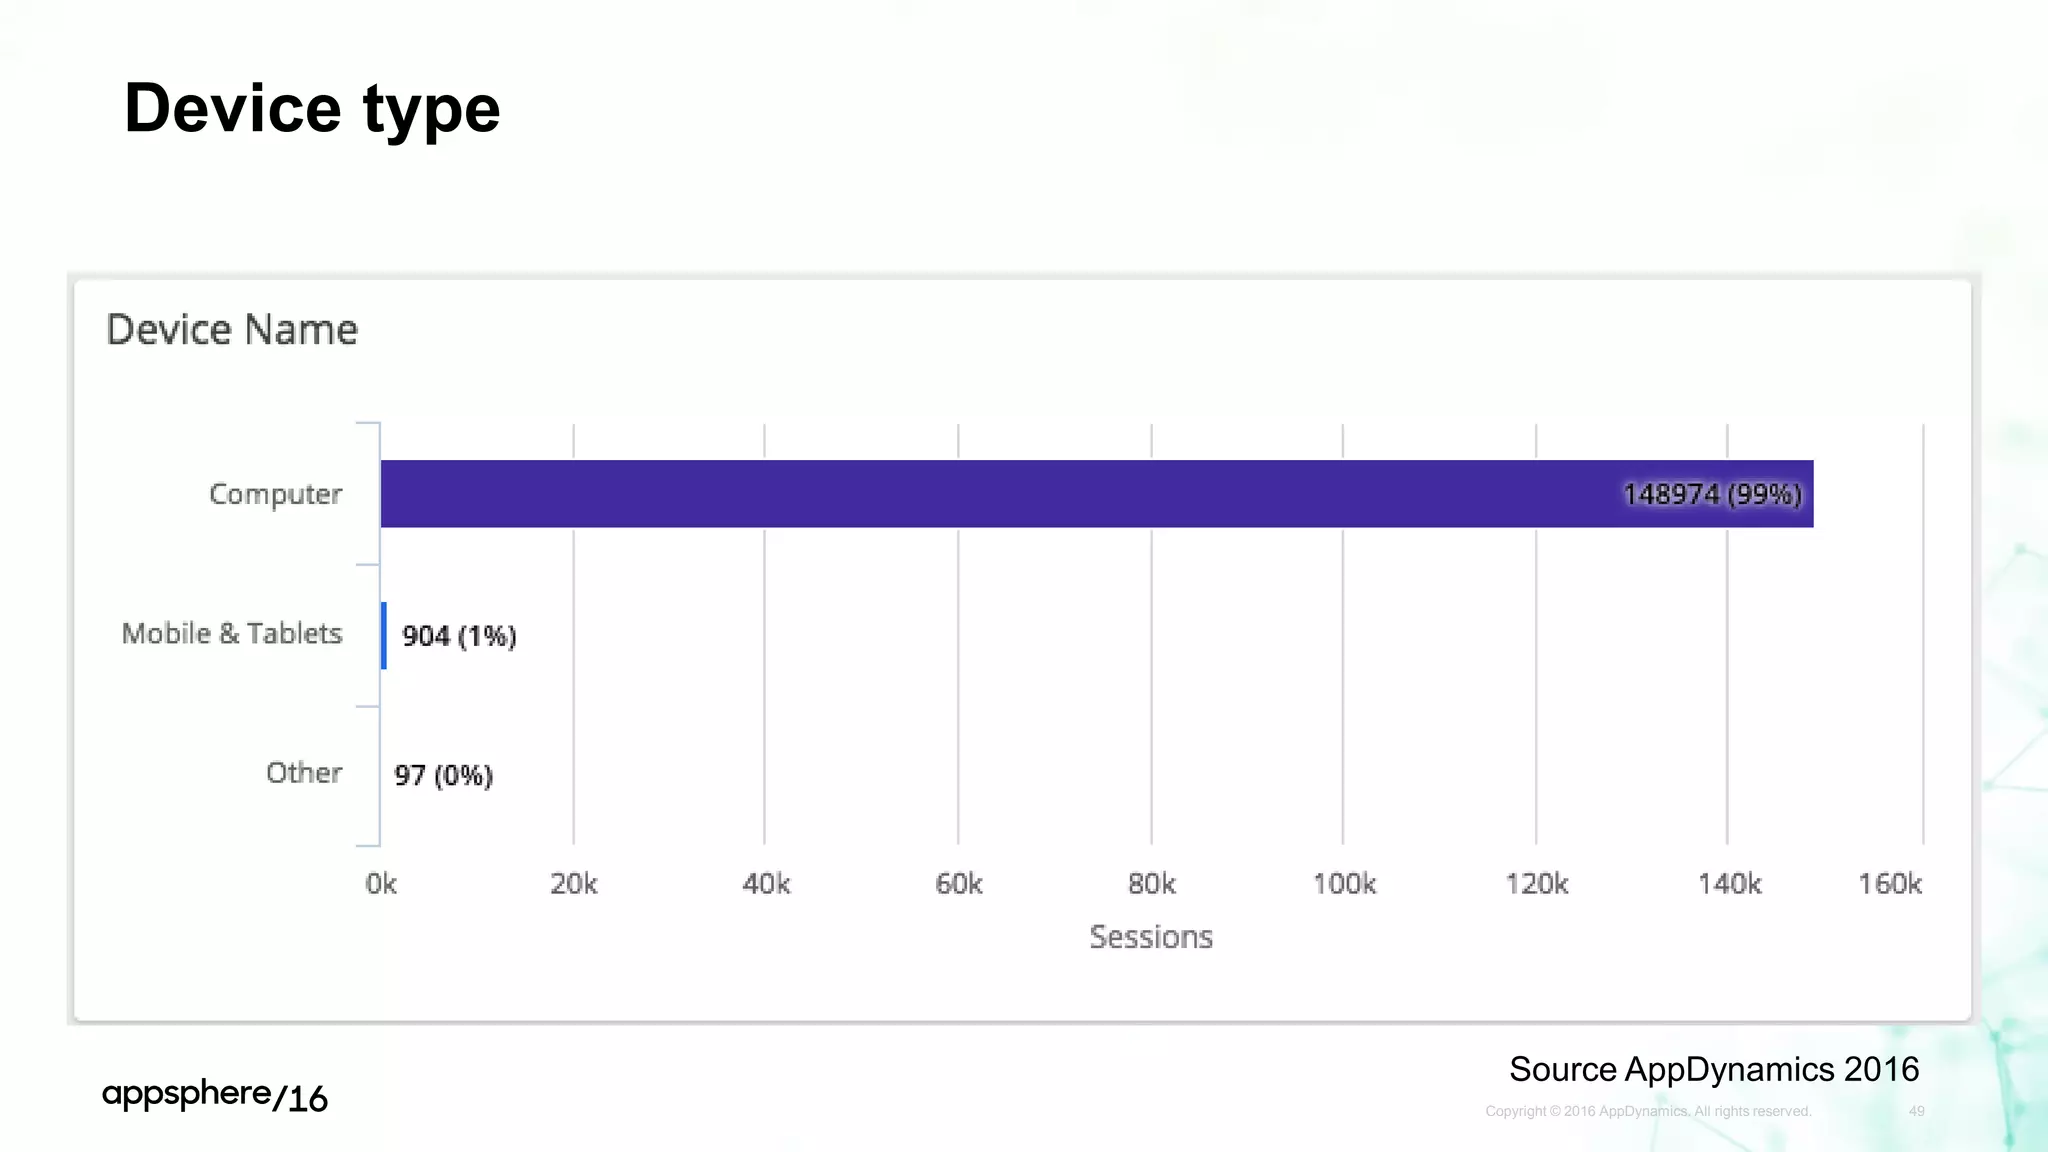
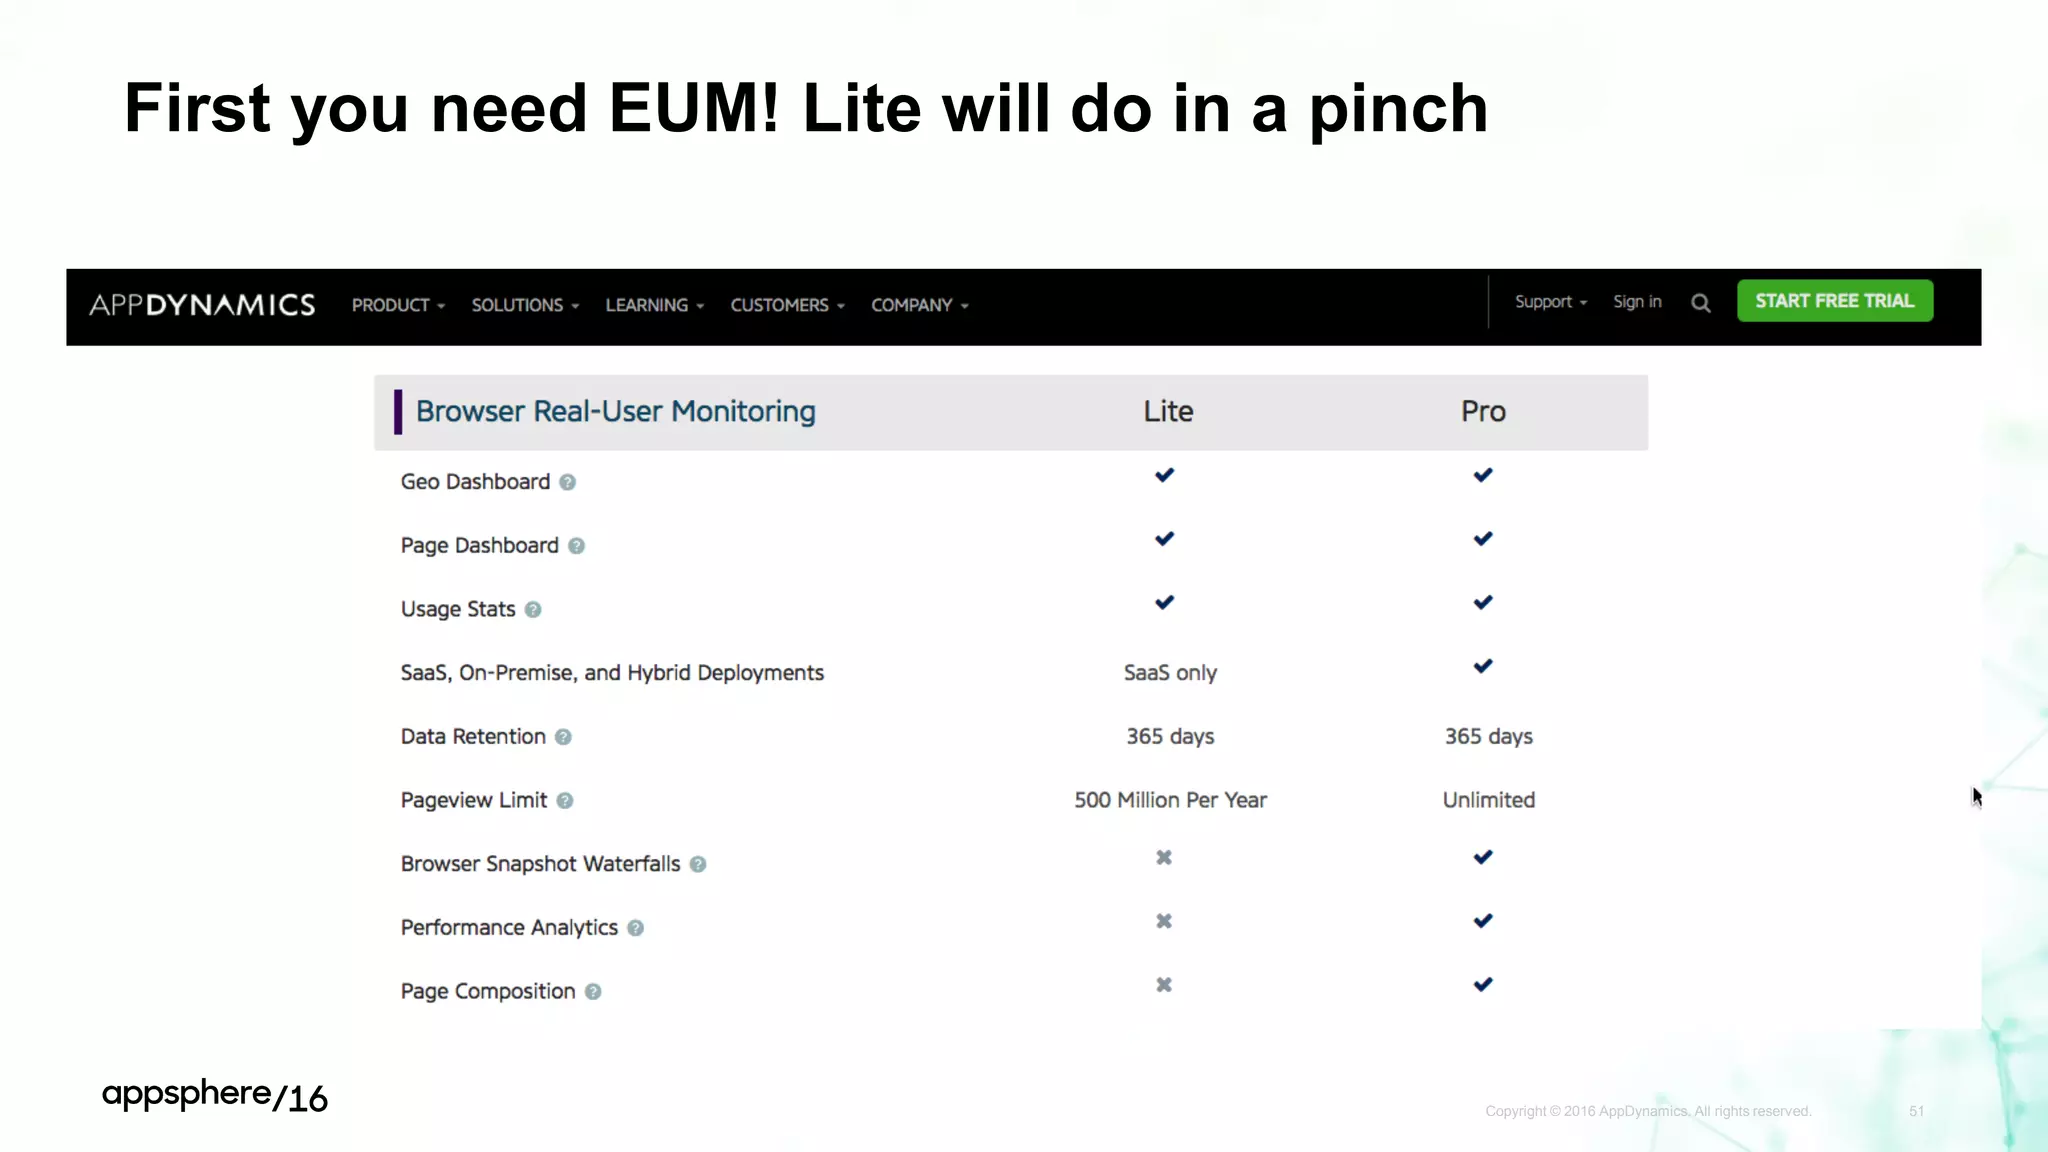
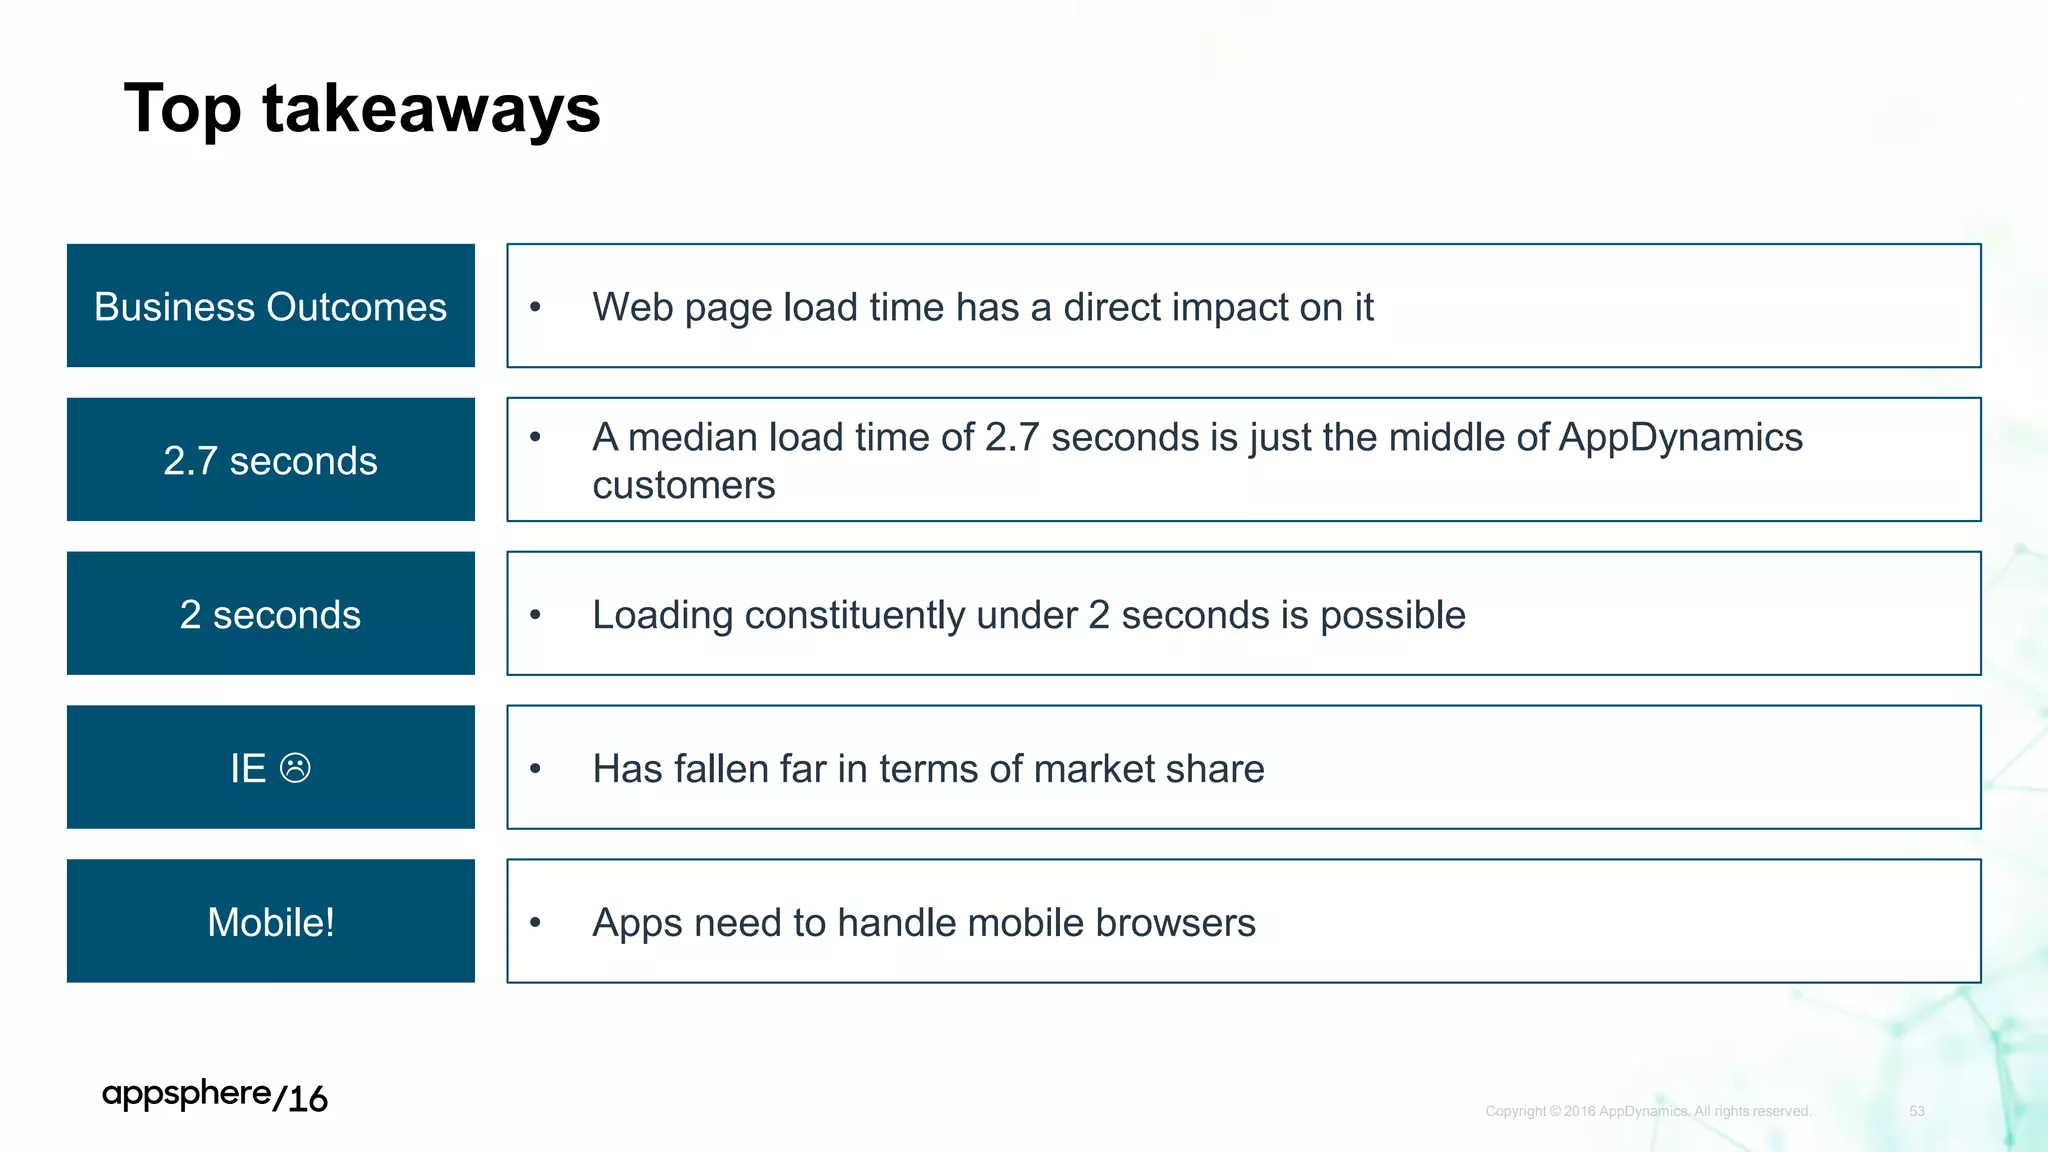
Global End User Experience
Ian Withrow
Group Product Manager | AppDynamics
APPDYNAMICS CONFIDENTIAL AND PROPRIETARY 2
Notice
The information and materials included in this presentation (collectively, the
“Materials”) are the proprietary information of AppDynamics, Inc. (“AppDynamics” or
the “Company”). No part of the Materials may be reproduced, distributed,
communicated or displayed in any form or by any means, or used to make any
derivative work, without prior written permission from AppDynamics.
The Materials may contain product roadmap information of AppDynamics.
AppDynamics reserves the right to change any product roadmap information at any
time, for any reason and without notice. This information is intended to outline
AppDynamics' general product direction, it is not a guarantee of future product
features, and it should not be relied on in making a purchasing decision. The
development, release, and timing of any features or functionality described for
AppDynamics' products remains at AppDynamics' sole discretion. AppDynamics
reserves the right to change any planned features at any time before making them
generally available as well as never making them generally available.
All third-party trademarks, including names, logos and brands, referenced by
AppDynamics in this presentation are property of their respective owners. All
references to third-party trademarks are for identification purposes only and shall be
considered nominative fair use under trademark law. © 2016 AppDynamics, Inc. All
rights reserved.
Copyright © 2016 AppDynamics. All rights reserved. 3
AppDynamics has this great data we
want to share
Picture by Dominic Alves | Creative Commons
Copyright © 2016 AppDynamics. All rights reserved. 4
But first I want to get everyone on the
same page
Picture by Bradley P Johnson| Creative Commons
Copyright © 2016 AppDynamics. All rights reserved. 5
Why do we care about how fast
websites load?
Picture by Eric Fischer | Creative Commons
Performance got its start with Robert Miller in 1968
• Idea: performance impacts
effective use of software
• Identified 3 key concepts for how
the human brain interfaces with
machines
• https://www.computer.org/csdl/pro
ceedings/afips/1968/5072/00/507
20267.pdf
Copyright © 2016 AppDynamics. All rights reserved. 6
Copyright © 2016 AppDynamics. All rights reserved. 7
#1 - Less 100-200 ms feels
instantaneous
Picture by Laitr Keiows| Wikimedia Commons
Copyright © 2016 AppDynamics. All rights reserved. 8
Instant is actually bad, it feels fake and
throws users off
Picture by Takeaway | Wikimedia Commons
Copyright © 2016 AppDynamics. All rights reserved. 9
#2 – 1 second allows users to
maintain flow
Picture by Nat Sakunworarat | Public Domain
#3 – Users eventually context switch
Copyright © 2016 AppDynamics. All rights reserved. 10
• Miller thought 10 seconds...
• Users will start to do/think about
something eventually
• Some grab a coffee
• Others…
Copyright © 2016 AppDynamics. All rights reserved. 11
Psychology says the lizard brain
eventually wins
Picture by Yathin S Krishnappa | Wikimedia Commons
Copyright © 2016 AppDynamics. All rights reserved. 12
So if we want the dog to eat we have to
care too
Picture by Buzz Farmers| Creative Commons
The right question: what level of performance is needed?
Copyright © 2016 AppDynamics. All rights reserved. 13
Picture by Mylius | Wikimedia Commons
Two are two fundamental tools folks use to answer this
Copyright © 2016 AppDynamics. All rights reserved. 14
• Normative standards
– Established by experts
• Benchmark
– Measure, set a goal and
manage to it
• Let’s look at expert data and
case studies first
Picture by Nicholas Mutton | Wikimedia Commons
The goal is moving overtime as networks get faster
Copyright © 2016 AppDynamics. All rights reserved. 15
8
4
2
1996 1998 2000 2002 2004 2006 2008 2010
"Ideal" performance overtime (seconds)
Netscape – “Worth the Wait”
Akamai 4 second rule
Akamai 2 second rule
Microsoft Bing: 2-3% revenue per second
Copyright © 2016 AppDynamics. All rights reserved. 16
Source Microsoft 2009
Google Search: 1%-4% Revenue per second
Copyright © 2016 AppDynamics. All rights reserved. 17
Source Google 2009
Shopzilla: 3% Revenue per second
Copyright © 2016 AppDynamics. All rights reserved. 18
84.00%
86.00%
88.00%
90.00%
92.00%
94.00%
96.00%
98.00%
100.00%
9/1/2008
9/8/20089/15/20089/22/20089/29/200810/6/200810/13/200810/20/200810/27/200811/3/200811/10/200811/17/200811/24/2008
Sessions to Google Clicks Ratio
Bizrate
Shopzilla
Source Shopzilla 2009
Walmart.com: Faster sessions convert much more
Copyright © 2016 AppDynamics. All rights reserved. 19
Source Walmart 2013
Copyright © 2016 AppDynamics. All rights reserved. 20
Are large ecommerce/search engines
like you?
Picture by frankieleon | Creative Commons
Is performance a feature or a requirement?
Copyright © 2016 AppDynamics. All rights reserved. 21
Picture by Trenton Kelley | Creative CommonsPicture by Anonymous | Wikimedia Commons
Feature
Copyright © 2016 AppDynamics. All rights reserved. 22
• Transactional
• Limited differentiation
• Outcome leads directly to
money
– Easy ROI case
Picture by Anonymous | Wikimedia Commons
Requirement
• Loyal customers
• Other capabilities drive usage
• At some point bad app
performance probably has an
impact
• Relationship is not as easy to
quantify
• Team may plan for a level of
performance, may have SLAs
• Benchmarking is good tool to
set and maintain these SLAs
Copyright © 2016 AppDynamics. All rights reserved. 23
Picture by Trenton Kelley | Creative Commons
Benchmarking
Copyright © 2016 AppDynamics. All rights reserved. 24
Picture by Simon A. Eugster | Wikimedia Commons
Synthetic strengths and weaknesses
Benefits of Synthetic
• Synthetic is consistent
• You can measure anything
• Great for alerting
• It works and is proven
Copyright © 2016 AppDynamics. All rights reserved. 25
Complaints about synthetic
• But it doesn’t match with real
user experiences
• Lacks breadth
• Guys like Akamai how
engineered their nodes to look
good on synthetic
Experience across AppD customers - methodology
• 1 week of data from late September-early October
• Across all production Browser RUM apps on the EUM cloud
• All performance numbers are in End User Response time in
seconds
• Aka when the browser fires the onload event
– The worst measure of UX that happens to be better than all the others
we have
Copyright © 2016 AppDynamics. All rights reserved. 26
Average web performance around the world
Copyright © 2016 AppDynamics. All rights reserved. 27
6.11
4.92
6.10
6.92
8.75
Global North America Europe APAC South America
Source AppDynamics 2016
Global distribution of performance
Copyright © 2016 AppDynamics. All rights reserved. 28
P50 ~ 3.5 seconds
P75 ~ 7 seconds
P90 ~ 12.5 seconds
P95 ~ 19 seconds
Source AppDynamics 2016
North America distribution of performance
Copyright © 2016 AppDynamics. All rights reserved. 29
P50 ~ 3 seconds
P75 ~ 5.5 seconds
P90 ~ 9.5 seconds
P95 ~ 15.5seconds
Source AppDynamics 2016
European distribution of performance
Copyright © 2016 AppDynamics. All rights reserved. 30
P50 ~ 4 seconds
P75 ~ 7 seconds
P90 ~ 12.5 seconds
P95 ~ 18.5seconds
Source AppDynamics 2016
South American distribution of performance
Copyright © 2016 AppDynamics. All rights reserved. 31
P50 ~ 5.5 seconds
P75 ~ 10 seconds
P90 ~ 18 seconds
P95 ~ 27 seconds
Source AppDynamics 2016
APAC distribution of performance (low N)
Copyright © 2016 AppDynamics. All rights reserved. 32
P50 ~ 3.5 seconds
P75 ~ 7 seconds
P90 ~ 14 seconds
P95 ~ 23 seconds
Source AppDynamics 2016
APAC distribution from 13 seconds to 30 second buckets
Copyright © 2016 AppDynamics. All rights reserved. 33
P95 ~ 23 seconds
P90 ~ 14 seconds
Source AppDynamics 2016
So how do you match up vs. your peers?
Copyright © 2016 AppDynamics. All rights reserved. 34
4.5
2.7
4.7
8.1
11.8
19.0
26.6
Average
P50
P75
P90
P95
P98
P99
Median load time by company (top 200)
Source AppDynamics 2016
How do AppD customers match up against the 2s rule?
Copyright © 2016 AppDynamics. All rights reserved. 35
35%
16%
7%
50% of the time 75% of the time 90% of the time
Fraction of customers that consistently load under 2 seconds
(top 200)
Source AppDynamics 2016
OK, let’s move on to something less intense: user devices
Copyright © 2016 AppDynamics. All rights reserved. 36
Picture by Maurizio Pesce | Wikimedia Commons
Break out between computers and mobile devices
Copyright © 2016 AppDynamics. All rights reserved. 37
67%
72%
61%
85%
76%
33%
28%
39%
15%
24%
Global
North America
Europe
APAC
South America
Source AppDynamics 2016
Browser usage – mobile
Copyright © 2016 AppDynamics. All rights reserved. 38
Chrome
Android Mobile
iOS Mobile
Internet Explorer
Firefox
Safari
Edge
iOS Chrome
Other
Source AppDynamics 2016
North America browsers
Copyright © 2016 AppDynamics. All rights reserved. 39
Chrome
Internet Explorer
iOS Mobile
Android Mobile
Firefox
Safari
Edge
iOS Chrome
Other
Source AppDynamics 2016
European browsers
Copyright © 2016 AppDynamics. All rights reserved. 40
Chrome
iOS Mobile
Android Mobile
Internet Explorer
Firefox
Safari
Edge
iOS Chrome
Other
Source AppDynamics 2016
South America
Copyright © 2016 AppDynamics. All rights reserved. 41
Chrome
Android Mobile
Internet Explorer
Firefox
iOS Mobile
Safari
Edge
Other
iOS Chrome
Source AppDynamics 2016
APAC browsers
Copyright © 2016 AppDynamics. All rights reserved. 42
Chrome
Safari
Internet Explorer
Firefox
iOS Mobile
Android Mobile
Edge
Other
iOS Chrome
Source AppDynamics 2016
Copyright © 2016 AppDynamics. All rights reserved. 43
Wait what?
Picture by Yathin S Krishnappa | Wikimedia Commons
Digging deeper into the data….
Copyright © 2016 AppDynamics. All rights reserved. 44
• APAC N is small
• Safari on Windows is almost all
from one online game customer
• Hypothesis: Some ‘other’ webkit
browser that looks like to be
Safari on Windows
Picture by Yoel Ben-Avraham| Creative Commons
Sougou User agent is almost identical to Windows Safari
Copyright © 2016 AppDynamics. All rights reserved. 45
Histogram of load times
Copyright © 2016 AppDynamics. All rights reserved. 46
Source AppDynamics 2016
AppD users by browser
Copyright © 2016 AppDynamics. All rights reserved. 47
Source AppDynamics 2016
Which IE version?
Copyright © 2016 AppDynamics. All rights reserved. 48
Source AppDynamics 2016
Device type
Copyright © 2016 AppDynamics. All rights reserved. 49
Source AppDynamics 2016
You can do this too!
Copyright © 2016 AppDynamics. All rights reserved. 50
First you need EUM! Lite will do in a pinch
Copyright © 2016 AppDynamics. All rights reserved. 51
Live demo
Copyright © 2016 AppDynamics. All rights reserved.52
Top takeaways
Copyright © 2016 AppDynamics. All rights reserved. 53
Business Outcomes • Web page load time has a direct impact on it
2.7 seconds
• A median load time of 2.7 seconds is just the middle of AppDynamics
customers
2 seconds • Loading constituently under 2 seconds is possible
IE  • Has fallen far in terms of market share
Mobile! • Apps need to handle mobile browsers
Please give us your feedback—Session T10646
• Complete the online survey you'll receive via
email later today or via text at:
Text this number: 878787
Text this word: APPSPHERE
• Every time you submit a session survey, your
name will be entered in a random drawing.
We're giving away Amazon Echos
to 5 lucky winners!
• Thank you for your input
APPDYNAMICS CONFIDENTIAL AND PROPRIETARY 54
Win!
Thank you
Backup Slides
Copyright © 2016 AppDynamics. All rights reserved.56
Find your app or get started to setup
Copyright © 2016 AppDynamics. All rights reserved. 57
The first screen provides mean (P50) performance
Copyright © 2016 AppDynamics. All rights reserved. 58
If you just have Lite try the Geo Dashboard for average
Copyright © 2016 AppDynamics. All rights reserved. 59
Checkout “Analyze” to explore the data interactively
Copyright © 2016 AppDynamics. All rights reserved. 60

Best Practices and Advanced Insights on Browser RUM Users - AppSphere16

  • 1.
    Global End UserExperience Ian Withrow Group Product Manager | AppDynamics
  • 2.
    APPDYNAMICS CONFIDENTIAL ANDPROPRIETARY 2 Notice The information and materials included in this presentation (collectively, the “Materials”) are the proprietary information of AppDynamics, Inc. (“AppDynamics” or the “Company”). No part of the Materials may be reproduced, distributed, communicated or displayed in any form or by any means, or used to make any derivative work, without prior written permission from AppDynamics. The Materials may contain product roadmap information of AppDynamics. AppDynamics reserves the right to change any product roadmap information at any time, for any reason and without notice. This information is intended to outline AppDynamics' general product direction, it is not a guarantee of future product features, and it should not be relied on in making a purchasing decision. The development, release, and timing of any features or functionality described for AppDynamics' products remains at AppDynamics' sole discretion. AppDynamics reserves the right to change any planned features at any time before making them generally available as well as never making them generally available. All third-party trademarks, including names, logos and brands, referenced by AppDynamics in this presentation are property of their respective owners. All references to third-party trademarks are for identification purposes only and shall be considered nominative fair use under trademark law. © 2016 AppDynamics, Inc. All rights reserved.
  • 3.
    Copyright © 2016AppDynamics. All rights reserved. 3 AppDynamics has this great data we want to share Picture by Dominic Alves | Creative Commons
  • 4.
    Copyright © 2016AppDynamics. All rights reserved. 4 But first I want to get everyone on the same page Picture by Bradley P Johnson| Creative Commons
  • 5.
    Copyright © 2016AppDynamics. All rights reserved. 5 Why do we care about how fast websites load? Picture by Eric Fischer | Creative Commons
  • 6.
    Performance got itsstart with Robert Miller in 1968 • Idea: performance impacts effective use of software • Identified 3 key concepts for how the human brain interfaces with machines • https://www.computer.org/csdl/pro ceedings/afips/1968/5072/00/507 20267.pdf Copyright © 2016 AppDynamics. All rights reserved. 6
  • 7.
    Copyright © 2016AppDynamics. All rights reserved. 7 #1 - Less 100-200 ms feels instantaneous Picture by Laitr Keiows| Wikimedia Commons
  • 8.
    Copyright © 2016AppDynamics. All rights reserved. 8 Instant is actually bad, it feels fake and throws users off Picture by Takeaway | Wikimedia Commons
  • 9.
    Copyright © 2016AppDynamics. All rights reserved. 9 #2 – 1 second allows users to maintain flow Picture by Nat Sakunworarat | Public Domain
  • 10.
    #3 – Userseventually context switch Copyright © 2016 AppDynamics. All rights reserved. 10 • Miller thought 10 seconds... • Users will start to do/think about something eventually • Some grab a coffee • Others…
  • 11.
    Copyright © 2016AppDynamics. All rights reserved. 11 Psychology says the lizard brain eventually wins Picture by Yathin S Krishnappa | Wikimedia Commons
  • 12.
    Copyright © 2016AppDynamics. All rights reserved. 12 So if we want the dog to eat we have to care too Picture by Buzz Farmers| Creative Commons
  • 13.
    The right question:what level of performance is needed? Copyright © 2016 AppDynamics. All rights reserved. 13 Picture by Mylius | Wikimedia Commons
  • 14.
    Two are twofundamental tools folks use to answer this Copyright © 2016 AppDynamics. All rights reserved. 14 • Normative standards – Established by experts • Benchmark – Measure, set a goal and manage to it • Let’s look at expert data and case studies first Picture by Nicholas Mutton | Wikimedia Commons
  • 15.
    The goal ismoving overtime as networks get faster Copyright © 2016 AppDynamics. All rights reserved. 15 8 4 2 1996 1998 2000 2002 2004 2006 2008 2010 "Ideal" performance overtime (seconds) Netscape – “Worth the Wait” Akamai 4 second rule Akamai 2 second rule
  • 16.
    Microsoft Bing: 2-3%revenue per second Copyright © 2016 AppDynamics. All rights reserved. 16 Source Microsoft 2009
  • 17.
    Google Search: 1%-4%Revenue per second Copyright © 2016 AppDynamics. All rights reserved. 17 Source Google 2009
  • 18.
    Shopzilla: 3% Revenueper second Copyright © 2016 AppDynamics. All rights reserved. 18 84.00% 86.00% 88.00% 90.00% 92.00% 94.00% 96.00% 98.00% 100.00% 9/1/2008 9/8/20089/15/20089/22/20089/29/200810/6/200810/13/200810/20/200810/27/200811/3/200811/10/200811/17/200811/24/2008 Sessions to Google Clicks Ratio Bizrate Shopzilla Source Shopzilla 2009
  • 19.
    Walmart.com: Faster sessionsconvert much more Copyright © 2016 AppDynamics. All rights reserved. 19 Source Walmart 2013
  • 20.
    Copyright © 2016AppDynamics. All rights reserved. 20 Are large ecommerce/search engines like you? Picture by frankieleon | Creative Commons
  • 21.
    Is performance afeature or a requirement? Copyright © 2016 AppDynamics. All rights reserved. 21 Picture by Trenton Kelley | Creative CommonsPicture by Anonymous | Wikimedia Commons
  • 22.
    Feature Copyright © 2016AppDynamics. All rights reserved. 22 • Transactional • Limited differentiation • Outcome leads directly to money – Easy ROI case Picture by Anonymous | Wikimedia Commons
  • 23.
    Requirement • Loyal customers •Other capabilities drive usage • At some point bad app performance probably has an impact • Relationship is not as easy to quantify • Team may plan for a level of performance, may have SLAs • Benchmarking is good tool to set and maintain these SLAs Copyright © 2016 AppDynamics. All rights reserved. 23 Picture by Trenton Kelley | Creative Commons
  • 24.
    Benchmarking Copyright © 2016AppDynamics. All rights reserved. 24 Picture by Simon A. Eugster | Wikimedia Commons
  • 25.
    Synthetic strengths andweaknesses Benefits of Synthetic • Synthetic is consistent • You can measure anything • Great for alerting • It works and is proven Copyright © 2016 AppDynamics. All rights reserved. 25 Complaints about synthetic • But it doesn’t match with real user experiences • Lacks breadth • Guys like Akamai how engineered their nodes to look good on synthetic
  • 26.
    Experience across AppDcustomers - methodology • 1 week of data from late September-early October • Across all production Browser RUM apps on the EUM cloud • All performance numbers are in End User Response time in seconds • Aka when the browser fires the onload event – The worst measure of UX that happens to be better than all the others we have Copyright © 2016 AppDynamics. All rights reserved. 26
  • 27.
    Average web performancearound the world Copyright © 2016 AppDynamics. All rights reserved. 27 6.11 4.92 6.10 6.92 8.75 Global North America Europe APAC South America Source AppDynamics 2016
  • 28.
    Global distribution ofperformance Copyright © 2016 AppDynamics. All rights reserved. 28 P50 ~ 3.5 seconds P75 ~ 7 seconds P90 ~ 12.5 seconds P95 ~ 19 seconds Source AppDynamics 2016
  • 29.
    North America distributionof performance Copyright © 2016 AppDynamics. All rights reserved. 29 P50 ~ 3 seconds P75 ~ 5.5 seconds P90 ~ 9.5 seconds P95 ~ 15.5seconds Source AppDynamics 2016
  • 30.
    European distribution ofperformance Copyright © 2016 AppDynamics. All rights reserved. 30 P50 ~ 4 seconds P75 ~ 7 seconds P90 ~ 12.5 seconds P95 ~ 18.5seconds Source AppDynamics 2016
  • 31.
    South American distributionof performance Copyright © 2016 AppDynamics. All rights reserved. 31 P50 ~ 5.5 seconds P75 ~ 10 seconds P90 ~ 18 seconds P95 ~ 27 seconds Source AppDynamics 2016
  • 32.
    APAC distribution ofperformance (low N) Copyright © 2016 AppDynamics. All rights reserved. 32 P50 ~ 3.5 seconds P75 ~ 7 seconds P90 ~ 14 seconds P95 ~ 23 seconds Source AppDynamics 2016
  • 33.
    APAC distribution from13 seconds to 30 second buckets Copyright © 2016 AppDynamics. All rights reserved. 33 P95 ~ 23 seconds P90 ~ 14 seconds Source AppDynamics 2016
  • 34.
    So how doyou match up vs. your peers? Copyright © 2016 AppDynamics. All rights reserved. 34 4.5 2.7 4.7 8.1 11.8 19.0 26.6 Average P50 P75 P90 P95 P98 P99 Median load time by company (top 200) Source AppDynamics 2016
  • 35.
    How do AppDcustomers match up against the 2s rule? Copyright © 2016 AppDynamics. All rights reserved. 35 35% 16% 7% 50% of the time 75% of the time 90% of the time Fraction of customers that consistently load under 2 seconds (top 200) Source AppDynamics 2016
  • 36.
    OK, let’s moveon to something less intense: user devices Copyright © 2016 AppDynamics. All rights reserved. 36 Picture by Maurizio Pesce | Wikimedia Commons
  • 37.
    Break out betweencomputers and mobile devices Copyright © 2016 AppDynamics. All rights reserved. 37 67% 72% 61% 85% 76% 33% 28% 39% 15% 24% Global North America Europe APAC South America Source AppDynamics 2016
  • 38.
    Browser usage –mobile Copyright © 2016 AppDynamics. All rights reserved. 38 Chrome Android Mobile iOS Mobile Internet Explorer Firefox Safari Edge iOS Chrome Other Source AppDynamics 2016
  • 39.
    North America browsers Copyright© 2016 AppDynamics. All rights reserved. 39 Chrome Internet Explorer iOS Mobile Android Mobile Firefox Safari Edge iOS Chrome Other Source AppDynamics 2016
  • 40.
    European browsers Copyright ©2016 AppDynamics. All rights reserved. 40 Chrome iOS Mobile Android Mobile Internet Explorer Firefox Safari Edge iOS Chrome Other Source AppDynamics 2016
  • 41.
    South America Copyright ©2016 AppDynamics. All rights reserved. 41 Chrome Android Mobile Internet Explorer Firefox iOS Mobile Safari Edge Other iOS Chrome Source AppDynamics 2016
  • 42.
    APAC browsers Copyright ©2016 AppDynamics. All rights reserved. 42 Chrome Safari Internet Explorer Firefox iOS Mobile Android Mobile Edge Other iOS Chrome Source AppDynamics 2016
  • 43.
    Copyright © 2016AppDynamics. All rights reserved. 43 Wait what? Picture by Yathin S Krishnappa | Wikimedia Commons
  • 44.
    Digging deeper intothe data…. Copyright © 2016 AppDynamics. All rights reserved. 44 • APAC N is small • Safari on Windows is almost all from one online game customer • Hypothesis: Some ‘other’ webkit browser that looks like to be Safari on Windows Picture by Yoel Ben-Avraham| Creative Commons
  • 45.
    Sougou User agentis almost identical to Windows Safari Copyright © 2016 AppDynamics. All rights reserved. 45
  • 46.
    Histogram of loadtimes Copyright © 2016 AppDynamics. All rights reserved. 46 Source AppDynamics 2016
  • 47.
    AppD users bybrowser Copyright © 2016 AppDynamics. All rights reserved. 47 Source AppDynamics 2016
  • 48.
    Which IE version? Copyright© 2016 AppDynamics. All rights reserved. 48 Source AppDynamics 2016
  • 49.
    Device type Copyright ©2016 AppDynamics. All rights reserved. 49 Source AppDynamics 2016
  • 50.
    You can dothis too! Copyright © 2016 AppDynamics. All rights reserved. 50
  • 51.
    First you needEUM! Lite will do in a pinch Copyright © 2016 AppDynamics. All rights reserved. 51
  • 52.
    Live demo Copyright ©2016 AppDynamics. All rights reserved.52
  • 53.
    Top takeaways Copyright ©2016 AppDynamics. All rights reserved. 53 Business Outcomes • Web page load time has a direct impact on it 2.7 seconds • A median load time of 2.7 seconds is just the middle of AppDynamics customers 2 seconds • Loading constituently under 2 seconds is possible IE  • Has fallen far in terms of market share Mobile! • Apps need to handle mobile browsers
  • 54.
    Please give usyour feedback—Session T10646 • Complete the online survey you'll receive via email later today or via text at: Text this number: 878787 Text this word: APPSPHERE • Every time you submit a session survey, your name will be entered in a random drawing. We're giving away Amazon Echos to 5 lucky winners! • Thank you for your input APPDYNAMICS CONFIDENTIAL AND PROPRIETARY 54 Win!
  • 55.
  • 56.
    Backup Slides Copyright ©2016 AppDynamics. All rights reserved.56
  • 57.
    Find your appor get started to setup Copyright © 2016 AppDynamics. All rights reserved. 57
  • 58.
    The first screenprovides mean (P50) performance Copyright © 2016 AppDynamics. All rights reserved. 58
  • 59.
    If you justhave Lite try the Geo Dashboard for average Copyright © 2016 AppDynamics. All rights reserved. 59
  • 60.
    Checkout “Analyze” toexplore the data interactively Copyright © 2016 AppDynamics. All rights reserved. 60