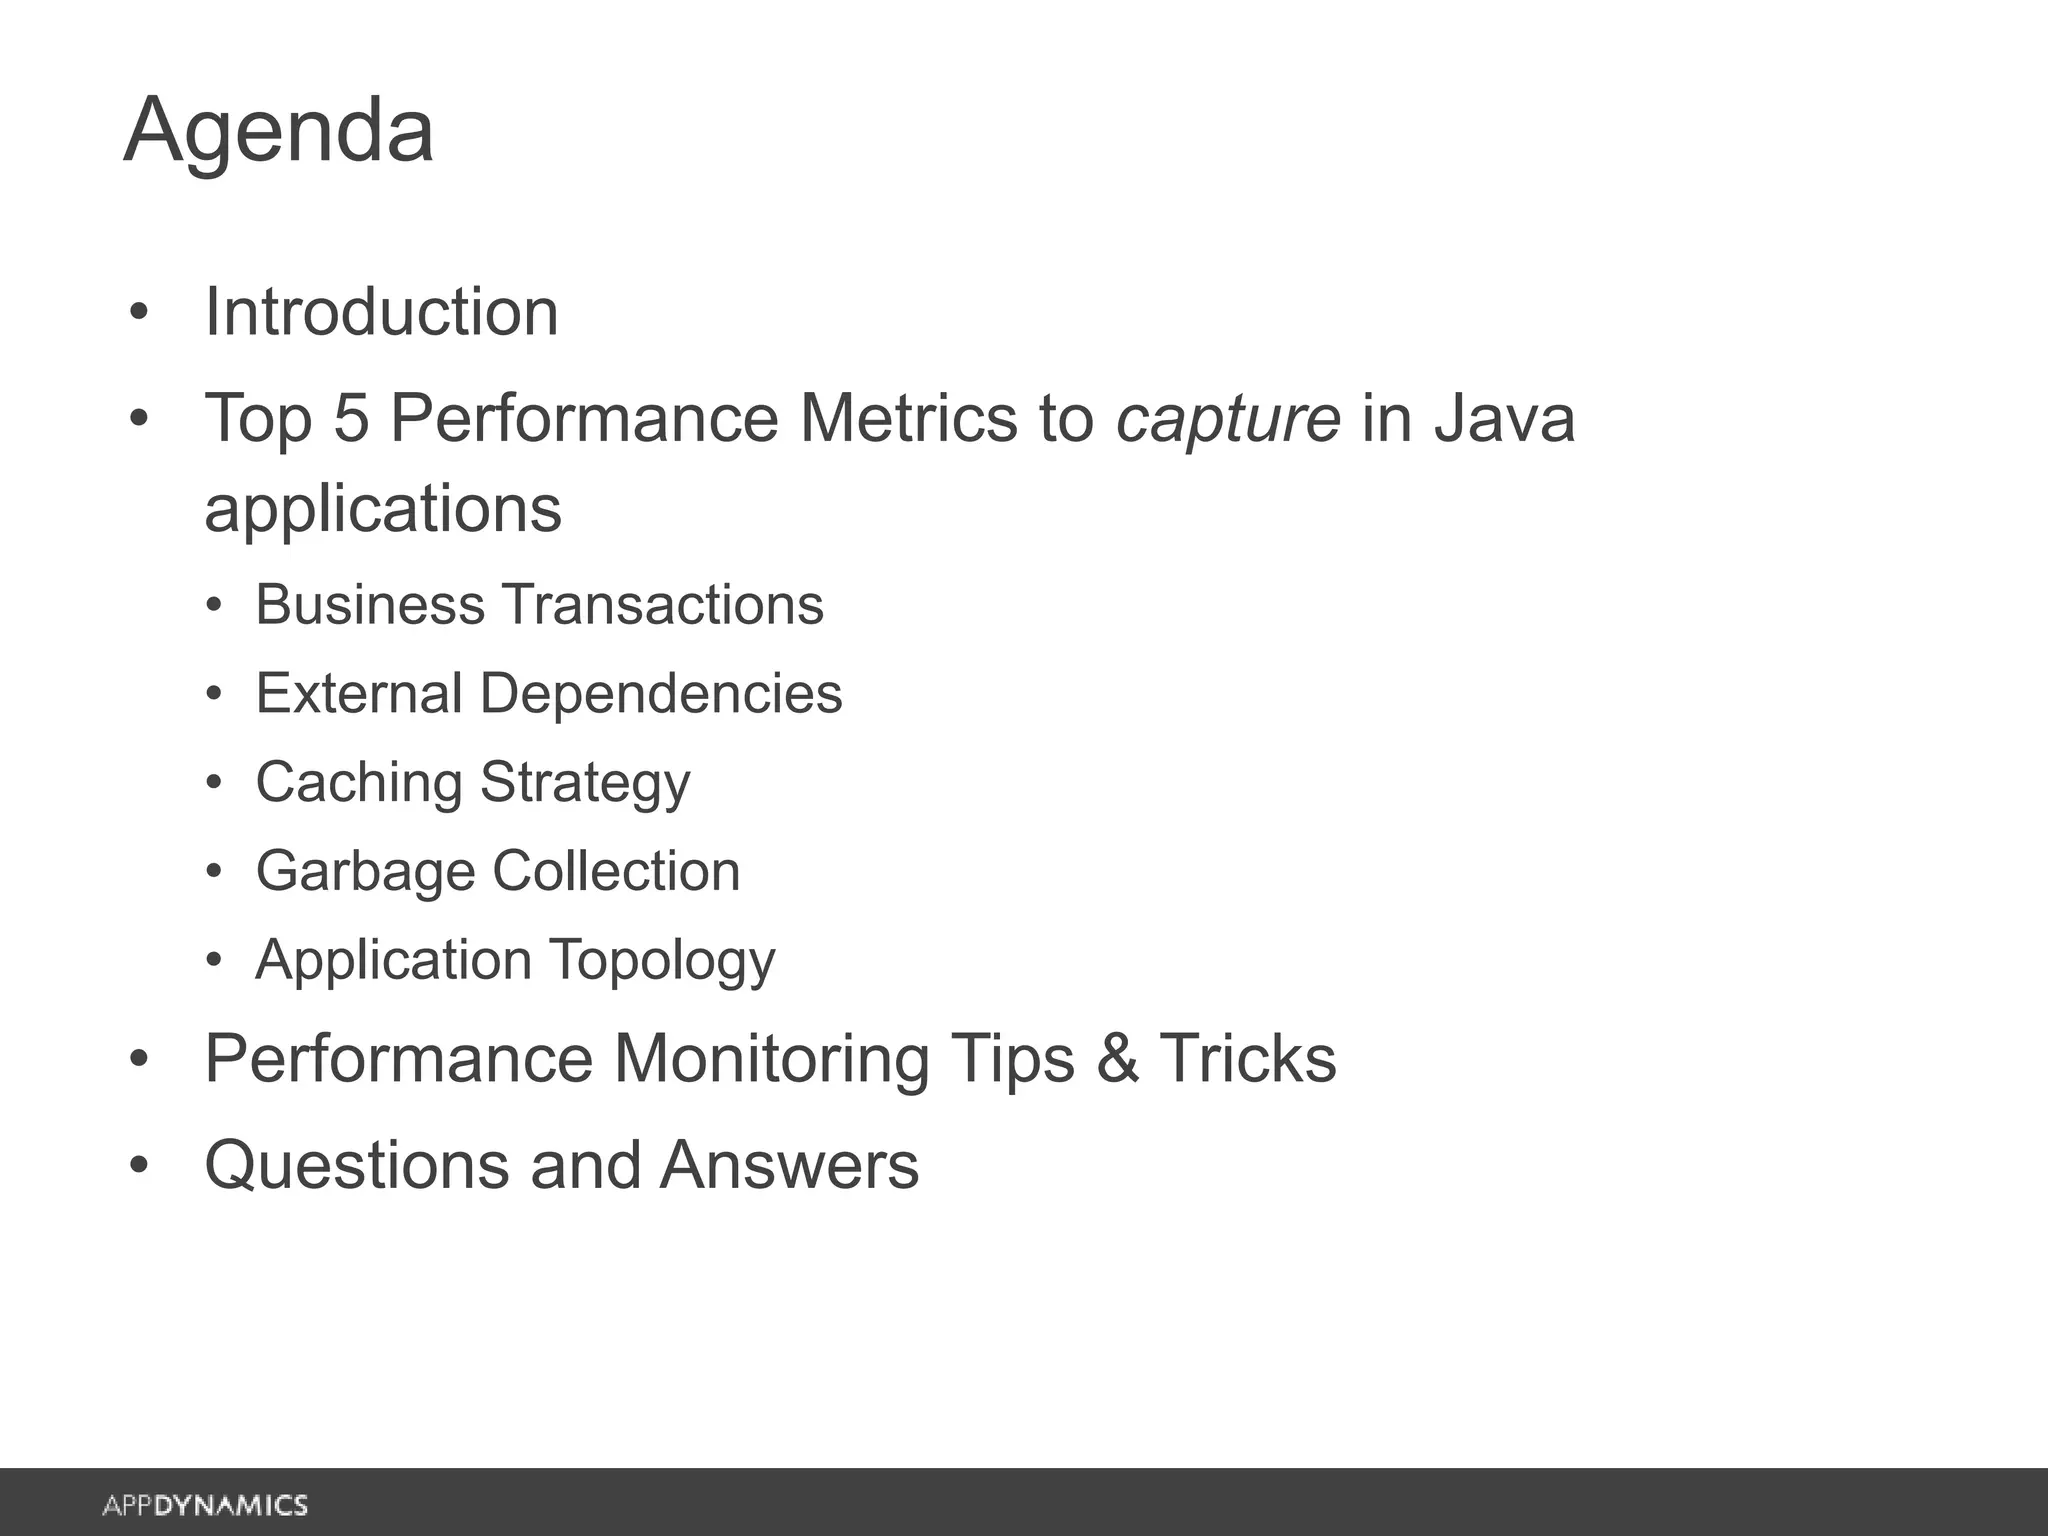
Top 5 Java Performance Metrics,
Tips & Tricks
Steven Haines, Java Expert and Author
Agenda
• Introduction
• Top 5 Performance Metrics to capture in Java
applications
• Business Transactions
• External Dependencies
• Caching Strategy
• Garbage Collection
• Application Topology
• Performance Monitoring Tips & Tricks
• Questions and Answers
About the Speakers
Steven Haines
• Author of two Java programming books and a
Java performance management book, over 500
articles, and a dozen white papers
• Former Java instructor at the University of
California, Irvine (UCI)
• Spent the better part of the last 6 years working
as an architect on Walt Disney World’s
MyMagic+ and other Disney initiatives
Anand Akela
• Director, Product Marketing, AppDynamics
Introduction
Why is performance so important?
• Cost to business
• Cost to reputation
• Sleepless nights…
Top 5 Performance Metrics to capture
• There are so many metrics and so many different
strategies to interpret them so how do we get the
biggest bang for our efforts?
• This presentation reviews strategies for identifying
performance issues in your application
Top 5 performance metrics to capture
#1 Business Transactions
• Business Transactions (BTs) capture real users
interacting with your application
• Capture requests from an entry-point
• Web request, Servlet, Struts Action, Spring MVC
Controller, message on a message queue, etc.
• Follow the request through the container
• Identify exit-points through which the request
goes to another container
• Web service call, RMI, JDBC, JMS, etc.
• Instrument every container and correlate BT
segments from each container into the holistic BT
Business Transactions
Baselines
• Baselines: measure what “normal” is and
determine whether or not your business
transactions are behaving “normally”
• Baseline Types
• Response times over a period of time
• Response times based on hour of day
• Response times based on hour of day and day of week
• Response times based on hour of day and day of
month
Baseline Alerts
#2 External Dependencies
• An external dependency is any system with
which your application interacts to accomplish its
business goal
• Web services, Databases (SQL and NoSQL), Legacy
Systems, Caches, Key/Value Stores, etc.
• Differentiate between applications problems and
dependency problems
• If your dependencies are not automatically
identified by your APM solution, configure them!
#3 Caching Strategy
• It is always faster to serve an object from
memory than it is to make a network call to
retrieve data from a dependent source
• IMHO, people that do not like caching are not
configuring them properly
• Two types of errors
• Loading too much data into your cache
• Not properly sizing the cache
Cache Thrashing
#4 Garbage Collection
• Garbage collection has been and continues to be the
biggest component of poor JVM performance
• It removed the notion of manual memory management
and eliminated traditional memory leaks, but at the cost
of sometimes cumbersome garbage collection processes
• Different JVMs have different strategies that each
introduce their own set of benefits and challenges
• Understanding how garbage collection works will help you tune it
• For this discussion we’ll review the Sun JVM
Reachability Test
Minor and Major GCs
Minor Collection Major Collection
#5 Application Topology
• With the advent of the cloud, applications can
now be elastic in nature: your application
environment can grow and shrink to meet your
user demand
• Take inventory of your servers and ensure that
your environment is sized optimally
• Too many servers means a higher cloud cost and
wasted resources
• Too few servers means that servers will be
overburdened and your business transactions will
suffer
Performance Monitoring
Tips & Tricks
Business Transaction Optimization
• It is important to capture the business
transactions that are important to you
• Properly name BTs to match your business processes
• Filter out the BTs that are not important
• Capture BTs properly
• Default behavior may not match your business needs
• If your URLs are complex then tell AppDynamics how
to interpret them
• If you have a central controller that differentiates
functionality by payload then configure it as such
• Etc.
Snapshot Tuning
• Snapshots are invaluable in helping you identify the root
cause of your performance problems; they give you a
trace through your entire business transaction with
associated response times
• Default snapshot configuration samples threads every
10ms
• If you do not need this level of granularity then increasing the
interval will reduce overhead at the cost of granularity
• Slow transactions are configured to capture up to 5
samples per minute for 5 minutes
• If you typically only examine two or three snapshots then turn this
down
Threshold Tuning
• Thresholds control when alerts are raised and
when snapshots are triggered
• Three types of thresholds:
• Static SLA
• Standard Deviation
• Percentage
• Choose and configure the strategy that meets
your business needs
Tier Management
• AppDynamics measures and evaluates
performance at the business transaction level as
well as at the segment level
• Segments are defined by the tiers that
implement them and are transitioned via exit-
points
• Standard protocols are available out-of-the-box
• If you have non-standard communication
protocols then you need to tell AppDynamics
when your code is leaving a tier
Context…
• Many times, when performance issues occur,
contextual information can provide you with
much needed debug content
• AppDynamics allows you to capture
• HTTP Headers
• JMS Properties
• HTTP Query Parameters
• Method Parameter Values
Intelligent Container Recycling
• As applications are moving to the cloud, your
infrastructure is changing
• Smart deployment strategies allow you add
servers to and remove servers from your
environment to meet user demand
• Cycle your virtual machines or containers
intelligently
• Shutdown your oldest machines first so that virtual
machines have short lives
• Anecdotal example: eliminating garbage collection
through smart recycling!
Summary
• Performance is a measurable concern
• We reviewed 5 metrics to capture to help us identify
performance problems
• We reviewed tips-and-tricks for configuring
AppDynamics for optimal performance troubleshooting
http://blog.appdynamics.com/java/top-5-java-performance-metrics-to-capture-
in-enterprise-applications/
Today’s Monitoring: Many Silo-ed Tools
33%
issues are reported by
end users
77%
issues require 5+ people-
hour to resolve
* Survey response from 302 IT
professionals conducted by EMA
65%
enterprises have 10+
monitoring tools.
0%
1%
13%
21%
22%
15%
9%
6%
3%
10%
0% 5% 10% 15% 20% 25%
0
1
2-5
6-10
11-25
26-40
41-50
50-75
76-100
More than 100
Q: how many enterprise monitoring/mgmt products would you estimate your IT org owns?*
AppDynamics Unified Monitoring
One Solution : One UI, One Data Platform, One Install
Copyright © 2014 AppDynamics. All rights reserved. 26
Industry-first application-centric Unified monitoring platform
Copyright © 2015 AppDynamics. All rights reserved. 27
 Business transaction-centric
management
 Role-relevant views for quick
troubleshooting
 One Unified Platform - Easy to
deploy and Use, Flexible
Deployment
 Comprehensive Application
Infrastructure Support
Key Focus Areas of Unified Monitoring
AppDynamics Unified Monitoring Pays off for Paychex
Copyright © 2014 AppDynamics. All rights reserved. 28
Challenges Benefits
Why AppDynamics?
• Tool consolidation – replaced 5 tools with
AppDynamics
• Improved capacity-planning capabilities
• Increased troubleshooting efficiency and staff
prioritization
• Too many monitoring tools and many of them
didn’t meet expectations
• Lack of deep visibility into the application
infrastructure
• Existing monitoring tools couldn’t support the
continuous delivery model with 3 code releases
per week
• Quickly drill down into performance data to troubleshoot
issues
• Integration with enterprise logging and management tools
• Exceptional training and technical support
“AppDynamics replaced 5 tools we once used to try to troubleshoot application problems.
Today, everyone goes to AppDynamics to quickly determine the root cause of the issue.”
- Jason Briggs, Monitoring Engineering Manager, Paychex
https://www.appdynamics.com/case-study/paychex/
Join us in Vegas for our annual user conference,
AppSphere!
- Free training for all attendees
- Exclusive access to AppDynamics executives and engineers
- A sneak peek at our roadmap and announcements about new features
- Keynotes from industry innovators
- Information-packed breakout sessions from users in the trenches
- Peer-to-peer networking
Learn more and register now at Appdynamics.com/AppSphere
Q&A
Sign-up for your Free Trial today!
Copyright © 2014 AppDynamics. All rights reserved. 31
Thank You

Top 5 Java Performance Metrics, Tips & Tricks

  • 1.
    Top 5 JavaPerformance Metrics, Tips & Tricks Steven Haines, Java Expert and Author
  • 2.
    Agenda • Introduction • Top5 Performance Metrics to capture in Java applications • Business Transactions • External Dependencies • Caching Strategy • Garbage Collection • Application Topology • Performance Monitoring Tips & Tricks • Questions and Answers
  • 3.
    About the Speakers StevenHaines • Author of two Java programming books and a Java performance management book, over 500 articles, and a dozen white papers • Former Java instructor at the University of California, Irvine (UCI) • Spent the better part of the last 6 years working as an architect on Walt Disney World’s MyMagic+ and other Disney initiatives Anand Akela • Director, Product Marketing, AppDynamics
  • 4.
    Introduction Why is performanceso important? • Cost to business • Cost to reputation • Sleepless nights… Top 5 Performance Metrics to capture • There are so many metrics and so many different strategies to interpret them so how do we get the biggest bang for our efforts? • This presentation reviews strategies for identifying performance issues in your application
  • 5.
    Top 5 performancemetrics to capture
  • 6.
    #1 Business Transactions •Business Transactions (BTs) capture real users interacting with your application • Capture requests from an entry-point • Web request, Servlet, Struts Action, Spring MVC Controller, message on a message queue, etc. • Follow the request through the container • Identify exit-points through which the request goes to another container • Web service call, RMI, JDBC, JMS, etc. • Instrument every container and correlate BT segments from each container into the holistic BT
  • 7.
  • 8.
    Baselines • Baselines: measurewhat “normal” is and determine whether or not your business transactions are behaving “normally” • Baseline Types • Response times over a period of time • Response times based on hour of day • Response times based on hour of day and day of week • Response times based on hour of day and day of month
  • 9.
  • 10.
    #2 External Dependencies •An external dependency is any system with which your application interacts to accomplish its business goal • Web services, Databases (SQL and NoSQL), Legacy Systems, Caches, Key/Value Stores, etc. • Differentiate between applications problems and dependency problems • If your dependencies are not automatically identified by your APM solution, configure them!
  • 11.
    #3 Caching Strategy •It is always faster to serve an object from memory than it is to make a network call to retrieve data from a dependent source • IMHO, people that do not like caching are not configuring them properly • Two types of errors • Loading too much data into your cache • Not properly sizing the cache
  • 12.
  • 13.
    #4 Garbage Collection •Garbage collection has been and continues to be the biggest component of poor JVM performance • It removed the notion of manual memory management and eliminated traditional memory leaks, but at the cost of sometimes cumbersome garbage collection processes • Different JVMs have different strategies that each introduce their own set of benefits and challenges • Understanding how garbage collection works will help you tune it • For this discussion we’ll review the Sun JVM
  • 14.
  • 15.
    Minor and MajorGCs Minor Collection Major Collection
  • 16.
    #5 Application Topology •With the advent of the cloud, applications can now be elastic in nature: your application environment can grow and shrink to meet your user demand • Take inventory of your servers and ensure that your environment is sized optimally • Too many servers means a higher cloud cost and wasted resources • Too few servers means that servers will be overburdened and your business transactions will suffer
  • 17.
  • 18.
    Business Transaction Optimization •It is important to capture the business transactions that are important to you • Properly name BTs to match your business processes • Filter out the BTs that are not important • Capture BTs properly • Default behavior may not match your business needs • If your URLs are complex then tell AppDynamics how to interpret them • If you have a central controller that differentiates functionality by payload then configure it as such • Etc.
  • 19.
    Snapshot Tuning • Snapshotsare invaluable in helping you identify the root cause of your performance problems; they give you a trace through your entire business transaction with associated response times • Default snapshot configuration samples threads every 10ms • If you do not need this level of granularity then increasing the interval will reduce overhead at the cost of granularity • Slow transactions are configured to capture up to 5 samples per minute for 5 minutes • If you typically only examine two or three snapshots then turn this down
  • 20.
    Threshold Tuning • Thresholdscontrol when alerts are raised and when snapshots are triggered • Three types of thresholds: • Static SLA • Standard Deviation • Percentage • Choose and configure the strategy that meets your business needs
  • 21.
    Tier Management • AppDynamicsmeasures and evaluates performance at the business transaction level as well as at the segment level • Segments are defined by the tiers that implement them and are transitioned via exit- points • Standard protocols are available out-of-the-box • If you have non-standard communication protocols then you need to tell AppDynamics when your code is leaving a tier
  • 22.
    Context… • Many times,when performance issues occur, contextual information can provide you with much needed debug content • AppDynamics allows you to capture • HTTP Headers • JMS Properties • HTTP Query Parameters • Method Parameter Values
  • 23.
    Intelligent Container Recycling •As applications are moving to the cloud, your infrastructure is changing • Smart deployment strategies allow you add servers to and remove servers from your environment to meet user demand • Cycle your virtual machines or containers intelligently • Shutdown your oldest machines first so that virtual machines have short lives • Anecdotal example: eliminating garbage collection through smart recycling!
  • 24.
    Summary • Performance isa measurable concern • We reviewed 5 metrics to capture to help us identify performance problems • We reviewed tips-and-tricks for configuring AppDynamics for optimal performance troubleshooting http://blog.appdynamics.com/java/top-5-java-performance-metrics-to-capture- in-enterprise-applications/
  • 25.
    Today’s Monitoring: ManySilo-ed Tools 33% issues are reported by end users 77% issues require 5+ people- hour to resolve * Survey response from 302 IT professionals conducted by EMA 65% enterprises have 10+ monitoring tools. 0% 1% 13% 21% 22% 15% 9% 6% 3% 10% 0% 5% 10% 15% 20% 25% 0 1 2-5 6-10 11-25 26-40 41-50 50-75 76-100 More than 100 Q: how many enterprise monitoring/mgmt products would you estimate your IT org owns?*
  • 26.
    AppDynamics Unified Monitoring OneSolution : One UI, One Data Platform, One Install Copyright © 2014 AppDynamics. All rights reserved. 26 Industry-first application-centric Unified monitoring platform
  • 27.
    Copyright © 2015AppDynamics. All rights reserved. 27  Business transaction-centric management  Role-relevant views for quick troubleshooting  One Unified Platform - Easy to deploy and Use, Flexible Deployment  Comprehensive Application Infrastructure Support Key Focus Areas of Unified Monitoring
  • 28.
    AppDynamics Unified MonitoringPays off for Paychex Copyright © 2014 AppDynamics. All rights reserved. 28 Challenges Benefits Why AppDynamics? • Tool consolidation – replaced 5 tools with AppDynamics • Improved capacity-planning capabilities • Increased troubleshooting efficiency and staff prioritization • Too many monitoring tools and many of them didn’t meet expectations • Lack of deep visibility into the application infrastructure • Existing monitoring tools couldn’t support the continuous delivery model with 3 code releases per week • Quickly drill down into performance data to troubleshoot issues • Integration with enterprise logging and management tools • Exceptional training and technical support “AppDynamics replaced 5 tools we once used to try to troubleshoot application problems. Today, everyone goes to AppDynamics to quickly determine the root cause of the issue.” - Jason Briggs, Monitoring Engineering Manager, Paychex https://www.appdynamics.com/case-study/paychex/
  • 29.
    Join us inVegas for our annual user conference, AppSphere! - Free training for all attendees - Exclusive access to AppDynamics executives and engineers - A sneak peek at our roadmap and announcements about new features - Keynotes from industry innovators - Information-packed breakout sessions from users in the trenches - Peer-to-peer networking Learn more and register now at Appdynamics.com/AppSphere
  • 30.
  • 31.
    Sign-up for yourFree Trial today! Copyright © 2014 AppDynamics. All rights reserved. 31
  • 32.