Application Of Food Safety Management System (ISO 22000) In Processing Of Wheat Flour Product
•
0 likes•2 views

Professional Writing Servicehttp://StudyHub.vip/Application-Of-Food-Safety-Management-S

Recommended
Recommended
More Related Content
Similar to Application Of Food Safety Management System (ISO 22000) In Processing Of Wheat Flour Product
Similar to Application Of Food Safety Management System (ISO 22000) In Processing Of Wheat Flour Product (20)
More from Sarah Brown
More from Sarah Brown (20)
Recently uploaded
Recently uploaded (20)
Application Of Food Safety Management System (ISO 22000) In Processing Of Wheat Flour Product
- 1. Annals of Agric. Sci., Moshtohor ISSN 1110-0419 Vol. 58(4) (2020), 949 – 962 https://assjm.journals.ekb.eg Application of Food Safety Management System (ISO 22000) In Processing of Wheat Flour Product El-Rouby, M. Z.; Bahlol, H. E.; El-Desouky, A. I.; Sharoba, A. M. and Darweesh*, A.H. Food Tech. Dept., Fac. of Agric., Moshtohor, Benha Univ., Egypt. * North Cairo Flour Mills and bakeries company, Cairo, Egypt. Corresponding author: morouby@gmail.com Abstract In this study, ISO 22000 food safety management system was applied and revised to produce wheat flour 72% extracted. This experiment was carried out in North Cairo Flour Mills and Bakeries Company, Al Kawther Flour Mill, El Salam City, Cairo, Egypt, all stages were followed up from receiving wheat to flour production and storage. A food safety team was created and that the infrastructure is suitable for the production process. A wheat flour product was described and a flow chart was constructed of the milling process. The hazard was analyzed and identification, cleaning stage and packing stage are critical control points (CCPs) while stage of receiving materials and stage of storing the product have been determined as operational prerequisite programs (OPRPs) and the effectiveness of implementing the HACCP plan is verified. The microbiological analysis of swabs from workers and surfaces was within the allowable limits and the microbiological analysis of wheat and flour was less than thirty (cfu/g). The chemical composition of wheat, the highest moisture content was during the conditions stage, regarding the chemical composition for wheat flour, results were similar in average values of readings in all stages. Heavy metal concentration of packaging material to use in packing wheat flour was within the allowable limits, Aflatoxins contents of wheat and flours were not detected in all stages, pesticide residues in flour was within the allowable limits. Key words: ISO 22000, Food safety, HACCP, Wheat, Wheat flour. Introduction The country remains the world’s largest wheat importer. Wheat imports for the current 2019/20 marketing year (July/June) are estimated at 12.5 million tonnes, about the same as the previous year and about 15 percent above the average of the last five years. In the 2020/21 marketing year, wheat import requirements are expected to remain at the same level. The three largest suppliers in the 2019/20 marketing year (up to March 2020) were the Russian Federation (5.6 million tonnes), Ukraine (3.7 million tonnes) and Romania (1 million tonnes). Cereals are grown on irrigated fields, yielding relatively stable harvests. About 3.4 million feddans (equivalent to 1.38 million hectares) were planted with wheat in the 2019/20 cropping year, slightly more than 3.27 million feddans (1.37 million hectares) planted in the previous year. The Ministry of Agriculture forecasts the 2020 wheat production to be at least 9 million tonnes, similar to last year and five-year average (FAO, 2020). There are many grain mills nationwide, so there was a need within the milling industry to control food safety, especially due to customer requirements and government regulations. The best way to ensure food safety is to implement ISO 22000 as a tool for the food safety management system. Wheat is one of the most important cereal crops and the staple food for most people around the world. That is reason Egypt is making strategic reserves sufficient to meet the country's needs for a period of six months and limit the change in local and international prices for wheat. Food safety represents a fundamental public health concern for every actor involved along the food supply chain. The need for a consistent approach to food safety management along the whole food supply chain, from the farm to the table, is vital. A wide number of food borne hazards pose risks and threats to health and raise barriers to global trade in foods (Soman and Raman, 2016). An efficient food safety management system helps the company to protect its competitive market place, customers and the community, guaranteeing continuous prevention of food borne illnesses, and the promotion of safe to eat foods. Also, to gain more customers’ confidence and increase market reputation, more organizations are choosing to have their food safety management systems certified based on an internationally recognized standard and practices. As such, the international standard ISO 22000:2005 Food safety management systems-Requirements for any organization in the food chain was created to help organizations identify and control food safety hazards by developing and adopting a food safety management system (Păunescu et al., 2018). Al-Busaidi et al. (2017) pointed out that the implementation of prerequisite programs (PRPs) among food products was insufficient, mainly because of a lack of training for food handlers. Relatedly, such companies demonstrated insufficient understanding of the relevant safety concepts, exhibiting an over-reliance on the use of critical
- 2. 950 El-Rouby, M. Z. et al . Annals of Agric. Sci., Moshtohor, Vol. 58 (4) 2020 control points (CCPs) to control hazards in situations in which a PRP would be more appropriate. ISO 22000 was based on the integration of the ISO 9001 and the HACCP approach. In addition to the proper implementation of food hygiene principles in the food chain, it was necessary to combine hazard analysis and critical control point systems to assess and identify any risks that may pose a hazard within the food chain. The ISO published ISO 22000:2018 on June 19, 2018. The purpose of this revision was twofold. The first was to ensure that the ISO 22000 standards would meet new food safety challenges. The second was to make sure that they were consistent with other ISO standards for the purposes of integration. Finally, of course, it was expected that the revised ISO22000 would achieve GFSI accreditation as the reference standard for food enterprises (Stefan et al., 2018). Wheat milling can result in a significant change in the nutritional value of the ultimate wheat products. The nutrients concentrated in the bran layers and germ will be removed during the milling (Rosell and Garzon, 2015). The aim of this investigation was to monitor and apply (ISO 22000, 2018) in the process of wheat milling at Al Kawther Flour Mill. Materials and Methods 1. Materials: 1.1. Wheat: Russian wheat was taken from North Cairo Flour Mills and bakeries company, Al Kawther Flour Mill, El Salam City, Cairo, Egypt. 1.2. Wheat Flour 72% extraction: Wheat flour samples from Russian wheat (72% extraction), were taken from Al Kawther Flour Mill, El Salam City, Cairo, Egypt. 2. Methods: 2.1. Sampling: Wheat and flour was sampled at five different stages in the milling process. The first sample was taken from the Wheat’s reception, while the second sample was taken after storage in silos for a month, the third sample after cleaning, fourth sample after conditions and the fifth sample was the final product, and sampled from final product after stored for three months at room temperature. All sampling technique was conducted in accordance with (Egyptian standard 7109, 2012). 2.2. Hygienic samples (Surface and hand swabs): Sampling of swabs from working surfaces and hands of workers in the milling processing line were conducted in accordance with (ISO 18593, 2018). 2.3. Implementation of food safety management system (FSMS): Applications of food safety management system (FSMS) were conducted in accordance with (ISO 22000, 2018). 2.4. Prerequisite programs (PRP) definition: Basic conditions and activities that are necessary within the organization and throughout the food chain to maintain food safety which is suitable for production, handling, and provision of safe end products and safe food for human consumption. The prerequisite programs (PRPs) representing the conditions and/or the necessary basic activities to develop a generic FSMS model during wheat flour milling was evaluated according to (ISO/TS 22002- 1, 2009). Flow chart of wheat milling processing line was constructed in order to provide a clear, simple description of the steps involved in the process. It is a more detailed process the flow chart is included in Fig (1). 2.5. Hazard Assessment tools: Hazard assessment as a tool to identify the hazard and its control measure was conducted risk management and communication. Decision tree a series of questions that are applied to each step in the process in respect of an identified hazard to identify which steps are CCPs or OPRPs according to (FSSC 22000, 2019). 2.6. Physical characters: 2.6.1. Cleanliness and insects infected grain will done at three different stages: Cleanliness were determined according to (Hamza, 2003 and Egyptian standard 1601-1, 2010). Insects infected grain should be separated from the forceps were determined according to (Egyptian standard 1601-1, 2010). 2.6.2. Hectoliter (Kg/hl) and Thousand Kernel weight: Hectoliter weight and thousand kernel weight of wheat were determined using stander procedures according to (AACC, 2012). 2.6.3. Color determination of wheat and wheat flour (72% extraction): Chroma Meter CR-410 (Konica Minolta, sensing Inc., Japan) was used to measure the color parameters like brightness value L* (black (0) to white (100)), redness value a* (green (−) to red (+)) and yellowness value b* (blue (−) to yellow (+)) on the wheat and wheat flour according to the method described in (AACC, 2012).
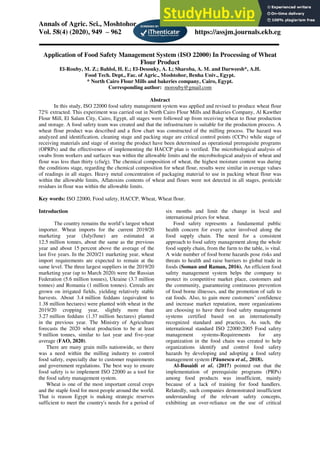
- 3. Application of Food Safety Management System (ISO 22000) In Processing of Wheat Flour Product… 951 Annals of Agric. Sci., Moshtohor, Vol. 58 (4) 2020 Fig. (1): Flow Chart of wheat milling process. 2.6.4. Physicochemical characters: 2.6.4.1. Wet, dry and index gluten: Wet, dry gluten and gluten index contents of both wheat flours (72% extraction) were determined using glutomatic apparatus according to the method described in (AACC, 2012). 2.6.4.2. Falling number (FN): Falling No. values of wheat flours under study were determined according to the method described in (AACC, 2012). 2.7. Chemical analysis: Moisture, protein, fat and ash content were determined according to the methods of (AOAC, Receiving materials stage Raw Material (Wheat) Packaging Material Cleaning Stage Suppliers No 36 silos with a capacity of 285 tons per silo Processing silos Waste Silos Silos Rework OPRP1 Yes Insp Packaging Warehouse Discharging the wheat in intake hopper Storage of wheat in silos Grinding silo Milling& Sieving Stage Wheat flour silo Packaging Stage Storage Stage Rejecte Magnetic, grain separator, Aeration, de-stoner, triuer, wheat scourer 4 water tanks a capacity 5M per tank, moisture 15.5 %, time from 12 to 24 hours, 10 silos a capacity of one 100 tons, scourer, Aeration 1 silo with a capacity of 5 tons per line Cylinders mill, break, smoothing, sizing, sizing system, grading system 8 silos with a capacity of 100 tons Metal detectors, sizing control, digital balance FIFO, GMP OPRP2 CCP2 CCP1 Insp No Yes Insp No Yes Rework Insp No Yes Conditions Stage 6 silos with a capacity of 285 tons per silo, scourer Magnetic, grain separator, Aeration
- 4. 952 El-Rouby, M. Z. et al . Annals of Agric. Sci., Moshtohor, Vol. 58 (4) 2020 2016). Total carbohydrates were calculated by differences. 2.7.1. Detection of Aflatoxin: High pressure liquid chromatography was used to determine total aflatoxin (G1, G2; B1, B2) according to (AOAC, 2016). 2.7.2. Pesticide residual analysis of wheat flour (72% extraction): Quick and esay method (QuEchers) for determination of pesticide residues in foods. Using LC-MSMS, GC-MSMS according to (EN 15662, 2018). 2.7.3. Heavy metals: As, Pb, Sb, Cd and Zn were determined using the atomic absorption spectrophotometer (VARIAN, model AA240 FS, Australia) as described in (AOAC, 2016). 2.8. Microbiological analysis: 2.8.1. Swab testing techniques: Test was performed in accordance with (ISO 18593, 2018). The swabs have been individually wrapped and sterilized. 2.8.2. Aerobic formers count: The aerobic formers count for wheat and wheat flour were enumerated according to (FDA, 2002). 2.8.3. Bacillus cereus count: Bacillus cereus count were enumeration for wheat and flour according to (Rahimi et al., 2013). 2.9. Statistical analysis: The statistical analysis was carried out using ANOVA with one factor under significance level of 0.05 for the whole results using SPSS (ver. 20). Data were treated as a complete randomization design according to (Steel et al., 1997). Multiple comparisons were carried out applying LSD. Results and Discussion The food safety team: The food safety team and the food safety team leader has been appointed by top management. A multidisciplinary team was created in the company to implement the (ISO 22000, 2018) standard. The team was committed to the study, development, establishment and review of all problems concerning the safety and management of wheat flour 72% extraction product. Indeed, the members are well- acquainted with the finished products, the used raw materials, supply specificities, production methods and all related problems. Accordingly, the following steps are followed to implementation ISO 22000: Firstly: Create prerequisite programs PRPs: Established the prerequisite programs in the wheat milling processing line before application of FSMS, were determined using specific criteria according to (ISO/TS 22002-1, 2009). All prerequisite programs were discussed after the conformity and non-conformity were identified with management to provide the required resources. The food safety team implemented and followed up all the observations. The result was indicated that there were more notes, such as: 1. Mill's infrastructure was suitable for production food. 2. The location of the equipments allows access for operation, cleaning and maintenance. 3. An adequate number of toilets and appropriate facilities for washing and drying were provided. 4. A laboratory already found to determine physical and chemical properties. 5. The material received which impact food safety is already conformance to the specified. 6. The suitable space between materials and walls to allow for inspection and pest control activities in the storage. 7. Containers for waste be clearly identified, located in a designated area, cleaned, closed when not in immediate use. 8. Cross-contamination between the raw materials are actually separated from the finished products. 9. The food safety team has been trained on the requirements of ISO 22000. Secondly: Describe the product and its intended use: Flour is considered a dry food product and its moisture content ranges between 12% to 14% and is packed in polypropylene packages weighing 50 & 20 kg and stored in a place with good ventilation and a temperature suitable for dry storage, the shelf life is 9 months from the date of production, The purpose of use as a primary product in all food industries represented (pasta, bakery products, desserts) shown in Table (1), according to (Gaaloul et al., 2011 and El-Bayoumi et al., 2013).
- 5. Application of Food Safety Management System (ISO 22000) In Processing of Wheat Flour Product… 953 Annals of Agric. Sci., Moshtohor, Vol. 58 (4) 2020 Table 1.Wheat flour description and its intended use. Product name Wheat flour extract 72% Product characteristics Wheat flour is the product prepared from grain of wheat by grinding or milling processes in which the bran and germ are partly removed and the remainder is comminuted to a suitable degree of fineness. Grinding by cylinder mills. Intended use As a primary producer in all food industries e.g. (Pasta, bakery products, desserts) Packaging requirement Handle in woven plastic bags made of polypropylene Packaging Packages 20& 50 Kg Distribution By company vehicles or customer vehicles Shelf life (9 Months) Where the product will be sold Supermarkets Storage conditions No physical damage, excess humidity or temperature extremes Labeling instructions Required to ensure product safety, e.g. date of product, net weight, flour type, trade mark, Shift. Thirdly: Conduct a hazard analysis and identification: The hazards were analyzed for all stages of processes, according to which critical limits and checkpoints criteria were identified for the different stages shown in Table (2) according to (Gaaloul et al., 2011 and El-Bayoumi et al., 2013). Wheat’s reception stage its checkpoints are as follows, total impurities should not exceed 5% from the sample, Also heavy metals should be < 1 ppm and insects should be absent from the sample. Storage in silos stage its checkpoints, total impurities should not exceed 5% from the sample, Also heavy metals should be < 1 ppm and insects should be absent from the sample. Cleaning stage its critical limits are as follows, inorganic materials should not exceed 0.5% from the sample. Insects should be absent. Conditions stage the check point’s moisture of wheat should not exceed 15.5% from the sample, insects should be absent. Milling and sieving stage the checkpoints were absence from impurities, Also heavy metals should be < 1 ppm. Packaging stage the critical limits were given as follows, Packaging material should free from insects and impurities. Heavy metals of packing material for printing ink from the sample that represents for lead (Pb) should be <0.5 ppm. Storage stage the product this as the endpoint of monitoring the checkpoints include the total aflatoxins concentration form represented sample should be lower than 0.5Mg/Kg. Besides, the sample should be absent from any insects and impurities. Fourthly: Control of critical control points and operational prerequisite programs (CCPs& OPRPs): The food safety team established critical limits or monitoring systems for each critical control point and operational prerequisite programs to demonstrate that the CCPs and OPRPs are under control and recorded as seen in Table (3) and (4) according to (Gaaloul et al., 2011 and El-Bayoumi et al., 2013). Cleaning stage the CCP1 it is the impurities especially the stone not more than 0.5%, and ash does not exceed 0.56%, and a record has been made to follow up on the de-stoner every shift by the quality responsible. Packing stage the CCP2 it is to ensure that there is no residue on the 60-micron sieve and a record was made to follow up on that point every shift by the quality responsible. Receiving material stage needs monitoring program because heavy metals, aflatoxin and foreign materials found in these wheat grains are also, potential risks for consuming health. Wheat grains should be purchased as closely as possible to the product specifications. Otherwise, other ingredients like packaging material; disinfection and sanitizers should be supplemented with its material safety data sheets (MSDS). These operations need operational pre-requisite program and are registered as OPRP1. Storage of product stage it was found during study, that those steps need operational prerequisite program and is considered as OPRP2. It is to be committed to storage in dry and ventilated warehouses free of insects and rodents, this is followed up periodically by the quality responsible.
- 6. 954 El-Rouby, M. Z. et al . Annals of Agric. Sci., Moshtohor, Vol. 58 (4) 2020 Table 2. Hazard identification for wheat flour milling. Processing steps Hazard type Hazards Control measures Critical limits or Check point Monitoring frequency Wheat reception P Total impurities Lab inspection <5% Per lot C Total aflatoxin, Heavy metals Lab test 0.5Mg/Kg <1 ppm B Insects, Spore forming bacteria Lab inspection Lab test Absent Absent Storage in silos P Total impurities Lab inspection <5% Monthly C Total aflatoxin, Heavy Metals Lab test 0.5Mg/Kg <1 ppm B Insects, Spore forming bacteria Lab inspection Lab test Absent Absent Cleaning P Inorganic materials Lab inspection <0.5% Daily check C - - - B Insects Lab inspection Absent Conditions P Moisture of wheat Lab test <15.5% Daily check C - - - B Insect Lab inspection Absent Milling& Sieving P Impurities Lab inspection Absent Daily check C Total aflatoxin Heavy Metals Pesticide residues Lab test 0.5Mg/Kg <1 ppm <LOQ B Spore forming bacteria Lab test Absent Packaging P Impurities Lab inspection Absent Daily check C Heavy metals of packing material (Pb) Lab test <0.5 ppm B Insects Lab inspection Absent Storage the product P Impurities Lab inspection Absent Monthly C Heavy metals Total aflatoxin Lab test <1 ppm 0.5Mg/Kg B Insects Spore forming bacteria Lab inspection Lab test Absent Absent P: physical, C: chemical and B: biological hazards Table 3. Hazard control plan of CCP for the process of wheat milling. CCP Hazards Critical limits Devices used for monitoring Verification Records& responsibilities CCP1 Cleaning Physical hazards (Stones, Impurities, hull separation and exotic metals) Ash <0.56%& Inorganic materials < 5.0 % De-stoner, Sifter, metal detector during cleaning Testing HACCP plan review Record of follow up ccp1 (Quality responsible) CCP2 Packing Physical (Metallic pieces, Impurities) Nothing impurities on a sieve of 60 microns Control sieve, Metal detector before packing. Testing HACCP plan review Record of follow up ccp2 (Quality responsible)
- 7. Application of Food Safety Management System (ISO 22000) In Processing of Wheat Flour Product… 955 Annals of Agric. Sci., Moshtohor, Vol. 58 (4) 2020 Table 4. Hazard control plan of OPRP for the process of wheat milling. OPRP Hazards Checkpoint Verification Records& responsibilities OPRP1 receiving material Wheat grains: Chemical (Heavy metals, Total aflatoxin) Physical (Foreign materials) Packaging material: Chemical (Heavy metals from printing ink) Monitoring program for receiving. Monitoring program review MSDS review Record of examination and receipt (Quality responsible) OPRP2 Storage of product Physical: Foreign material Chemical: Heavy metals, Total aflatoxin Biology: Insect Monitoring program for storage Monitoring program review Record of follow up the product (Quality responsible) Fifthly: Establish a corrective action plan: The need for corrective actions is evaluated when critical limits at CCPs and/or action criteria for OPRPs are not met. The mill establishes and maintains documented information that specifies appropriate actions to identify and eliminate the cause of detected nonconformities, to prevent a recurrence, and to return the process to control after a nonconformity is identified according to (Varzakas, 2016). Sixthly: Verification of effectively implementing the HACCP plan and operational prerequisite programs: The food safety team has created a PRPs verification plan and a risk control plan to ensure that all food safety management system operations are effectively implemented and updated. The verification plan should include checking the steps of the HACCP, the calibration of devices, the results of the tests, the state of the sieves and the efficiency of the magnet. Therefore, an internal audit is conducted on the system as a whole in an impartial, independent manner and sequential according to the internal audit plan by the food safety team to verify the effectiveness of the system. Seventhly: Documented information: Creating and updating documented information of the food safety management system for all operations. These records kept for at least a year after the shelf life of the product. Eighthly: The tests that were taken to ensure the safety of the operations: The required measurements were determined from the beginning of the receiving materials through all stages until the final product is delivered to the customer by the following: 1. Physical characters: 1.1. Hectoliter, Thousand kernel, Cleanliness and Insect infected grains: Physical characters of wheat grains were hectoliter (Kg/hectoliter), thousand kernel weight (gm), cleanliness (%) and insects infected grains (Count) were determined are presented in Table (5). Mean values of physical characters of Russian wheat kernels in three stages firstly when received fresh wheat, secondly after storage wheat grain in silos for a month and thirdly after cleaning. The values were as follows specific weight record was 77.90, 79.17, 78.70 kg/ hectoliter, respectively. The results are in agreement with (Silveira et al., 2020). Thousand kernel weight tablets were 37.57, 38.00, and 36.37 gm, respectively. The results are in agreement with (Marconi et al., 2002). The results showed that there were significant difference between the different readings in the different stages of both the specific weight and cleanliness. The percentage of cleanliness after the cleaning process recorded its highest value which was 99.34% while the lowest value for raw wheat was 96.55%. These data are similar with those reported by (Stoenescu et al., 2010; Abd El Fadel et al., 2011 and El-sisy et al., 2014) found that the cleanliness of wheat ranged from 93.8 to 99.6 %. The number of insects infected grains (32 seed/100gm) at all stages turned out to be no infection at all. The results are in agreement with (Safdar et al., 2009; Abd El Fadel et al., 2011 and El-sisy et al., 2014). Table 5. Physical characters of wheat grains (mean±SE). Parameter Specific weight Hectoliter (kg/hectoliter) Thousand kernel weight (gm) Cleanliness (%) Insects infected grains (Count) Fresh wheat 77.90±0.26b 37.57±1.48a 96.55±0.26c Absent After storage one month 79.17±0.09a 38.00±1.36a 97.35±0.06b Absent After cleaning 78.70±0.31ab 36.37±0.81a 99.34±0.09a Absent LSD 0.05 0.83 4.33 0.57 a, b & c: There is no significant difference (P>0.05) between any two means, within the same column have the same superscript letter.
- 8. 956 El-Rouby, M. Z. et al . Annals of Agric. Sci., Moshtohor, Vol. 58 (4) 2020 1.2. Color of wheat and wheat flour (72% extraction): Color parameters of Russian wheat and wheat flour (72% extraction) in four stages firstly when received fresh wheat, secondly after storage wheat grain in silos for a month, thirdly wheat flour 72% extraction and fourthly wheat flour after stored for three months at room temperature were presented in Table (6). The results showed that wheat flour recorded the highest value of L-value where it was 93.75 and this result indicates the intensity of whiteness and the values of a-value ranged from - 1.18 to -1.14 which indicates the green color and wheat flour recorded the highest value of b-value where it was 11.15 Which indicates the color yellow. The obtained results are agreement with the findings of (Kamil et al., 2011) reported that L, a and b values in hard wheat flour were 92.11, 0.59 and 11.17, respectively. Moreover, (Kibar, 2019) found that L, a and b values in wheat seeds were L 61.23- 70.44, a 5.49-7.00, b 19.40-22.55, respectively. Farbo et al. (2020) studied that L, a and b values in semolina were L 66.75 and 64.52, a -2.15 and -1.21, b 19.99 and 18.64%, respectively. Table 6. Color parameters of wheat and wheat flour (72% extraction). Components Samples (L- value)* (a- value)* (b- value)* Fresh wheat 79.98 -0.26 10.02 After storage one month 84.04 -0.54 10.25 Wheat flour 93.75 -1.18 11.15 After storage wheat flour 92.29 -1.14 10.89 L* Value Whiteness 100 White / 0 Black a* Value Positive Values (+) Red Color / Negative Values (–) Green Color b* Value Positive Values (+) Yellow Color / Negative Values (–) Blue Color 2. Physiochemical properties: The Gluten and Falling number of wheat flour 72% extraction are shown in Table (7). Wet and dry gluten recorded the highest value in wheat flour which was the third stage and it was 24.1 and 7.9 respectively, while the lowest value for wheat after storage was in silo it was 22.9 and 7.0, respectively. On the other hand, the highest value of gluten index was recorded for flour after storing for a period of three months it was 98.2. These data are agreement with those indicated by (Ali, 2012; Salehifar et al., 2012; Bueno et al., 2016; Liu et al., 2017 and El-sisy et al., 2019). On the other hand, the falling number the highest value of raw wheat and wheat flour was 449 and 406 seconds, respectively. These results are near agreement with those reported by (Bueno et al., 2016; Liu et al., 2017 and El-sisy et al., 2019). Table 7. Physiochemical properties of wheat grains and wheat flour (72%ext.). Components Wet gluten content (%) Dry gluten content (%) Gluten Index (%) Falling. No (Sec) Fresh wheat 23.5 7.2 82.8 449 After storage one month 22.9 7.0 89.3 375 Wheat flour 24.1 7.9 96 406 After storage wheat flour three months 23.4 7.8 98.2 390 3. Chemical composition of wheat and wheat flour: 3.1. Chemical composition of wheat: The results in Table (8) were as follows to moisture content of fresh wheat, after storage wheat in silos, after cleaning and after condition were 11.93, 11.00, 10.80 and 15.50, respectively. The highest moisture content 15.50% followed by 11.93% for after condition and fresh wheat, respectively. The lowest moisture content was 10.80 % for after cleaning. There have been significant differences (p>0.05) in mean moisture content values at all stages for all samples. These data are similar with those reported by (Keran et al., 2009; Narisawa et al., 2019 and Li et al., 2020) mentioned that the moisture of wheat samples were ranged from 11.19-14.5%. The highest value of protein content was 12.78 for fresh wheat. There were no significant differences (p < 0.05) in the mean values of protein content at all stages for all samples. These data are agreement with those indicated by (Anjum and walker, 2000; Rachon and Szumilo, 2009; Narisawa et al., 2019; Li et al., 2020 and Silveira et al., 2020) found that protein contents in wheat were ranged from 8.5 to 14.83%. The fat content were 3.02, 2.17, 2.16 and 2.18, respectively. The highest fat content 3.02% followed by 2.18% for fresh wheat and after condition, respectively. The obtained data are in line with those obtained by (Narisawa et al., 2019 and Silveira et al., 2020) mentioned that the fat content of wheat were ranged from 1.4-4.8%. The ash content in wheat and flour has significance for milling, the ash content in flour is an indication of the yield that can be expected during milling. Ash
- 9. Application of Food Safety Management System (ISO 22000) In Processing of Wheat Flour Product… 957 Annals of Agric. Sci., Moshtohor, Vol. 58 (4) 2020 content also indicates milling performance by indirectly revealing the amount of bran in flour. Ash contents which indicate of mineral contents were 1.57, 1.64, 1.62 and 1.66, respectively. The highest value of ash content was 1.66 for after condition. There have been significant differences (p>0.05) in mean ash content values at all stages for all samples. These data are agreement with those indicated by (Narisawa et al., 2019; Silveira et al., 2020) mentioned that the ash content of wheat were ranged from 0.35-1.96%. The total carbohydrate content were 70.70, 72.56, 72.73 and 67.90, respectively. The highest total carbohydrate content 72.73% followed by 72.56% for after cleaning and after storage, respectively. The lowest total carbohydrate content was 67.90 % for after condition. There have been significant differences (p>0.05) in mean total carbohydrate content values at all stages for all samples. Similar findings were also obtained by (El- sisy et al., 2014 and El-sisy et al., 2019) reported that carbohydrate content for wheat were ranged from 71.07 to 74.41%. Table 8. Chemical composition of wheat (mean±SE) (g/100g on wet weight basis). Components % Samples Moisture Protein Fat Ash Total carbohydrate Fresh wheat b 11.93±0.03 a 12.78±0.08 a 3.02±0.00 c 1.57±0.02 b 70.70±0.12 After storage one month c 11.00±0.06 a 12.63±0.17 b 2.17±0.06 ab 1.64±0.00 a 72.56±0.19 After cleaning d 10.80±0.06 a 12.72±0.07 b 2.16±0.03 b 1.62±0.01 a 72.73±0.13 After conditioning a 15.50±0.06 a 12.76±0.03 b 2.18±0.03 a 1.66±0.01 c 67.90±0.05 LSD 0.05 0.00 0.74 0.00 0.00 0.00 a, b & c: There is no significant difference (P>0.05) between any two means, within the same column have the same superscript letter. 3.2. Chemical composition of wheat flour: The results in Table (9) were as follows to moisture content of wheat flour 72% extraction and wheat flour after stored were 14.40 and 13.97%, respectively. The highest moisture content 14.40% for wheat flour 72% extraction, while the lowest was 13.97% for wheat flour after stored. These data are similar with those reported by (Ramirez-Wong et al., 2007; Gomes-Ruffi et al., 2012; Salehifar et al., 2012 and Gomes et al., 2013) studied the moister content of wheat flours were ranged from 10.7 to 14.30%. The protein content were 11.38 and 11.30%, respectively. The highest value of protein content was 11.38 for wheat flour, while the lowest was 11.30 for wheat flour after stored. These data are agreement with those indicated by (Ragaee et al., 2006; Mepba et al., 2007; Ibrahim, 2011; Salehifar et al., 2012 and Bosmans et al., 2013) reported that protein content of wheat flour were ranged from 11.0 to 12.86% protein. The fat content were 1.46 and 1.43%, respectively. The highest fat content 1.46% for wheat flour. The lowest fat content was 1.43 % for wheat flour after stored. The obtained data are in line with those obtained by (Mepba et al., 2007; Dewettinck et al., 2008; Gomes-Ruffi et al., 2012; Salehifar et al., 2012 and Al-Sahlany and Al- Musafer, 2020) reported that fat content for wheat flour were ranged from 1.1 to 2.7%. The ash content in flour has significance for milling, the ash content in flour is an indication of the yield that can be expected during milling. Ash content also indicates milling performance by indirectly revealing the amount of bran in flour. Ash in flour can affect color, imparting a darker color to finished products. Some specialty products requiring particularly white flour call for low ash content while other products, such as whole wheat flour, have high ash content. Ash contents which indicate of mineral contents were 0.46 and 0.48, respectively. The highest value of ash content was 0.48 for after stored, while the lowest was 0.46 for wheat flour 72% extraction. These data are agreement with those indicated by (Mepba et al., 2007; Salehifar et al., 2012; Bueno et al., 2016 and Cappelli et al., 2020) reported that ash content for wheat flour were ranged from 0.40 to 0.82%. The total carbohydrate content were 72.29 and 72.82%, respectively. The highest total carbohydrate content 72.82% for wheat flour after stored. The lowest total carbohydrate content was 72.29% for wheat flour. Similar findings were also obtained by (Mepba et al., 2007; Dewettinck et al., 2008 and Al-Sahlany and Al-Musafer, 2020) reported that carbohydrate content for wheat flour were ranged from 69.9 to 84.0%. Table 9. Chemical composition of wheat flour (72% ext.) (mean±SE) (g/100g on wet weight basis). Components % Samples Moisture Protein Fat Ash Total carbohydrate Wheat flour 14.40±0.00 11.38±0.03 1.46±0.08 0.46±0.01 72.29±0.09 After storage wheat flour three months 13.97±0.33 11.30±0.03 1.43±0.04 0.48±0.00 72.82±0.03 LSD 0.05 0.00 0.17 0.70 0.25 0.00
- 10. 958 El-Rouby, M. Z. et al . Annals of Agric. Sci., Moshtohor, Vol. 58 (4) 2020 4. Heavy metal concentration of packaging material to use in packing wheat flour: Heavy metal contents of packaging material to use in packing wheat flour were presented in Table (10). The obtained data revealed that the heavy metal contents of packaging material were 0.05, 0.04, 0.03, 0.004 and 0.002 ppm for Arsines, lead, Antimony, cadmium and zinc, respectively. The results are in agreement with the accepted limit according to (Egyptian standard 6050, 2007). Table 10. Heavy metal concentration of packaging material to use in packing wheat flour (ppm). Items Results As* 0.05 Pb* 0.04 Sb* 0.03 Cd* 0.004 Zn* 0.002 *As=Arsines, Pb= lead, Sb=Antimony, Cd=cadmium, Zn=zinc 5. Aflatoxins contents of wheat grains and wheat flours: Results of aflatoxins contents (B2, B1, G2 and G1) of Russian wheat kernels and wheat flour (72% extraction) were shown not detected in four stages its indicating that very good storage condition. These results are near an agreement with those reported by (Trombete et al., 2014). 6. Pesticide residual analysis of wheat flour (72% extraction): The results of pesticide residues were shown in Table (11) that study for the produced Russian wheat flour and found as follows Malathion 0.03 mg/Kg, Piperonyl butoxide 0.01 mg/Kg, Chlorpyrifos <LOQ. This results are in consistence with (Rezaei et al., 2017) Table 11. Pesticide residues of wheat flour. Items Results Malathion 0.03 Piperonyl butoxide 0.01 Chlorpyrifos < LOQ 7. Microbiological analysis of swabs from workers and surfaces in wheat milling processing line: Swabs from workers who are in contact with the product were conducted and the results were given in Table (12). Hand swabs from workers of processing line (packaging) were tested for enumeration of microoraganisms, enumeration of enterobacteriaceae and enumeration of coagulase- positive staphylococci. According to the result, it could be noticed that, enumeration of microoraganisms of swabs from hands of plant workers was 7.7×10² and <10 log cfu/swab, respectively during the investigation period. In the same time, enumeration of enterobacteriaceae and enumeration of coagulase-positive staphylococci were <10 log cfu/swab which that the count was not detected during the investigation period. The aforementioned parameters were chosen as microbiological criteria for the evaluation of personal hygiene as listed in many studies as (Sperber, 2007 and El-Bayoumi et al., 2013). Swabs from surfaces (25 cm2 ), machines which in contact with the product during the investigation period, were conducted and the results are described in Table (12). Surfaces swabs from machines, which are in contact with the product during the investigation period were test for enumeration of microoraganisms, enumeration of enterobacteriaceae and enumeration of coagulase- positive staphylococci. In accordance with results, it could be noticed that, enumeration of microoraganisms of swabs from surfaces of machines ranged from 1.4×10² to 4.0×10² log cfu/ swab during the investigation period. On the other side, enumeration of enterobacteriaceae and enumeration of coagulase-positive staphylococci were < 10 log cfu/ swab during the investigation period. The aforementioned parameters were chosen as microbiological criteria for the evaluation of good hygiene practices (GHP) as listed in many studies such as (Ismaïl et al., 2013 and Lahou and Uyttendaele, 2014). Table 12. Microbiological analysis of swabs from workers is in touch with the product and swabs from surfaces in wheat milling processing line. Components Samples Swabs from workers (log cfu/swab) Enumeration of microoraganisms 30o C Enumeration of Enterobacteriaceae Enumeration of Coagulase- positive Staphylococci Workers 7.7×10² < 10 < 10 < 10 < 10 < 10 Swabs from machines (log cfu/swab) Machines 2.6×10² < 10 < 10 4.0×10² < 10 < 10 2.8×10² < 10 < 10 1.4×10² < 10 < 10
- 11. Application of Food Safety Management System (ISO 22000) In Processing of Wheat Flour Product… 959 Annals of Agric. Sci., Moshtohor, Vol. 58 (4) 2020 8. Microbiological analysis of wheat and wheat flour: The results of the microbiological load (aerobic formers count and bacillus cereus count) of Russian wheat kernels and wheat flour (72% extraction) were found less than thirty (cfu/g) in all sampling in four stages. The aforementioned parameters were chosen as microbiological criteria for the evaluation of microbiological load as listed in many studies such as (Berghofer et al., 2003 and El-Bayoumi et al., 2013). Conclusion The implementation of the ISO 22000 food safety management system on the milling industry from the receiving material until the wheat flour is delivered to the customer. This was done in several stages, starting with the top management appointing the food safety team and the food safety team leader. The Prerequisite programs (PRPs) were defined according to which Outline that can never be crossed when applying a food safety management system. Describe the product and its intended use, characteristics and construct a flow chart of wheat milling process was created, verify the flow diagram actually with the mill. The physical, chemical and microbiological hazards were analyzed and identified. Accordingly, criteria are established to control of critical control points (CCPs) and operational prerequisite programs (OPRPs). In this study, the hazards points were represented in the cleaning stage CCP1, and the packing stage CCP2, the critical limits for them to follow up period were identified, while the receiving material stage OPRP1, and the storage of product stage OPRP2 were both defined monitoring systems necessary to control them. Then appropriate corrective action is taken if a deviation occurs from the agreed specific criteria. The Verification of effectively implementing the HACCP plan and operational prerequisite programs periodically. Of course, all of these processes are documented according to the documentation system that was created in the mill. In the end, we obtain safe wheat flour and high quality, meet customer requirements and has gain customer loyalty and confidence in general, Provided that the food safety management system is implemented effectively. References A.A.C.C. (2012). Approved Method of American Association of Cereal Chemists, published by American Association of Cereal Chemists, Ins. St. Paul, Minnesota, USA. A.O.A.C. (2016). Association of Official Analytical Chemists' Official methods of Analysis of AOAC. International 18thed. Published by AOAC International Maryland, USA. Abd El Fadel, M.G.; Seham, S.G.; El-Shibiny, A. A.; Emara, M.F. and El-Sisy, T.T. (2011). Effect of handling, milling process and storage on the quality of wheat and flour in Egypt: [1] Physical and chemical properties of wheat kernals and their flours. J. Food and Dairy Sci., 2(3): 133-142. Al-Busaidi, M.A.; Jukes, D.J. and Bose, S. (2017). Hazard analysis and critical control point (HACCP) in seafood processing: an analysis of its application and use in regulation in the Sultanate of Oman. J. Food Control, 73(1): 900- 915. Ali, W.M. (2012). Studies on used some emulsifiers to improvement the quality of some bakery products. M.Sc. Thesis, Fac. of Agric., Benha Univ., Egypt. Al-Sahlany, S.T.G. and Al-musafer, A.M.S. (2020). Effect of substitution percentage of banana peels flour in chemical composition, rheological characteristics of wheat flour and the viability of yeast during dough time. J. Saudi Society of Agricultural Sciences, 19: 87-91. Anjum, F.M. and Walker, C.E. (2000). Grain, flour and bread making properties of eight Pakistani hard white spring wheat cultivars grown at three different locations for two years. J. Food Science and Technology, 35: 407-416. Berghofer, L.K.; Hocking, A.D.; Miskell, D. and Jansson, E. (2003). Microbiology of wheat and flour milling in Australia. J. Food Microbiol, 85: 137-149. Bosmans, G.M.; Lagrain, B.; Ooms, N.; Fierens, E. and Delcour, J.A. (2013). Biopolymer interactions, water dynamics, and bread crumb firming. J. Agricultural and food chemistry, 61(19): 4646-4654. Bueno, M.M.; Thys, R.C.S. and Rodrigues, R.C. (2016). Microbial enzymes as substitutes of chemical additives in baking wheat flour-part II: combined effects of nine enzymes on dough rheology. J. Food and Bioprocess Technology, 9(9): 1598-1611. Cappelli, A.; Oliva, N.; Bonaccorsi, G.; Lorini, C. and Cini, E. (2020). Assessment of the rheological properties and bread characteristics obtained by innovative protein sources (Cicer arietinum, Acheta domesticus, Tenebrio molitor): Novel food or potential improvers for wheat flour?. J. Food Science and Technology. Article in press. Dewettinck, K.; Van Bockstaele, F.; Kuhne, B.; Van-de-Walle, D.; Courtens, T.M. and Gellynck, X. (2008). Nutritional value of bread Influence of processing, food interaction and consumer perception. J. Cereal Sci, 48: 243-257. Egyptian standard 1601-1- (2010). E.S, Simple wheat grain specifications. Egyptian standard 6050 (2007). E.S, General requirements for packages and wrapping used in food products.
- 12. 960 El-Rouby, M. Z. et al . Annals of Agric. Sci., Moshtohor, Vol. 58 (4) 2020 Egyptian standard 7109 (2012). E.S, Wheat flour with its extraction and method of analysis and testing, Methods of analysis and testing- sampling. El-Bayoumi, M.M.; Heikal, Y.A.; Salwa, M.A. and Abdel- Razik, M.M. (2013). Implementation of ISO 22000 as a Food Safety Management Tools in Wheat Milling Industry. J. of Dairy & Food Sciences, 8(1): 27-37. El-sisy, T.T.; Abd El Fadel, M. G.; Gad, S. S.; El- Shibiny, A. A. and Emara, M.F. (2019). Effect of Handling, Milling Process and Storage on the Quality of Wheat and Flour in Egypt: [2] Rhological Properties of Wheat Kernals and Their Flours. J. Acta Scientific Microbiology 2(10): 159-166. El-sisy, T.T.; Jehan, B. A. and Masoud, M.S. (2014). Effect of using sorghum on the quality of wheat mixtures and their flour. J. Food and Dairy Sci., 5(12): 919-942. EN 15662 (2018). European standard method, determination of pesticide residues. FAO (2020). GIEWS Country Brief Egypt. http://www.fao.org/giews/countrybrief/country.js p?code=EGY Farbo, M.G.; Fadda, C.; Marceddu, S.; Conte, P.; Caro, A.D. and Piga, A. (2020). Improving the quality of dough obtained with old durum wheat using hydrocolloids. J. Food Hydrocolloids. Article in press. FDA "Food and Drug Administration" (2002): Enumeration of bacteria. In Bacteriological Analytical Manual. Center for Food Safety and Applied Nutrition, Department of Health and Human Searches 8th ed. US FDA, Chapter 4. Food Safety System Certification, FSSC 22000 (2019). Guidance document: ISO 22000:2018. Interpretation. Gaaloul, I.; Riabi, S. and Ghorbel, R. (2011). Implementation of ISO 22000 in cereal food industry “SMID” in Tunisia. J. Food Control, 22: 59-66. Gomes, A.V.; Buchner, D.; Tadini, C.C.; Anon, M.C. and Puppo, M.C. (2013). Emulsifiers: effects on quality of fibre-enriched wheat bread. J. Food and Bioprocess Technology, 6(5): 1228- 1239. Gomes-Ruffi, C.R.; da-Cunha, R.H.; Almeida, E.L.; Chang, Y.K. and Steel, C.J. (2012). Effect of the emulsifier sodium stearoyl lactylate and of the enzyme maltogenic amylase on the quality of pan bread during storage. J. Food Science and Technology, 49(1): 96-101. Hamza, A.H. (2003). American wheat standards: The reliable assurance for quality wheat foods. Food Additive & Cereal Fortification Conf., 13- 16 Sep. 2003, Cairo, Egypt. Ibrahim, M.A.K. (2011). Chemical and biological studies on some bakery products. Ph.D. Thesis, Fac. of Agric., Benha Univ., Egypt. International Standards Organization (2009). ISO/TS 22002-1. Prerequisite programmes on food safety, Part 1: Food manufacturing. International Standards Organization (2018). ISO 18593 Microbiology of food and animal feeding stuffs, Horizontal methods for sampling techniques from surfaces using contact plates and swabs. International Standards Organization (2018). ISO 22000. Food safety management systems - Requirements for any organization in the food chain. Ismaïl, R.; Aviat, F.; Michel, V.; Bayon, I.; Gay- Perret, P.; Kutnik, M. and Fédérighi, M. (2013). Methods for Recovering Microorganisms from Solid Surfaces Used in the Food Industry: A Review of the Literature. J. Environ. Res. Public Health, 10: 6169-6183. Kamil, M.M.; Hussien, A.M.; Ragab, G.R. and Khalil, S.K. (2011). Detecting Adulteration of Durum Wheat Pasta by FT-IR Spectroscopy. J of American Science, 7(6):573-578. Keran, H.; Mirsad, S.; Amra, O.; Midhat, J.; Nihada, A. and Indira, S. (2009). The importance of determination of some physical - chemical properties of wheat and flour. J. Agriculturae Conspectus Scientificus, 74(3): 197- 200. Kibar, H. (2019). Assessing mineral composition and morpho-physiological properties of de-hulled einkorn wheat during storage at different moisture levels. J. Stored Products Research, 83: 200-208. Lahou, E. and Uyttendaele, M. (2014). Evaluation of Three Swabbing Devices for Detection of Listeria monocytogenes on Different Types of Food Contact Surfaces. J. Environ. Res. Public Health, 11: 804-814. Li, S.; Liu, Y.; Tong, L.; Yu, L.; Ding, M.; Zhang, Z.; Rehman, A.; Majzoobi, M.; Wang, Z. and Gao, X. (2020). The overexpression of high- molecular-weight glutenin subunit Bx7 improves the dough rheological properties by altering secondary and micro-structures of wheat gluten. J. Food Research International. Article in press. Liu, T.; Hou, G.G.; Cardin, M.; Marquart, L. and Dubat, A. (2017). Quality attributes of whole- wheat flour tortillas with sprouted whole-wheat flour substitution. J. Food Science and Technology, 77: 1-7. Marconi, E.; Carcea, M.; Schiavone, M. and Cubadda, R. (2002). Spelt (Triticum spelta L.) pasta quality: Combined effect of flour properties and drying conditions. J. Cereal Chem., 79(5): 634-639. Mepba, H.D.; Eboh, L. and Nwaojigwa, S.U. (2007). Chemical composition, functional and baking properties of wheat-plantain composite flour. J. Food Agric. Nutr. Development, 7(1): 1- 22.
- 13. Application of Food Safety Management System (ISO 22000) In Processing of Wheat Flour Product… 961 Annals of Agric. Sci., Moshtohor, Vol. 58 (4) 2020 Narisawa, T.; Nakajima, H.; Umino, M.; Kojima, T.; Yamashita, H.; Otobe, C.K.; Yamada, M. and Asakura, T. (2019). Cultivar differences in lipoxygenase activity affect volatile compound formation in dough from wheat mill stream flour. J. Cereal Science, 87: 231-238. Păunescu, C.; Argatu, R. and Lungu, M. (2018). Implementation of ISO 22000 in Romanian Companies: Motivations, Difficulties and Key Benefits. J. Amfiteatru Economic, 20(47): 30-45. Rachon, L. and Szumilo, G. (2009). Comparison of chemical composition of selected winter wheat species. J. Elementol., 14(1): 135-146. Ragaee, S.; Abdel-Aal, E.M. and Noaman, M. (2006). Antioxidant activity and nutrient composition of selected cereals for food use. J. Food Chem., 98: 32-38. Rahimi, E.; Abdos, F.; Momtaz, H.; Torki, Z. and Jalali, M. (2013): Bacillus cereus in Infant Foods: Prevalence Study and Distribution of Enterotoxigenic Virulence Factors in Isfahan Province, Iran. The Scientific World J., 18: 1-5. Ramirez-Wong, B.; Walker, C.E.; Ledesma- Osuna, A.I. and Torres, P.I. (2007). Effect of flour of flour extraction rate on white and red winter wheat flour compositions and tortilla texture. J. Cereal Chem., 84(3): 207-213. Rezaei, M.; Shariatifar, N.; Shoeibi, S., Ahmadi, M.A. and Khaniki, G.J. (2017). Simultaneous Determination of Residue from 58 Pesticides in the Wheat Flour Consumed in Tehran, Iran by GC/MS. J. of Pharmaceutical Research, 16(3): 1048-1058. Rosell, C.M. and Garzon, R. (2015). Chemical Composition of Bakery Products. Handbook of Food Chemistry, 1-28. Safdar, M.N.; Naseem, K.; Siddiqui, N.; Amjad, M.; Hameed, T. and Khalil, S. (2009). Quality Evaluation of Different Wheat Varieties for the Production of Unleavened Flat Bread (Chapatti). J. of Nutrition, 8(11): 1773-1778. Salehifar, M.; Adili, L.; Tarzi, B.G. and Bakhoda, H. (2012). Effects of lipase, phospholipase and DATEM on some quality characteristics of bugget. J. Ann. Biol. Res., 3: 5236-5241. Silveira, M.M.D.; Dittgen, C.L.; Batista, C.D.S.; Biduski, B.; Gutkoski, L.C. and Vanier, N.L. (2020). Discrimination of the quality of Brazilian wheat genotypes and their use as whole-grains in human nutrition. J. Food Chemistry. Article in press. Soman, R. and Raman, M. (2016). HACCP system – hazard analysis and assessment, based on ISO 22000:2005 methodology. Food Control, 69: 191- 195. Sperber, W.H. (2007). Role of microbiological guidelines in production and commercial use of milled cereal grains: A practical approach for the 21st century. Journal of Food Production, 70(4): 1041:1053. Steel, R.; Torrie, J. and Dickey, D. (1997): Principles and procedures of Statistics: A Biometrical Approach, 3rd ed., McGraw-Hill, New York, USA. Stefan, Z.P.; Raluca, D. and Carmen, V. (2018). Comparative study of certification schemes for food safety management systems in The European Union context. J. Amfiteatru Econ, 47(1): 9-29. Stoenescu, G.; Ionescu, V.; Vasilean, I.; Aprodu, I. and Banu, I. (2010). Technological Effects of the Wheat Cleaning Equipment of an Industrial Mill. Food Technology, 34(2): 54-58. Trombete, F.M.; Moraes, D.A.; Porto, Y.D.; Santos, T.B.; Direito, G.M.; Fraga, M.E. and Saldanha, T. (2014). Determination of Aflatoxins in Wheat and Wheat byproducts Intended for Human Consumption, Marketed in Rio de Janeiro, Brazil. J of Food and Nutrition Research, 2(10): 671-674. Varzakas, T. (2016). HACCP and ISO22000: Risk Assessment in Conjunction with Other Food Safety Tools Such as FMEA, Ishikawa Diagrams and Pareto. J. Encyclopedia of Food and Health, 295-302.
- 14. 962 El-Rouby, M. Z. et al . Annals of Agric. Sci., Moshtohor, Vol. 58 (4) 2020 تطبيق الغذاء(ايزو سالمة ة ادار نظام 00222 تصنيع في ) منتج القمح دقيق الروبي زكريا محمد ، الدسوقى اهيم راب أحمد ،بهلول الطوخي همام ، شروبه مهدى أشرف و درويش حسن أحمد * الغذائية الصناعات قسم - بمشتهر اعة رالز كلية - بنها جامعة – مصر . ة القاهر شمال ومخابز مطاحن *شركة - ة القاهر - مصر . الغذاء سالمة ة رادا نظام اجعة روم تطبيق تم اسة رالد هذة في ايزو 22000 في إ نتاج اج راستخ القمح دقيق 27 % في بةرالتج هذة تمت . ة رالقاه شمال ومخابز مطاحن شركة - الكوثر مطحن - السالم مدينة - ة رالقاه - ,مصر وحتي القمح استالم من بداية احل رالم جميع متابعة وتم ينةزوتخ الدقيق انتاج . الغذاء سالمة يقرف تشكيل تم و تخطيطي رسم عمل وتم القمح دقيق منتج وصف وتم األنتاجية للعملية مناسبة التحتية البنية ال ومرحلة النظافة مرحلة تحديد وتم المخاطر وتقييم تحليل وتم الطحن لعملية حرجة تحكم نقاط انهما تعبئة (CCPs) استالم مرحلة تحديد وتم للتشغيل يةرتحضي امج رب انهما المنتج ينزتخ ومرحلة الخامات (OPRPs) ويتم .الهاسب خطة تطبيق فاعلية من التحقق التحليل وكان الميكروبي التحليل وكان بها ح المسمو الحدود في األسطحو العمال لمسحات الميكروبيولوجي / يةربكتي ة ر(مستعم ثالثين من اقل الدقيقو للقمح ولوجي .)ام رج متق النتائج كانت القمح لدقيق الكيميائي للتركيب بالنسبة ,التكييف مرحلة في رطوبة نسبة اعلي كانت للقمح الكيميائي للتركيب بالنسبة بةرا ل الثقيلة العناصر نسبة كانت .احل رالم جميع في اءات رالق قيم متوسط في المسموح الحدود في الدقيق تعبئة في المستخدمة التغليفو التعبئة ادوم الحدود في الدقيق في المبيدات متبقيات نسبة وكانت ,احل رالم جميع في اكتشافة عدم القمح ودقيق للقمح األفالتوكسين نتيجة وكانت ,بها ح المسمو بها . :الدالة الكلمات ايزو 77222 - الغذاء سالمة - الهاسب - القمح - دقيق القمح .