Download as PDF, PPTX


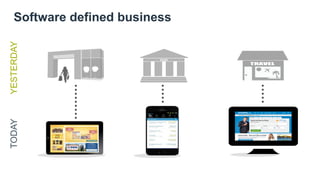
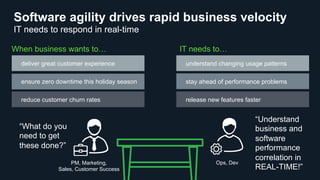
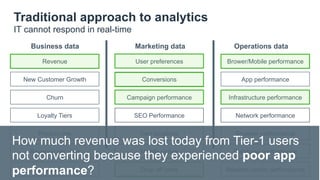
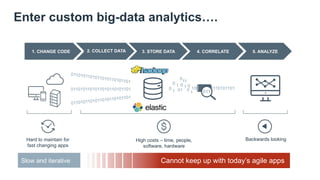
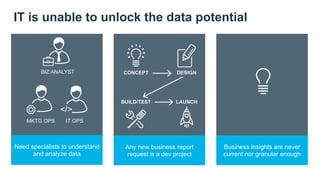
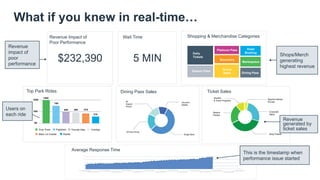
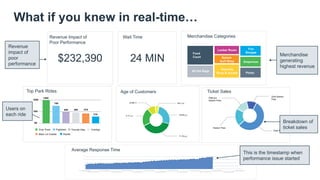


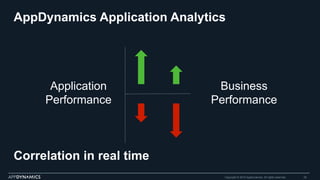

The document discusses the importance of application analytics in enabling DevOps to make data-driven decisions that enhance performance and customer experience. It highlights the transition from traditional analytics to real-time insights, focusing on business impact, user experience, and revenue risks associated with poor performance. The text emphasizes the need for advanced performance and usage analytics to facilitate rapid responses to issues and optimize business operations.