Downloaded 110 times


![Artwork proof 3
8/8/01 2:59 pm
Page 48
Example 2
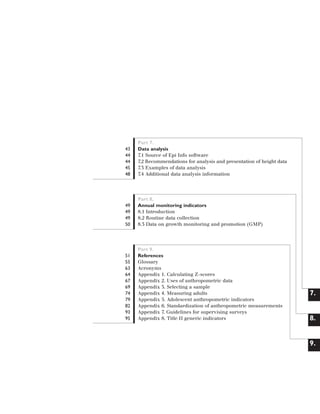
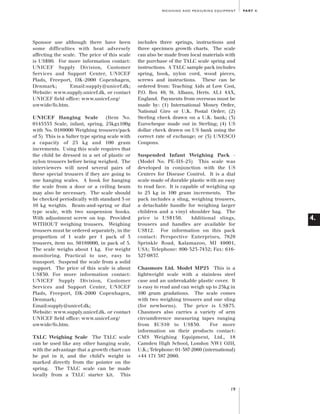
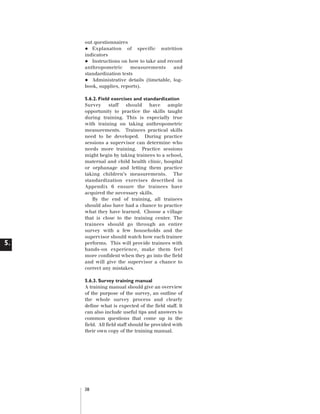
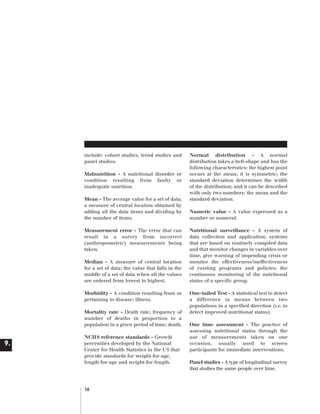
A Cooperating Sponsor conducted a baseline and final-year survey collecting height and weight data on 24-59
month old children. At both times the sample was randomly drawn from the target communities and did not include
the same children in both surveys. The pre-post design enabled a comparison of change in nutritional status (as
reflected by height-for-age) in the target communities.
Baseline at time zero:
(t0):
Mean Z-score = -2.05 (sd=1.26); Prevalence (-2SD cut-off) = 40%
Sample size = 940
Final year at time five:
(t5):
Mean Z-score = -1.20 (sd=1.15); Prevalence (-2SD cut-off) = 23%
Sample size = 1056
Using statistical software to conduct the t-test (e.g. SPSS, or STATA; note that Epi Info 2000 or Epi Info 6 does not
have this test), the testing of the significance of the change in the sample means is straightforward.
t=
(Mean t0 - Mean t5) / sq. root (Variance t0/n0 + variance t5/n5)
where n0 and n5 is sample size at baseline and final year.
t
t
t
t
=
=
=
=
(-2.05 - (-1.20)) / [sq. root ((1.26x1.26)/940)) + ((1.15x1.15)/1056))]
(-0.85) /[sq. root (0.0016889) + (0.0012523)]
(-0.85) /[ 0.054233]
15.67
This change in mean Z-scores is highly significant (i.e. well above the critical t-value of 1.96 at 0.05 level).
7.4. Additional Data Analysis Information
7.
In cooperation with Food Aid Management,
FANTA developed a workshop for the
training of program managers in the
calculation and analysis of basic
anthropometric data using Epi Info and
SPSS. The materials from the Data Analysis
Workshop are available at:
www.fantaproject.org/focus/index under
Monitoring and Evaluation.
Step by step instructions on data analysis
can be found on the Practical Analysis of
Nutritional Data (PANDA) website:
www.tulane.edu/~panda2/. PANDA was
designed for data analysis instruction using
SPSS software.
48
There are many statistical analysis software
packages available, other than Epi Info. The
packages listed below are only a few of the
commonly used statistical analysis software
programs.
These packages vary in
capability and cost.
Information on
capability and ordering the packages can be
found on their web sites.
SPSS (Statistical Package for Social
Sciences) www.spss.com
SAS
(Statistical
Analysis
System)
www.sas.com
STATA (Statistics/Data Analysis)
www.stata.com
SUDAAN (Software for the Statistical
Analysis of Correlated Data)
www.rti.org/patents/sudaan/sudaan.html](https://image.slidesharecdn.com/anthropometricmeasuringguide-131115034326-phpapp01/85/Anthropometric-measuring-guide-49-320.jpg)


![Artwork proof 3
8/8/01 2:59 pm
Page 71
REFERENCES
PA R T 9 .
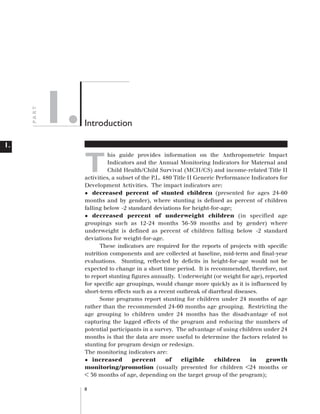
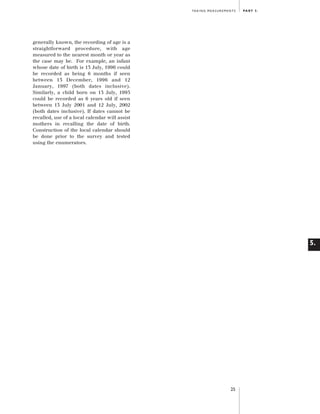
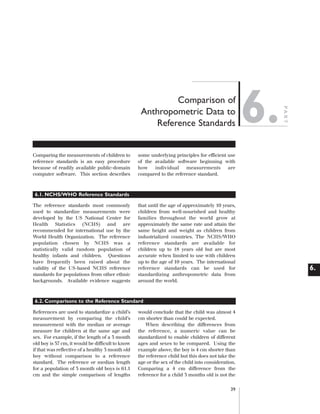
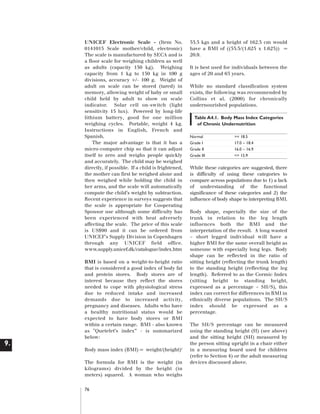
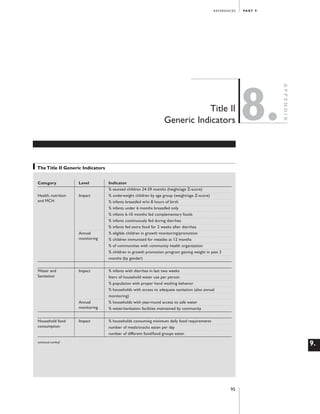
Figure A3.1. Illustrative informational needs for determining sample size, generic
Title II "health" indicators
A. Information on population composition:
1. Mean number of persons per household
2. Proportion of total population that are:
a. Children under 0-59 months of age.
b. Children under 24 months of age.
c. Infants under 6 months of age.
d. Infants between the ages of 6 and 10 months.
B. Information about "expected" levels or rates in the target population:
1. Proportion of children aged 6-59 months who are stunted.
2. Proportion of children aged 6-59 months who are underweight.
Steps involved in determining survey sample size requirements for a given survey:
• Calculating the number of sample elements required in order to satisfy the measurement requirements for
a given indicator, and how many households would have to be contacted in order to find the number of
elements needed in the first step.
a.
For indicators expressed as proportions:
The following formula may be used to calculate the required sample size for indicators expressed as a
percentage or proportion. Note that the sample sizes obtained are for each survey round or each comparison
group:
alpha = ∞ beta = ß
n = D [(Z∞ + Zß)2 * (P1 (1 - P1) + P2 (1 - P2)) /(P2 - P1)2]
or n = D [(Z alpha + Z beta) squared times (P one times (1 minus P one) plus P two times (1 minus P two))
divided by (P two minus P one) squared]
Where:
n = required minimum sample size per survey round or comparison group;
D = design effect;
P1 = P one, the estimated level of an indicator measured as a proportion at the time of the first survey or for
the control area;
P2 = P two, the expected level of the indicator either at some future date or for the project area such that the
quantity (P2 - P1) is the size of the magnitude of change it is desired to be able to detect;
Z∞ = Z alpha, is the Z-score corresponding to the degree of confidence with which it is desired to be able to
conclude that an observed change of size (P2 - P1) would not have occurred by chance; and
Zß = Z beta, is the Z-score corresponding to the degree of confidence with which it is desired to be certain of
detecting a change of size (P2 - P1) if one actually occurred.
* refers to a multiplication.
Standard values of Z alpha (Z∞ ) and Z beta (Zß ) are provided in Figure A5.2, and the use of the above formula
is illustrated in Figure A5.3. The different parameters in the formula are discussed below.
9.
71](https://image.slidesharecdn.com/anthropometricmeasuringguide-131115034326-phpapp01/85/Anthropometric-measuring-guide-72-320.jpg)
![Artwork proof 3
8/8/01 2:59 pm
Page 72
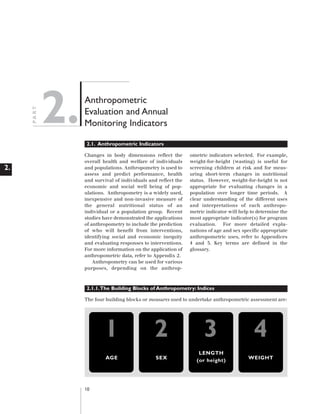
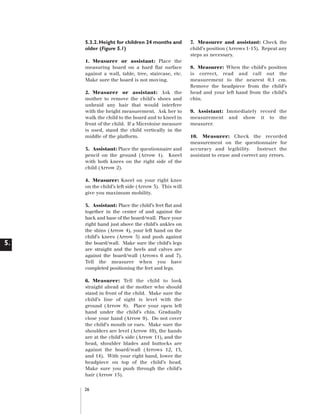
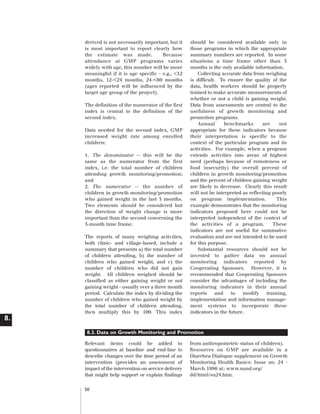
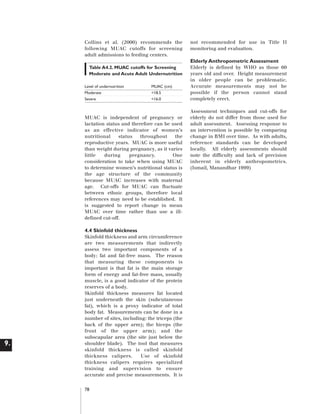
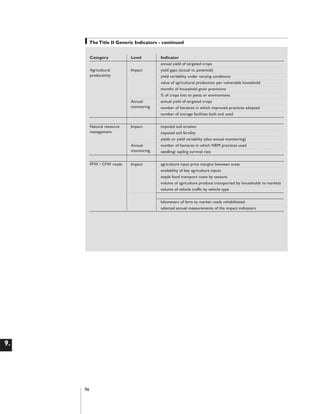
Figure A3.2. Values of Z alpha (Z∞) and Z beta (Zß)
alpha ∞
.90
.95
.975
.99
One-tailed test
1.282
1.645
1.960
2.326
Two-tailed test
1.645
1.960
2.240
2.576
beta ß
.80
.90
.95
.975
.999
Z beta Zß
0.840
1.282
1.645
1.960
2.320
Figure A3.3. Illustrative sample size calculations for indicators expressed as proportions
Example 1
Suppose that it were desired to measure a decrease in the prevalence of underweight (weight-for-age) of 10
percentage points. At the time of the first survey, it is thought that about 40 percent of children between 12
and 36 months were underweight. Thus, P1 = .40 and P2 = .30. Using ‘standard’ parameters of 95 percent level
of significance and 80 percent power, values from Figure A5.2 of alpha (∞) = 1.645 (for a one-tailed test - see
below for further discussion) and beta (ß) = 0.840 are chosen. Inserting these values into the above formula,
we obtain:
n = 2 [(1.645 + 0.840) 2 * ((.3)(.7) + (.6)(.4))] / (.3 - .4) 2
= 2 [(6.175 * 0.45)] / .01
= 2 * [2.77875] / .01 = 2 (277.875) = 555.75
or 556 households per survey round.
Figure A3.4 provides a "lookup" table based upon the above formula to permit sample sizes to be chosen
without having to perform calculations. The table provides sample sizes needed to measure changes/differences
in a given indicator of specified magnitudes P two minus P one (P2 - P1) for different initial levels of the
indicator (P1). The table is for values of alpha (∞) = 0.95 and beta (ß) = 0.80.
Figure A3.4. Sample sizes required for selected combinations of P one (P1) and changes
or comparison-group differences to be detected (for alpha (∞) = .95 and beta (ß) = .80)
Change/difference to be detected (P2 - P1) (P two minus P one)
P one
P1
.10
.15
.20
.25
.30
.35
.40
.45
.50
9.
.05
.10
.15
.20
.25
.30
1,075
1,420
1,176
1,964
2,161
2,310
2,408
2,458
2,458
309
389
457
513
556
587
606
611
606
152
185
213
235
251
262
268
268
262
93
110
124
134
142
147
148
147
142
63
73
81
57
90
92
92
90
87
45
52
56
60
62
62
62
60
56
Note: sample sizes shown assume a design effect of 2.0 and one-tailed tests. In a study of population-based cluster surveys to
determine the design effects Katz (AJCN, 1995 Jan; 61(1):155-60) found the design effect range from 0.44 to 2.59. The use of
D=2.0, therefore is conservative. For values of P one (P1) greater than .50, use the value in the table that differs from .50 by
the same amount. For example, for P one (P1 ) = .60, use the value for P one (P1 ) = .40; for P one (P1 ) = .70, use the value for
P one (P1 ) = .30.
72](https://image.slidesharecdn.com/anthropometricmeasuringguide-131115034326-phpapp01/85/Anthropometric-measuring-guide-73-320.jpg)
![Artwork proof 3
8/8/01 2:59 pm
Page 73
REFERENCES
PA R T 9 .
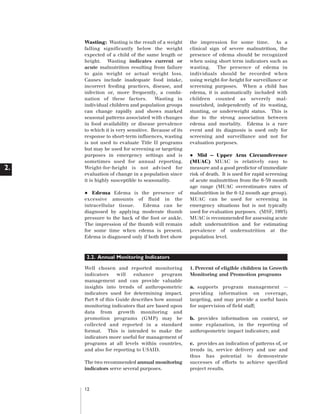
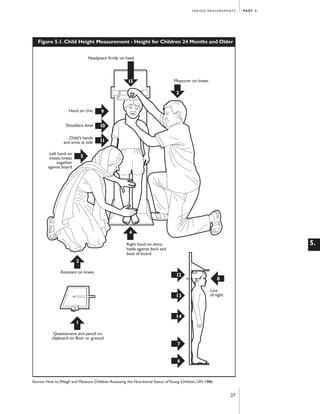
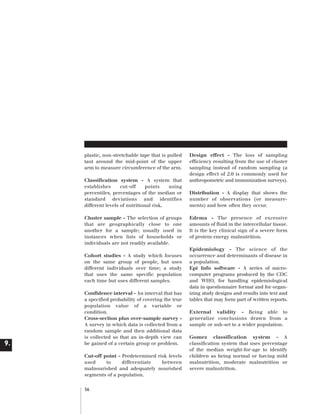
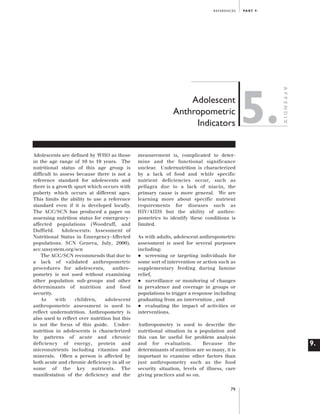
For indicators expressed as means or totals
For indicators that are means or totals, the following formula may be used to calculate sample size
requirements for each survey round or comparison group:
n = D [(Z∞ + Zß)2 * (sd12 + sd22) / (X2 - X1)2]
(n equals D time [(Z alpha plus Z beta) squared times (sd one squared + sd two squared) divided
(X two minus X minus) squared]
Where:
n = required minimum sample size per survey round or comparison group;
D = design effect;
Z∞ = Z alpha the Z-score corresponding to the degree of confidence with which it is desired to be able to
conclude that an observed change of size (X2 - X1) would not have occurred by chance;
Zß = Z beta the Z-score corresponding to the degree of confidence with which it is desired to be certain of
detecting a change of size (X2 - X1) if one actually occurred;
sd1 and sd2 = "expected" standard deviations for the indicators for the respective survey rounds or comparison
groups being compared;
X1 = X one is the estimated level of an indicator at the time of the first survey or for the control area; and
X2 = X two is the expected level of the indicator either at some future date or for the project area such that
the quantity (X2 - X1) is the size of the magnitude of change or comparison-group differences it is desired to be
able to detect.
The primary difficulty in using the above formula is that it requires information on the standard deviation of the
indicator being used in the sample size computations. The preferred solution to this problem would be to use
values from a prior survey that had been undertaken in the setting in which a program under evaluation is being
carried out. If such data are not available, data from another part of the country or a neighboring country with
similar characteristics may be used. Such data are often presented in survey reports.
9.
73](https://image.slidesharecdn.com/anthropometricmeasuringguide-131115034326-phpapp01/85/Anthropometric-measuring-guide-74-320.jpg)


This document provides guidance on collecting and reporting on anthropometric indicators and annual monitoring indicators for Title II maternal and child health and nutrition programs. It discusses the key impact indicators of reduced stunting and underweight in children, as well as recommended annual monitoring indicators of growth promotion program participation and weight gain. The document provides information on anthropometric data collection, equipment, measurements, analysis, and comparison to standards. It aims to support consistent monitoring and evaluation of child nutrition activities.


