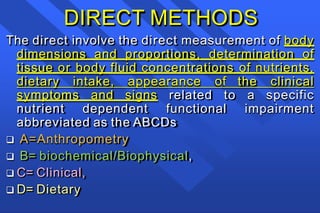
This document provides information on nutritional assessment using anthropometric measurements. It begins by defining nutritional assessment and describing direct and indirect assessment methods. The direct methods include anthropometry (A), biochemical tests (B), clinical exams (C), and dietary assessments (D).
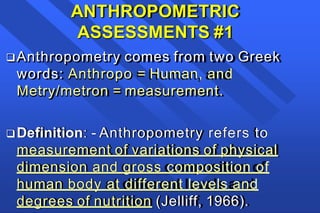
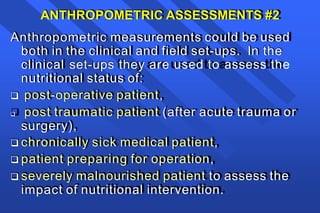
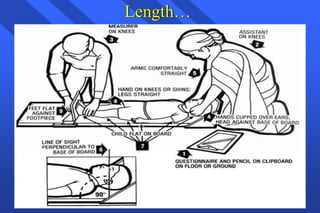
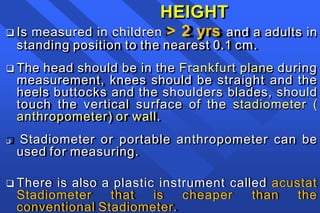
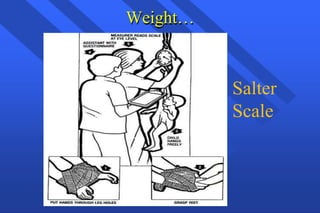
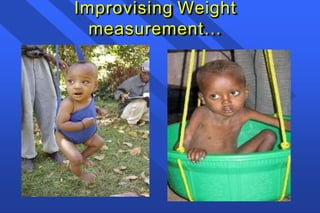
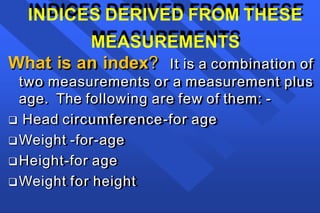
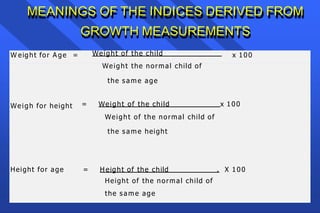
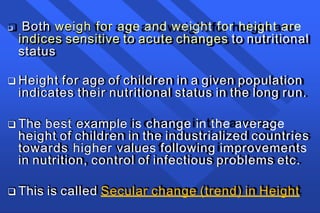
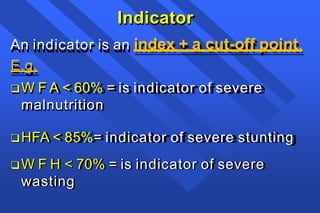
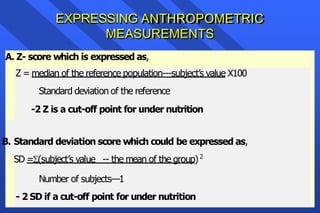
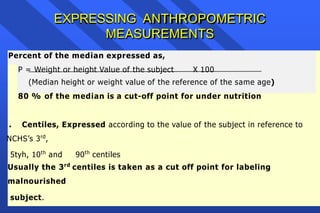
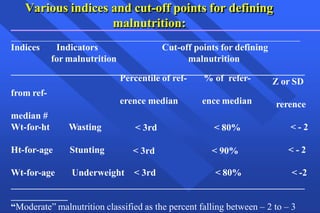
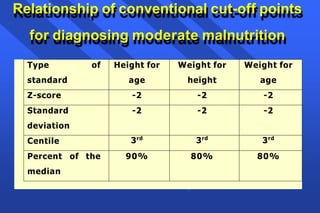
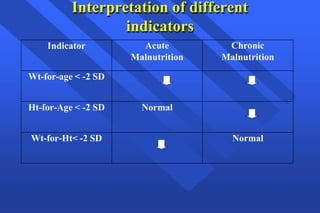
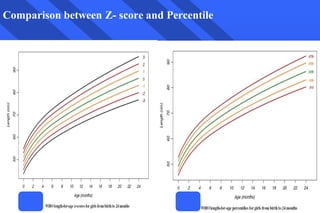
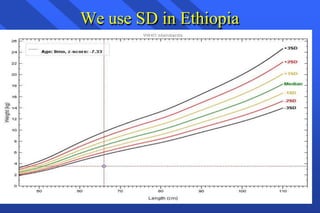
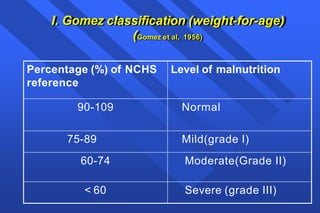
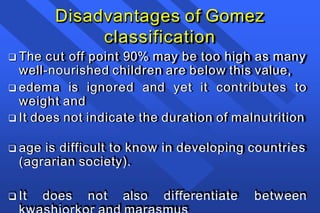
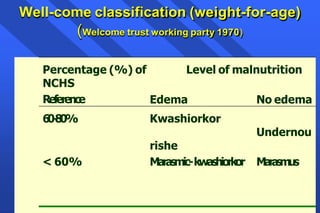
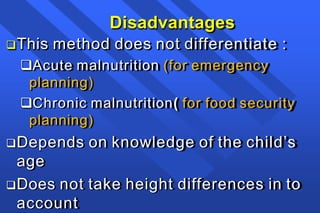
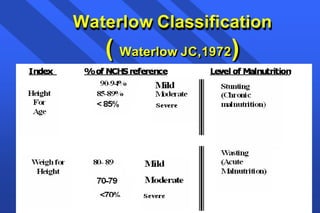
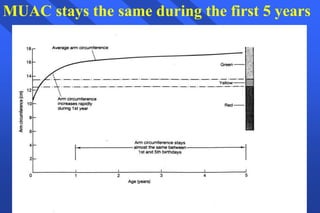
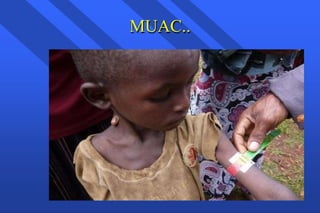
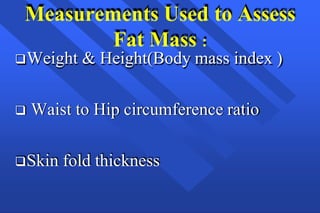
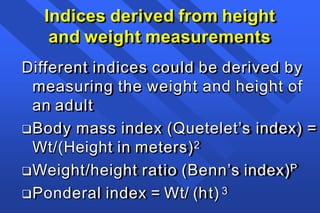
The document focuses on anthropometric assessments (A) which involve direct body measurements. It describes several anthropometric measurements used to assess growth in children, such as weight, height/length, mid-upper arm circumference, and head circumference. The document also discusses deriving indices from these measurements, such as weight-for-age, height-for-age, and weight-for-height, which are used to evaluate nutritional status. Finally, it provides classifications systems


![Assessment of Nutritional Status by Dr.Faryal Shaikh [ August 30th, 2025 ]] f...](https://cdn.slidesharecdn.com/ss_thumbnails/assessmentofnutritionalstatusbydr-251120113500-143fc093-thumbnail.jpg?width=640&height=640&fit=bounds)


