
Recommended
More Related Content
Similar to Assessment of Nutritional Status.pptx
Similar to Assessment of Nutritional Status.pptx (20)
Recently uploaded
Recently uploaded (20)
Assessment of Nutritional Status.pptx
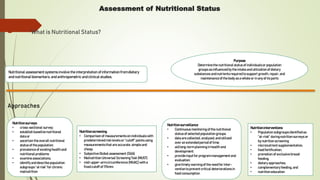
- 1. Assessment of Nutritional Status What is Nutritional Status? What is Nutritional Assessment? Approaches Nutritional assessment systems involve the interpretation ofinformation fromdietary and nutritional biomarkers, and anthropometric andclinical studies. Purpose Determinethe nutritional status of individualsor population groups as influencedby the intakeandutilization of dietary substances andnutrientsrequired to support growth, repair, and maintenanceof the body as awhole or in any of its parts Nutritioninterventions • Population subgroups identifiedas “at-risk” duringnutrition surveys or by nutrition screening • micronutrient supplementation, • food fortification, • promotion of exclusive breast feeding, • dietary approaches, • complementary feeding,and • nutrition education Nutritionscreening • Comparison of measurementson individualswith predeterminedrisk levelsor “cutoff” points using measurementsthatare accurate, simple and cheap. • SubjectiveGlobal assessment (SGA) • Malnutrition UniversalScreeningTool (MUST) • mid-upper-armcircumference (MUAC) witha fixedcutoff of 115mm. Nutritionsurveillance • Continuous monitoring of the nutritional status of selected population groups. • dataare collected, analyzed,andutilized over an extendedperiodof time; • aidlong-term planningin health and development; • provide input for program managementand evaluation; • givetimely warningof the needfor inter- vention to prevent critical deteriorations in food consumption Nutritionsurveys • cross-sectional survey; • establish baselinenutritional dataor • ascertain the overall nutritional status of the population; • prevalence of existinghealthand nutritional problems • examineassociations, • identifyanddescribe population subgroups “atrisk” for chronic malnutrition
- 2. Nutritional AssessmentMethods Measurements of the variations of the physical dimensions and the gross composition of the human body at different age levels and degrees of nutrition. Anthropometric measurements Biochemical/ Laboratory tests Clinical evaluations Dietary assessment ANTHROPOMETRY Uses • Related to past exposures, to present processes, or to future events; • Used both at clinical and public health settings At individual levels, • diagnose failure to thrive in infants and young children, • monitor overweight and obesity in children and adults; At population levels, • targeting interventions through screening; • assessing the response to interventions; • identifying the determinants and consequences of malnutrition; • conducting nutritional surveillance; • characterize and compare the health and nutritional status of populations across countries. • Stature (lengthor height), • weight, and • headcircumference; • Skinfold thickness (sizeof the subcutaneous fat depot); • waist circumference (intra-abdominalvisceral fat); • mid-upper-arm circumference – MUAC (skeletalmuscle mass); • Etc Measurements Body Size Body Composition
- 3. • Calculatedfrom two or more raw measurements; • Essentialfor the interpretation and grouping of mea- surements collectedin nutritional assessment; Examples • weight-for-age; • height-for-age; • weight-for-height; • Weight-for-length; • Body mass index (BMI); • BMI-for age; • waist-hipratio • Comparing anthropometric data and or indiceswith the distri- bution of appropriate anthropometric referencedata using standarddeviation scores (Z-scores) or percentiles. • thenumber and proportion of individuals(as %) with anthropometric indicesbelow or above a predetermined referencelimit or cutoff are often calculated; • the indexand its associated referencelimit or cutoff become an “indicator” • constructed from anthropometric indices • Z-scores isthe distanceand direction of anobservation awayfromthe population mean. • Itindicates how many standard deviations anobservation isawayfrom themean inthe referencepopulation. • Percentiles give information onthe percentage of observations that fall below acertain value inthe referencepopulation.
- 4. Anthropometric Indices and respective indicators Length/height-for-age • reflectsattainedgrowthinlengthorheight atthechild’sageatagiventime. • canhelpidentifychildrenwhoarestunted (short)duetoprolongedundernutritionor repeatedillness. • Childrenwhoaretallfortheiragecanalso beidentified,buttallnessisrarelya problemunlessitisexcessive andmay reflectuncommonendocrinedisorders (+3 z-score). • Between+2to-1z-scoreisconsidered normal • -2z-scoreindicatesstunting • -3z-scoreindicatessevere stunting Weight-for-age • reflectsbody weightrelativeto thechild’sageon agivenday. • assesseswhethera childisunderweight, • notusedto classifya childas overweightorobese (+1to +3z-scores). • cannotbereliedupon insituations wherethe child’sagecannotbeaccuratelydetermined,such asrefugeesituations. • Itispossibleforunderweighttooccureither becauseofshortlength/height(stunting) or thinnessorboth. • Btwmedianto -1z-scoresareconsiderednormal • -2z-scoreindicatesunderweight • -3z-scoreindicatessevereunderweight
- 5. Weight-for-length/height • reflectsbody weightinproportion to attained growth inlength or height. • usefulinsituations wherechildren’s agesareunknown (e.g.refugee situations). • helpsidentify children withlow weight-for-height who may bewasted or severely wasted. • aswell ashigh weight-for-length/height who maybe atriskof becoming overweight or obese; • wasting isusually caused byarecent illnessor food shortage that causesacute and severeweightloss; • chronic undernutrition or illnesscanalso causethiscondition. • Btw median to -1z-scores areconsidered normal; • +3 z-score isobese; • +2 z-score isoverweight • +1z-score isat possible riskofoverweight • -2z-score indicates wasting • -3 z-score indicates severewasting BMI-for-age • usefulforscreeningforoverweight andobesity; • Btwmedianto -1z-scoresare considerednormal; • +3z-scoreisobese; • +2z-scoreis overweight • +1z-scoreis atpossibleriskof overweight • -2z-scoreindicateswasting • -3z-scoreindicatesseverewasting
- 8. Commonly used in healthcare systems to monitor the growth and development of infants, children and adolescents. height, weight, head circumference, and body mass index (BMI), on a standardized graph. track and measure a child's growth over time in order to identify any deviations from the expected or normal growth patterns. Growth charts provide valuable information for parents, healthcare providers, and researchers. early detection of growth disorders, nutritional deficiencies, hormonal imbalances, or other underlying medical conditions that could affect a child's growth. baseline for assessing the effectiveness of interventions or treatments. identify differences in growth rates and patterns and inform public health policies and interventions Growth Charts WHO Growth Charts CDC Growth Charts Down Syndrome Growth Charts Premature Infant Growth Charts Ethnic-Specific Growth Charts
- 9. WHO Growth Charts • Developed by WHO; • growth data from a diverse international population; • boys and girls aged 0-5years; • based on breastfed infants; • preferred growth charts for infants and young children. CDC Growth Charts • Developed by CDC; • children aged 2-20years; • Based on data from the National Health and Nutrition Examination Survey (NHANES); • based on a representative sample of the US population. Examples Examples z-scores: girls Girls chart- Length for age: birth to 6 months (z-scores) Girls chart- Length for age: birth to 2 years (z-scores) Girls chart- Length for age: 6 months to 2 years (z-scores) Girls chart- Height for age: 2 to 5 years (z-scores) Girls chart- Length/height for age: birth to 5 years (z-scores) Percentiles: girls Girls chart- Length for age: birth to 6 months (percentiles) Girls chart- Length for age: birth to 2 years (percentiles) Girls chart- Length for age: 6 months to 2 years (percentiles) Girls chart- Height for age: 2 to 5 years (percentiles) Girls chart- Length/height for age: birth to 5 years (percentiles)
- 10. Growth Charts Contd. x-axis: • Horizontal reference line at the bottom of the graph; • some show age and some show length/height; • Plot points on vertical lines corresponding to completed age (in weeks, months, or years and months); • or to length or height rounded to the nearest whole centimetre. y-axis: • vertical reference line at the far left of the graph. • show length/height, weight, or BMI; • Plot points on or between horizontal lines corresponding to length/height, weight or BMI as precisely as possible. Plotted point • point on a graph where a line extended from a measurement on the x-axis (e.g. age) intersects with a line extended from a measurement on the y-axis (e.g. weight)
- 14. Midupper Arm Circumference (MUAC) • MUAC ismeasured inboth adults and children, • sumof the muscleand subcutaneous fatintheupperarm; • can be used as a indicator of body composition in adults and children; • Measured to nearest 0.1cm; • aflexiblenon-stretch tape; • It is measured on a straight left arm; • mid-way between the tip of the shoulder and the tip of the elbow; • <12.5cmsuggestsmalnutrition; • >13.5cmisnormal.
- 15. Body mass index - BMI • ameasureofbody fatbased onheightandweightthat appliesto adult menandwomen; • definedasaperson’sweightin kilogramsdividedbythe square oftheperson’sheightin metres(kg/m2); • Forexample,anadultwhoweighs70kgandwhoseheight is1.75 mwillhaveaBMIof22.9. • For children and teens, BMI is age- and sex-specific; • often referred to as BMI-for-age; • The BMI-for-age percentile growth charts are the most used indicator to measure the size and growth patterns; BMI for Children and Adolescents
- 16. Anthropometry: Strengths and Weaknesses Advantages • Simple, safe, noninvasive techniques are involved, which can be used at the bedside of a single patient, but arealso applicable to largesample sizes; • Inexpensive equipment is required. It is portable, and durable and can be made or purchased locally; • Relatively unskilled personnel canperformthe measurement procedures ifadequately trained; • Methods can be precise and accurate, if standardized techniques and trained personnel are used; • Retrospective information is generated on past long-term nutritional history, which cannot be obtained with equal confidence using other techniques; • Mild to moderate undernutrition, as well as severe states of under- or overnutrition, can be identified; • Changes in nutritional status over time and from one generation to the next, a phenomenon known as the secular trend, canbeevaluated Disadvantages • Relativelyinsensitiveand cannotdetect disturbances innutritional status overshort periods oftime; • Cannotidentifyanyspecificnutrientdefi- ciencyand,therefore,is unableto distinguish disturbancesin growth andbody composition inducedby nutrientdeficiencies; • Certainnon-nutritionalfactors(suchas disease,geneticinfluences,diurnal variation, andreducedenergyexpenditure) canlowerthespecificityandsensitivityof anthropometricmeasurements
- 17. describe exposure to food and nutrient intakes as well as information on food behaviors and eating patterns. Uses include: dietary counseling and education; designing healthy diets for hospitals, schools, long-term care facilities and prisons; generate information on nutrient adequacy within a country; identify population groups at risk, and develop nutrition intervention programs; study relationships between diet and disease; formulating nutrition policy such as food-based dietary guidelines. Dietary Intake methods
- 19. FBSarecompiled byFAOannuallyandaremainlybasedoncountry-leveldatacovering acalendaryear; Givesinformationonavailableseeds,wastecoefficients, stockchangesandtypesofutilizationtopreparesupply/utilizationaccountinweights; theFAOFBSalsoprovide totalfood availabilityestimatesbyaggregatingthefood componentofallcommodities includingfisheryproducts; Thedataareconventionallypresentedpercapita,byadjustingforpopulationsize,e.g.availableamountoffood/energy/ nutrientsperpersonperday; Morespecifically, FBSpresentacomprehensivepictureofacountry’sfood supplyovertime; TheFBSlistfood items,i.e.primaryfoodcommodities andanumberofprocessedfoodcommodities potentiallyavailableforhumanconsumption,includingtheirsourcesofsupplyandutilization; Grossnationalfoodsupplyinagiven referenceperiod ofacountryiscalculatedfromthetotalquantityoffoodproducedplusthetotalquantityimported, adjustedforchangesatnationalfoodstocklevelsandexports; Netfood availabilityiscalculatedby subtractingtheamountsusedforanimalfeed,seeds,industrialorotherpurposesand lossesinthesupplychain; Thisnetvalueisthendivided by thecountry’spopulationestimatetoobtainafinalfiguredescribing theavailabilityoffoodcommodities, expressedaskilogramspercapitaperyear; Thispercapitainformationcanalsobe linkedtofoodcomposition dataandpresentedaspercapitaenergyintake(kilocalories perday),proteinintake(gramsperday)andfatintake(gramsperday). Food Balance Sheets – national food availability
- 20. widely used in the food and agriculture sectors to monitor global food patterns and dietary habits; trends and changes in overall national food availability, and the adequacy of a country’s supply to meet nutritional requirements; used to set public health priorities, formulate policies, undertake intercountry comparisons; estimate the likelihood of micronutrient deficiencies. For example, FBS data was used to identify the probability of micronutrient deficits in food supply per capita Applications and uses of FBS
- 22. Food Consumption: “the total amount of food available for consumption in the household, generally excluding food eaten away from the home unless taken from home” Examples Household Budget Survey (HBS) the Living Costs and Food Survey (LCFS), the Household Income and Expenditure Survey (HIES), the Living Standards Measurement Study (LSMS), the Household Expenditure Survey (HES); the Integrated Household Survey (IHS) The central statistical offices in countries are usually responsible for data collection. Household members keep records on all expenses and type of foods consumed during a specific time period, usually one to four weeks, and preferably evenly distributed during different times in the year, which is then provided to enumerators. The collected data are analysed and used to assess food consumption at household level. Household Consumption and Expenditure Surveys – household food consumption
- 24. FFQs assesses the frequency with which foods and/or food groups are eaten over a certain time period. provide information that establishes usual dietary intake The questionnaire includes a food list (usually close-ended) and a frequency category section, and can be self- or interviewer administered. Depending on the study objectives, data collection might be daily, weekly, monthly or yearly. Furthermore, FFQs can include information about portion sizes and/or quantity of food intake - semi-quantitative. By including portion size as part of frequency, the questionnaire allows for the estimation of food quantities eaten and of nutrient intakes. Food frequency questionnaire
- 26. During a 24-hour recall, respondents (i.e. adults, children and their parents or caretakers) are asked, by a nutritionist or dietitian who has been trained ininterviewing techniques, to recall and report all foods and beverages consumed over thepreceding 24hours. However, asingle 24-hour recall isnot enough to describe anindividual’s usualintake of food and nutrients. multiple nonconsecutive 24-hour recalls on the sameindividual are required inorder tocapturedailyvariability; Tobeusedasacomparison method tovalidate anFFQ; canincreasequality control, minimizeerrorsandmaximizereliability; Quantitative information on food intake, as described using portion size,allows for the calculation of energy and nutrient intakes; Estimation of portion sizeisfacilitated by the useof measurement aids suchas standard household measures,photo atlases, food models, etc; To calculate energy and nutrient intakes, the estimated portion size or the amount of food intake is multiplied by the values of nutrient content in foods as found inthefood composition tables or databases 24-hour recall
- 28. Estimated food records • Whenconductinganestimatedfoodrecord,respondentsareinstructedto documentallfoodsandbeveragesconsumedduringapredefinedperiod (e.g.1to 7days). • Thenumberofdays includedintheassessmentdependsonthepurpose ofthestudy; • Duringtherecordperiod, specificdetailssuchas brandnames,timeofdaythefood orbeveragewasconsumed,thelocationandsometimesa description oftheoccasionaredocumentedas well; • Estimation ofthefoodportion orfood weightconsumedisnormallyaidedbyusingstandardized householdmeasures,food photographs ormodels; • Priortodata collection,respondentsareoftenprovidedtrainingand practiceonrecording,inorderto becomefamiliarwith thesteps ofthe assessment,especiallyforfoods eatenoutside thehome; • Toensurethat data collectionisaccurate,ahomevisit bytrainedinterviewersonthefirstday ofrecordingishelpful; • Afterdata collectioniscompleted,calculationofnutrientintake isdoneusingafoodcomposition database.
- 30. Theweighedfoodrecordisoftenregardedasthemostprecisemethodforestimatingthefoodandnutrientintakesofindividuals. Theapproachadoptsthesameprinciplesastheestimatedfoodrecordmethod; However,inthis methodrespondents areaskedto weighusingweighingscales(e.g.adigitalelectronicscalewithatarebutton to facilitatefoodweighing). Thesubjectsdirectlycopytheweightofanindividualfoodfromthescalewhileconductingadditiveweighingwithoutthenecessityof manipulatingfigures,andthusavoiding errors; Allfoodandbeveragesconsumedareweighedandrecorded,alongwithadescription ofportion size,brand namesanddetailsonfood preparation; apredefinedmeasurementperiod (between1to 7days)needstobeset; weekenddaysshouldbeincludedtoaccountforchangesinfoodintakeduring weekenddays. Toobtainevenmoreprecisedata,leftoverscanalsobeweighedor estimated; Additionalconsiderationsforaccuracy rawingredients separatelybeforecooking,andthis isespeciallyimportant for mixeddishes; fulldescription ofthefoodsconsumed,theoccasionandlocationforfoodsconsumedawayfromhome; Prior to therecording period,therespondents shouldbeprovided withinstructions for recording, withsufficienttimeforpracticingand remindersaboutmaintainingtypicaldietary habitsduring therecording period; homevisits arenormallyarrangedduring thestudyperiod toascertainthattheproceduresarecarriedoutproperly Weighed food records
- 32. Theduplicate mealmethodinvolves setting aside duplicateportions of all foods andbeverages consumed throughout aspecifictimeperiod. These retained duplicateportions are set aside, weighed,either bytherespondent orfieldworker, andthen senttoalaboratory for chemicalanalysis todetermine nutrient content. respondents also maintainaweighedfood diary torecord details of thefoods andbeverages consumedduring theassessment period andprovide information onportion size expressed inweightsor household portions. Thefood diary canhelptoverify thecomprehensiveness of collectingduplicate foods andaccuracy of the portion sizes of theduplicatemeal; Acomparison of nutrient intakes canbemadebetweenthevalues of analysed nutrients andthenutrient intake whichiscalculated basedonthereported portion size anddatafrom afood compositiondatabase. Duplicate meal method
- 34. TheDietary Diversity Score (DDS) isaproxy tool based on the concept that ‘dietary diversityis akeyelement of diet quality and avaried diethelps ensure adequate intakes of essential nutrients that promote health’ DDS provides asimplescore whichrepresentsanumber of differentfoods and/or food groups consumed over agiven referenceperiod; There arevarious DDSs published and used for different purposes. Theydifferinthe numberand definition of food; groups or food items,referenceperiods and units of analysis (i.e. household or individual level). Qualitative retrospective proxy tools for assessing dietary diversity HouseholdDietaryDiversityScore(HDDS) • isbased onthecountof12-foodgroups. • information isextractedfromonequalitative 24-hourrecall, excludingfoods consumedoutside thehome; • accessesthequality offoodaccessathouseholdlevel; • additionally, it isusefulforidentifyingemergenciesrelated to foodsecurityandmalnutrition. Minimum Dietary Diversity
- 35. MinimumDietaryDiversity –Women(MDD-W) TheMDD-Windicatoraims to beusedas aglobalindicator ofdietary diversity; Minimum Dietary Diversity –Women (MDD-W) • Food consumption of individuals during thepreceding 24hours isrecalled using a qualitative 24-hour recall questionnaire, including foods that have beeneaten outside thehome. • Theinformation on food consumption, collected either by24-hour recall or list-based questionnaire, that matches theitems inthe16-food group list areunderlined; • To createtheMDD-W score,thepreliminary listof the 16-food group isaggregated into the10-food group indicator whereone point isallocated whenever afood item contained inthe 10-food groups hasbeen underlined inthe16-food group list. • Evenifeachfood group hasone or more underlined food itemonly one point isallocated, thuscontributing equally to thefinalscore. • Thevalueof zeroisgivenifnone of thefood itemsinthe food group wereconsumed. The sumof the consumed food groups representsthetotal DDS. • Only food items that wereconsumed inaquantity greater than 15grams(roughly a tablespoon) should beconsidered and included inthe 10-food group indicators. • Acut-off point of fiveistaken asthe‘bestcut off’sinceitrecommended asareasonable predictor of anMPA *meanprobabilityofmicronutrientadequacy(MPA)
- 36. IYCDDS isdefinedasthe “Proportion of children6–23 months of agewho receivefoods fromfour or more food groups” Theindicator isbased on thecount of 7-food groups. consumption of any amount of food from eachfood group is sufficientenough to beaccounted for inthe construction of thescore, except ifanitemisonly used asacondiment; Thecut-off of atleast four of the above 7-food groups indicates aminimum dietarydiversity ininfantsand young children. Infant and Young Child Dietary Diversity Score (IYCDDS)
- 37. Laboratorymethodsareusedtomeasurenutritionalbiomarkers; usedtodescribestatus,function,riskofdisease,andresponsetotreatment; nutritionalbiomarker:abiologicalcharacteristicthatcanbeobjectivelymeasured andevaluatedasanindicatorofnormalbiologicalorpathogenicprocesses,and/oras anindicatorofresponsestonutritioninterventions; Theycanalsobeusedtodescribeexposuretocertainfoodsornutrients,whenthey aretermed“dietarybiomarkers” Mostusefularenutritionalbiomarkersthatdistinguishdeficiency,adequacyand toxicity,and whichassessaspectsofphysiologicalfunctionand/orcurrentorfuturehealth. Canbemeasured using: • biological tissuesand fluids; • physiological or behavioral functions; • metabolic and geneticdata that inturninfluence health, well- being,and riskof disease. • Laboratory tests canhelp confirm nutritional status findings uncovered during adietary assessment and physical examination Biochemical/Laboratory Methods