Download to read offline


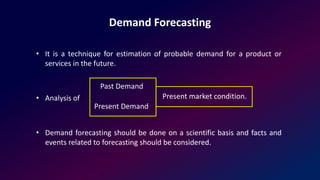
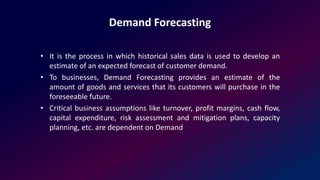
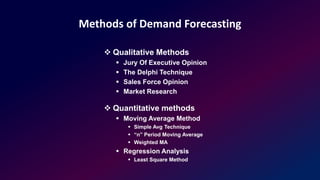

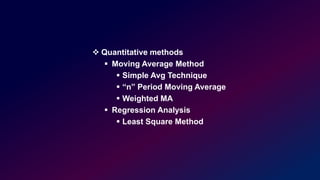
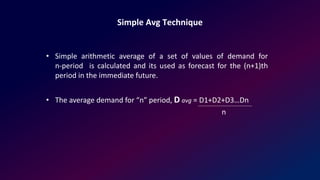
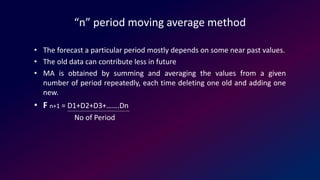
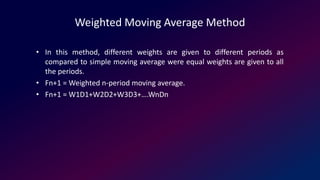
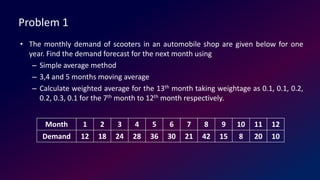
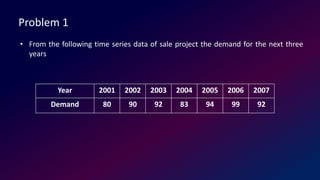


The document discusses demand forecasting techniques. It defines demand forecasting as estimating probable future demand using historical sales data. Accurate forecasting is important for business planning activities like production, marketing, finance, etc. The document outlines qualitative methods like executive opinion and quantitative methods like simple average, moving averages, regression analysis. It provides examples of calculating forecasts using different techniques and discusses using regression analysis to identify impactful variables.


