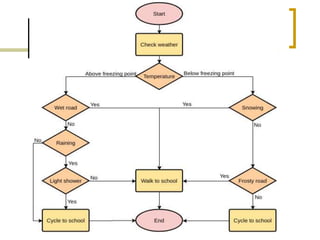
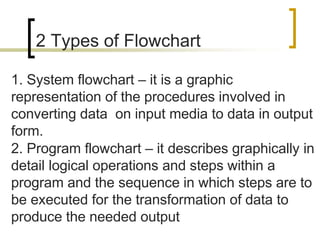
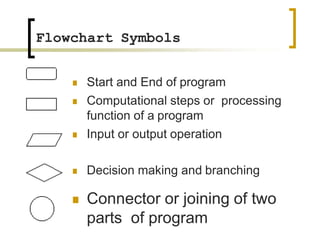
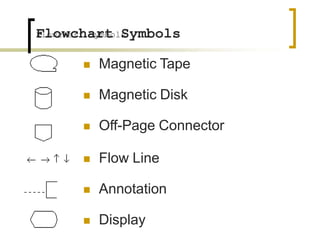
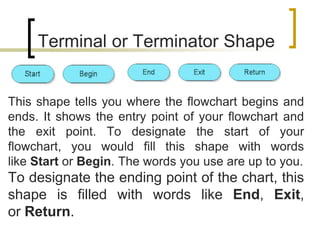
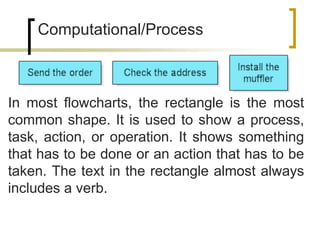
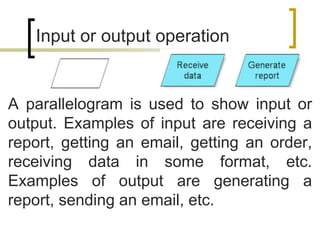
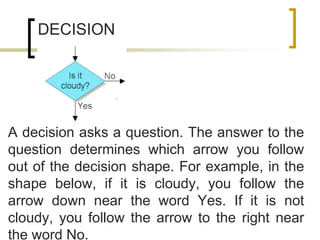
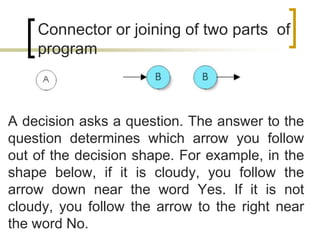
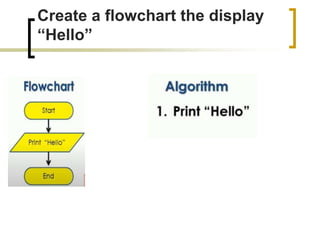
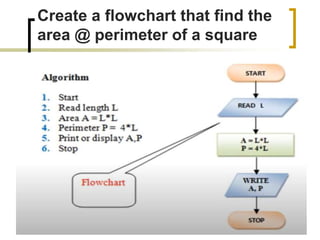
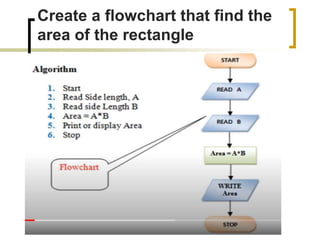
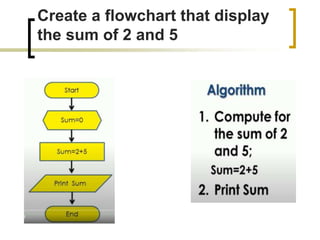
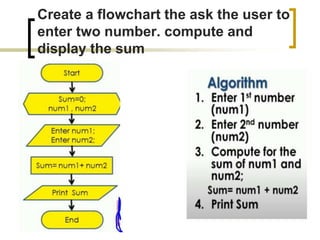
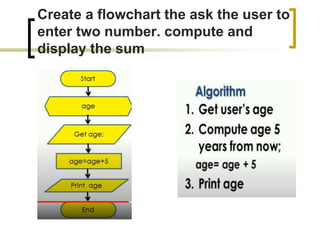
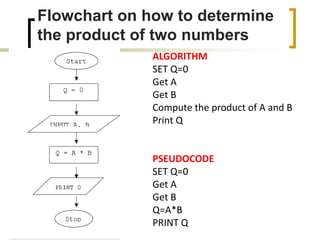
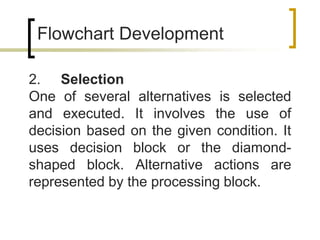
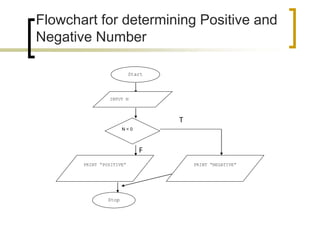
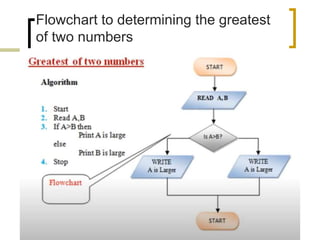
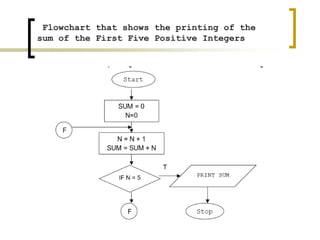
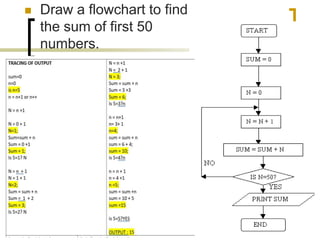
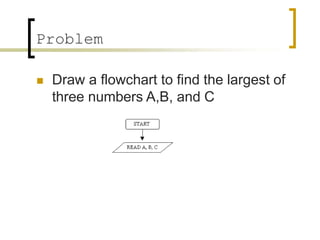
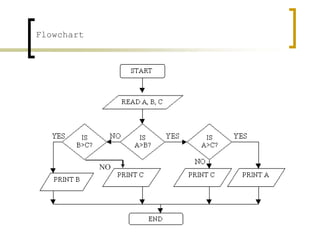
The document provides information about flowcharts including:
- Flowcharts use symbols to represent steps in a process or program and the flow from one to the next.
- Common symbols include shapes for processes, decisions, inputs/outputs, and connecting arrows.
- Examples of flowcharts are given for finding the sum of two numbers, determining if a number is positive or negative, and finding the greatest of two numbers.
- Flowcharts can model sequential, selection, and repetitive program logic.
Computer programming:Know How to FlowchartAngelo Tomboc
This topic guides you how to flowchart...What are the symbols. Some mathematical symbols are included to especially equal,more than, less than, not equal, more than or equal to, and less than or equal to. Flowcharting...what is that???Flowcharting is just a building house using your bricks, tools in carpenter, and a blueprint...So, [G]LHF ([G]OOD LUCK HAVE FUN) ^_^
A brief, language-no-specific introduction to programming concepts - some ways to approach a programming problem, and general characteristics of programming languages (with a bit of a slant towards scripting languages).
ppt on flow chart by harshid panchal with help of Sejal ma'm (git.org.in)harshid panchal
this is the simple power point presentation on flowchart
made by me harshid panchal with the help of my fav. ma'm sejal bhavsar . and we are from gandhinagar institute of technology(git.org.in)
if u have any query then contact me on harshidpanchalhp@gmail.com or you can also contact my ma'm on sejal.bhavsar@git.org.in
Arrays
Array Creation , Accessing Elements
Sub Arrays, Representation, Operations
Maximum and Minimum values in Matrix
Potential Energy-Spring Problem
SUMMARY
Normal Labour/ Stages of Labour/ Mechanism of LabourWasim Ak
Normal labor is also termed spontaneous labor, defined as the natural physiological process through which the fetus, placenta, and membranes are expelled from the uterus through the birth canal at term (37 to 42 weeks
Introduction to AI for Nonprofits with Tapp NetworkTechSoup
Dive into the world of AI! Experts Jon Hill and Tareq Monaur will guide you through AI's role in enhancing nonprofit websites and basic marketing strategies, making it easy to understand and apply.
Read| The latest issue of The Challenger is here! We are thrilled to announce that our school paper has qualified for the NATIONAL SCHOOLS PRESS CONFERENCE (NSPC) 2024. Thank you for your unwavering support and trust. Dive into the stories that made us stand out!
2024.06.01 Introducing a competency framework for languag learning materials ...Sandy Millin
http://sandymillin.wordpress.com/iateflwebinar2024
Published classroom materials form the basis of syllabuses, drive teacher professional development, and have a potentially huge influence on learners, teachers and education systems. All teachers also create their own materials, whether a few sentences on a blackboard, a highly-structured fully-realised online course, or anything in between. Despite this, the knowledge and skills needed to create effective language learning materials are rarely part of teacher training, and are mostly learnt by trial and error.
Knowledge and skills frameworks, generally called competency frameworks, for ELT teachers, trainers and managers have existed for a few years now. However, until I created one for my MA dissertation, there wasn’t one drawing together what we need to know and do to be able to effectively produce language learning materials.
This webinar will introduce you to my framework, highlighting the key competencies I identified from my research. It will also show how anybody involved in language teaching (any language, not just English!), teacher training, managing schools or developing language learning materials can benefit from using the framework.
Unit 8 - Information and Communication Technology (Paper I).pdfThiyagu K
This slides describes the basic concepts of ICT, basics of Email, Emerging Technology and Digital Initiatives in Education. This presentations aligns with the UGC Paper I syllabus.
Safalta Digital marketing institute in Noida, provide complete applications that encompass a huge range of virtual advertising and marketing additives, which includes search engine optimization, virtual communication advertising, pay-per-click on marketing, content material advertising, internet analytics, and greater. These university courses are designed for students who possess a comprehensive understanding of virtual marketing strategies and attributes.Safalta Digital Marketing Institute in Noida is a first choice for young individuals or students who are looking to start their careers in the field of digital advertising. The institute gives specialized courses designed and certification.
for beginners, providing thorough training in areas such as SEO, digital communication marketing, and PPC training in Noida. After finishing the program, students receive the certifications recognised by top different universitie, setting a strong foundation for a successful career in digital marketing.
How to Make a Field invisible in Odoo 17Celine George
It is possible to hide or invisible some fields in odoo. Commonly using “invisible” attribute in the field definition to invisible the fields. This slide will show how to make a field invisible in odoo 17.
Biological screening of herbal drugs: Introduction and Need for
Phyto-Pharmacological Screening, New Strategies for evaluating
Natural Products, In vitro evaluation techniques for Antioxidants, Antimicrobial and Anticancer drugs. In vivo evaluation techniques
for Anti-inflammatory, Antiulcer, Anticancer, Wound healing, Antidiabetic, Hepatoprotective, Cardio protective, Diuretics and
Antifertility, Toxicity studies as per OECD guidelines
2. Guess what games? Guess if the
sample outline words is an algorithm
or Pseudocode
Get value of A
Get value of B
C = A + B
Display the value of C
pseudocode
3. Guess what games? Guess if the
sample outline words is an algorithm
or Pseudocode
algorithm
Get the list of names
Get the name being checked
Set a counter to 0
Do the following for each name on the list:
Compare the name on the list to the name being
checked, and if the names are the same, then add
one to the counter
Answer is the number indicated by the counter
7. OBJECTIVES
At the end of the lesson the students
can able to;
• Define the flowchart
• Identify the different symbols of
flowchart
• Create flowchart of a given
problem
• Trace the output of the flowchart
8. Flowchart
A drawing that shows how a program
will operate, the steps that will be
followed, and the order in which they
will be followed
is a representation, primarily through
the use of symbols, of the sequence of
activities in a system (process,
operation, function, or activity).
9. 2 Types of Flowchart
1. System flowchart – it is a graphic
representation of the procedures involved in
converting data on input media to data in output
form.
2. Program flowchart – it describes graphically in
detail logical operations and steps within a
program and the sequence in which steps are to
be executed for the transformation of data to
produce the needed output
10. Flowchart Symbols
Start and End of program
Computational steps or processing
function of a program
Input or output operation
Decision making and branching
Connector or joining of two
parts of program
11. Flowchart Symbols
Magnetic Tape
Magnetic Disk
Off-Page Connector
Flow Line
Annotation
Display
Flowchart Symbols
12. This shape tells you where the flowchart begins and
ends. It shows the entry point of your flowchart and
the exit point. To designate the start of your
flowchart, you would fill this shape with words
like Start or Begin. The words you use are up to you.
To designate the ending point of the chart, this
shape is filled with words like End, Exit,
or Return.
Terminal or Terminator Shape
13. In most flowcharts, the rectangle is the most
common shape. It is used to show a process,
task, action, or operation. It shows something
that has to be done or an action that has to be
taken. The text in the rectangle almost always
includes a verb.
Computational/Process
14. A parallelogram is used to show input or
output. Examples of input are receiving a
report, getting an email, getting an order,
receiving data in some format, etc.
Examples of output are generating a
report, sending an email, etc.
Input or output operation
15. A decision asks a question. The answer to the
question determines which arrow you follow
out of the decision shape. For example, in the
shape below, if it is cloudy, you follow the
arrow down near the word Yes. If it is not
cloudy, you follow the arrow to the right near
the word No.
DECISION
16. The arrows flowing from the decision shape are
usually labeled with Yes, No or True, False.
But you can label them any way you want as
long as the meaning is clear. This shape has
one input arrow. It is usually at the top, but can
be on any corner. The decision shape can
have two or three exit points. If you need more
than 3 exit points, then you can use either of
the methods shown below.
17. A decision asks a question. The answer to the
question determines which arrow you follow
out of the decision shape. For example, in the
shape below, if it is cloudy, you follow the
arrow down near the word Yes. If it is not
cloudy, you follow the arrow to the right near
the word No.
Connector or joining of two parts of
program
18. This shape is supposed to look like a reel
of tape with a small portion of tape
extending from the reel. It represents
magnetic tape storage which is also called
sequential access storage.
Magnetic Tape
19. A cylinder represents a data file or
database. This shape can also represent
the magnetic disc itself. A hard drive is
referred to as direct access storage since
any sector on the drive can be accessed.
A tape is sequential access storage as the
data has to be read sequentially.
Magnetic Disk
20. This shape means the flow continues on
another page. A letter or page number in
the shape tells you where to go. It is an
alternative to using a circle.
Off-Page Connector
21. This shape means the flow continues on
another page. A letter or page number in
the shape tells you where to go. It is an
alternative to using a circle.
Flow Line
22. If two lines cross, you ignore the perpendicular
line and continue following the line to the next
shape. If there may be confusion as to the path,
you can insert a bridge or crossover, which is a
little bump on crossed lines. In RFFlow, you can
insert bridges on crossed lines by clicking
on Tools, Global Changes, and Add
Crossovers.
Flow Line
23. This shape was used to add a comment or
additional descriptive text to a software
flowchart. A dotted line should extend from
the comment to the symbol it references.
This shape is seldom used today.
Annotation/ comment
24. This shape is used to show that the
information is being displayed to the user.
It often refers to the display of a PC.
Display
30. Create a flowchart the ask the user to
enter two number. compute and
display the sum
31. Create a flowchart the ask the user to
enter two number. compute and
display the sum
32. Flowchart on how to determine
the product of two numbers
ALGORITHM
SET Q=0
Get A
Get B
Compute the product of A and B
Print Q
PSEUDOCODE
SET Q=0
Get A
Get B
Q=A*B
PRINT Q
33. Flowchart Development
2. Selection
One of several alternatives is selected
and executed. It involves the use of
decision based on the given condition. It
uses decision block or the diamond-
shaped block. Alternative actions are
represented by the processing block.
34. Flowchart for determining Positive and
Negative Number
Start
INPUT N
N < 0
PRINT “POSITIVE” PRINT “NEGATIVE”
Stop
T
F
Usually a flowchart has one starting point. However, a flowchart can have as many ending points as needed. Sometimes you see this shape drawn as an oval as shown below. That is fine.
Magnetic Disk-This shape depicts a database of any type such as: Microsoft Access, SQL Server, etc. Direct Access Storage. A cylinder represents Direct Access Storage. A hard drive is referred to as direct access storage since any sector on the drive can be accessed.
SET Q=0
Get A
Get B
Compute the product of A and B
Print Q
SET Q=0
Get A
Get B
Q=A*B
PRINT Q
SET Q=0
Get A
Get B
Compute the product of A and B
Print Q
SET Q=0
Get A
Get B
Q=A*B
PRINT Q
SET Q=0
Get A
Get B
Compute the product of A and B
Print Q
SET Q=0
Get A
Get B
Q=A*B
PRINT Q
SET Q=0
Get A
Get B
Compute the product of A and B
Print Q
SET Q=0
Get A
Get B
Q=A*B
PRINT Q
SET Q=0
Get A
Get B
Compute the product of A and B
Print Q
SET Q=0
Get A
Get B
Q=A*B
PRINT Q
SET Q=0
Get A
Get B
Compute the product of A and B
Print Q
SET Q=0
Get A
Get B
Q=A*B
PRINT Q