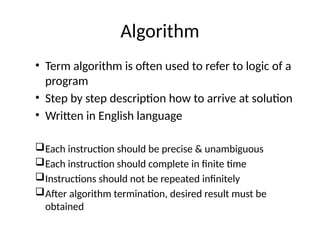
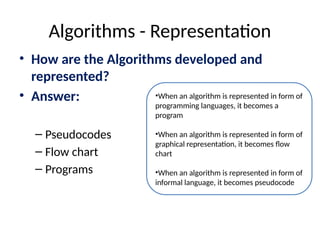
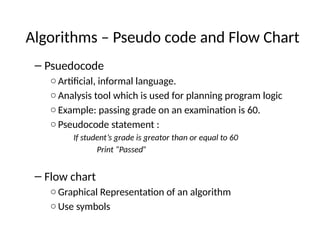
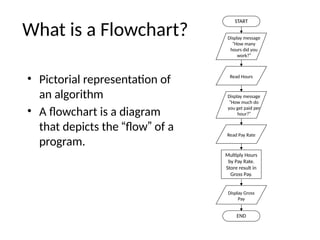
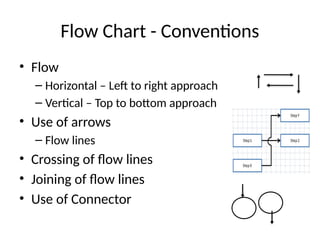
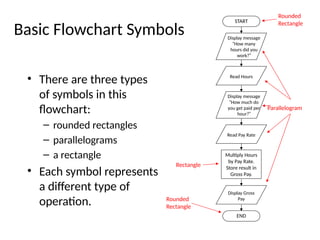
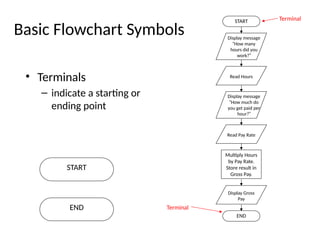
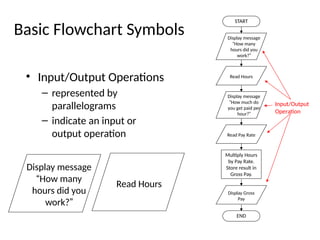
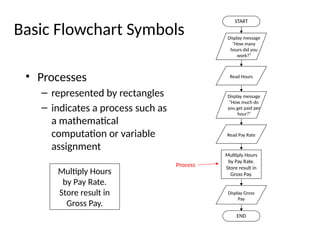
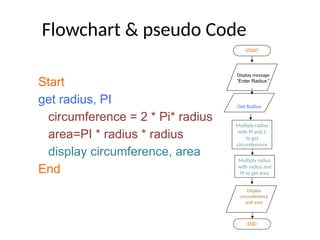
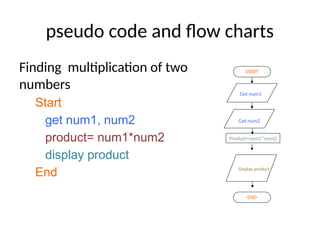
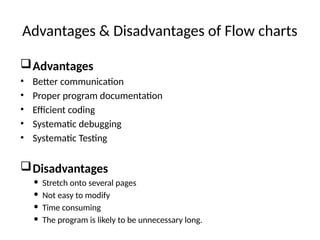
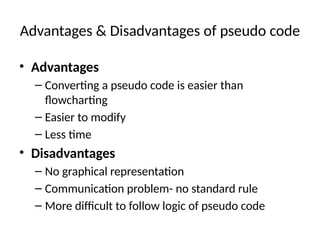
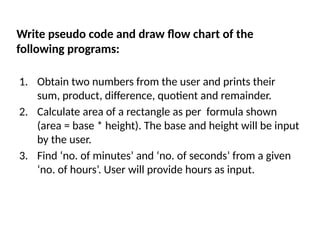
Intro to Computer programming
for data sciences
Algorithm
• Term algorithm is often used to refer to logic of a
program
• Step by step description how to arrive at solution
• Written in English language
Each instruction should be precise & unambiguous
Each instruction should complete in finite time
Instructions should not be repeated infinitely
After algorithm termination, desired result must be
obtained
Algorithms - Representation
• How are the Algorithms developed and
represented?
• Answer:
– Pseudocodes
– Flow chart
– Programs
•When an algorithm is represented in form of
programming languages, it becomes a
program
•When an algorithm is represented in form of
graphical representation, it becomes flow
chart
•When an algorithm is represented in form of
informal language, it becomes pseudocode
Algorithms – Pseudo code and Flow Chart
– Psuedocode
○Artificial, informal language.
○Analysis tool which is used for planning program logic
○Example: passing grade on an examination is 60.
○Pseudocode statement :
If student’s grade is greator than or equal to 60
Print “Passed”
– Flow chart
○Graphical Representation of an algorithm
○Use symbols
What is a Flowchart?
• Pictorial representation of
an algorithm
• A flowchart is a diagram
that depicts the “flow” of a
program.
START
Display message
“How many
hours did you
work?”
Read Hours
Display message
“How much do
you get paid per
hour?”
Read Pay Rate
Multiply Hours
by Pay Rate.
Store result in
Gross Pay.
Display Gross
Pay
END
Flow Chart - Conventions
• Flow
– Horizontal – Left to right approach
– Vertical – Top to bottom approach
• Use of arrows
– Flow lines
• Crossing of flow lines
• Joining of flow lines
• Use of Connector
Basic Flowchart Symbols
• There are three types
of symbols in this
flowchart:
– rounded rectangles
– parallelograms
– a rectangle
• Each symbol represents
a different type of
operation.
START
Display message
“How many
hours did you
work?”
Read Hours
Display message
“How much do
you get paid per
hour?”
Read Pay Rate
Multiply Hours
by Pay Rate.
Store result in
Gross Pay.
Display Gross
Pay
END
Rounded
Rectangle
Parallelogram
Rectangle
Rounded
Rectangle
Basic Flowchart Symbols
• Terminals
– indicate a starting or
ending point
START
Display message
“How many
hours did you
work?”
Read Hours
Display message
“How much do
you get paid per
hour?”
Read Pay Rate
Multiply Hours
by Pay Rate.
Store result in
Gross Pay.
Display Gross
Pay
END
Terminal
START
END Terminal
Basic Flowchart Symbols
• Input/Output Operations
– represented by
parallelograms
– indicate an input or
output operation
START
Display message
“How many
hours did you
work?”
Read Hours
Display message
“How much do
you get paid per
hour?”
Read Pay Rate
Multiply Hours
by Pay Rate.
Store result in
Gross Pay.
Display Gross
Pay
END
Display message
“How many
hours did you
work?”
Read Hours
Input/Output
Operation
Basic Flowchart Symbols
• Processes
– represented by rectangles
– indicates a process such as
a mathematical
computation or variable
assignment
START
Display message
“How many
hours did you
work?”
Read Hours
Display message
“How much do
you get paid per
hour?”
Read Pay Rate
Multiply Hours
by Pay Rate.
Store result in
Gross Pay.
Display Gross
Pay
END
Multiply Hours
by Pay Rate.
Store result in
Gross Pay.
Process
Flowchart & pseudo Code
Start
get radius, PI
circumference = 2 * Pi* radius
area=PI * radius * radius
display circumference, area
End
START
Get Radius
Multiply radius
with PI and 2
to get
circumference
END
Multiply radius
with radius and
PI to get area
Display
circumference
and area
Display message
“Enter Radius:”
pseudo code and flow charts
Finding multiplication of two
numbers
Start
get num1, num2
product= num1*num2
display product
End
START
Get num1
END
Product=num1*num2
Display product
Get num2
Advantages & Disadvantages of Flow charts
Advantages
• Better communication
• Proper program documentation
• Efficient coding
• Systematic debugging
• Systematic Testing
Disadvantages
 Stretch onto several pages
 Not easy to modify
 Time consuming
 The program is likely to be unnecessary long.
Advantages & Disadvantages of pseudo code
• Advantages
– Converting a pseudo code is easier than
flowcharting
– Easier to modify
– Less time
• Disadvantages
– No graphical representation
– Communication problem- no standard rule
– More difficult to follow logic of pseudo code
1. Obtain two numbers from the user and prints their
sum, product, difference, quotient and remainder.
2. Calculate area of a rectangle as per formula shown
(area = base * height). The base and height will be input
by the user.
3. Find ‘no. of minutes’ and ‘no. of seconds’ from a given
‘no. of hours’. User will provide hours as input.
Write pseudo code and draw flow chart of the
following programs:

Introduction to Computer Programming for Data Sciences.pptx

  • 1.
    Intro to Computerprogramming for data sciences
  • 2.
    Algorithm • Term algorithmis often used to refer to logic of a program • Step by step description how to arrive at solution • Written in English language Each instruction should be precise & unambiguous Each instruction should complete in finite time Instructions should not be repeated infinitely After algorithm termination, desired result must be obtained
  • 3.
    Algorithms - Representation •How are the Algorithms developed and represented? • Answer: – Pseudocodes – Flow chart – Programs •When an algorithm is represented in form of programming languages, it becomes a program •When an algorithm is represented in form of graphical representation, it becomes flow chart •When an algorithm is represented in form of informal language, it becomes pseudocode
  • 4.
    Algorithms – Pseudocode and Flow Chart – Psuedocode ○Artificial, informal language. ○Analysis tool which is used for planning program logic ○Example: passing grade on an examination is 60. ○Pseudocode statement : If student’s grade is greator than or equal to 60 Print “Passed” – Flow chart ○Graphical Representation of an algorithm ○Use symbols
  • 5.
    What is aFlowchart? • Pictorial representation of an algorithm • A flowchart is a diagram that depicts the “flow” of a program. START Display message “How many hours did you work?” Read Hours Display message “How much do you get paid per hour?” Read Pay Rate Multiply Hours by Pay Rate. Store result in Gross Pay. Display Gross Pay END
  • 6.
    Flow Chart -Conventions • Flow – Horizontal – Left to right approach – Vertical – Top to bottom approach • Use of arrows – Flow lines • Crossing of flow lines • Joining of flow lines • Use of Connector
  • 7.
    Basic Flowchart Symbols •There are three types of symbols in this flowchart: – rounded rectangles – parallelograms – a rectangle • Each symbol represents a different type of operation. START Display message “How many hours did you work?” Read Hours Display message “How much do you get paid per hour?” Read Pay Rate Multiply Hours by Pay Rate. Store result in Gross Pay. Display Gross Pay END Rounded Rectangle Parallelogram Rectangle Rounded Rectangle
  • 8.
    Basic Flowchart Symbols •Terminals – indicate a starting or ending point START Display message “How many hours did you work?” Read Hours Display message “How much do you get paid per hour?” Read Pay Rate Multiply Hours by Pay Rate. Store result in Gross Pay. Display Gross Pay END Terminal START END Terminal
  • 9.
    Basic Flowchart Symbols •Input/Output Operations – represented by parallelograms – indicate an input or output operation START Display message “How many hours did you work?” Read Hours Display message “How much do you get paid per hour?” Read Pay Rate Multiply Hours by Pay Rate. Store result in Gross Pay. Display Gross Pay END Display message “How many hours did you work?” Read Hours Input/Output Operation
  • 10.
    Basic Flowchart Symbols •Processes – represented by rectangles – indicates a process such as a mathematical computation or variable assignment START Display message “How many hours did you work?” Read Hours Display message “How much do you get paid per hour?” Read Pay Rate Multiply Hours by Pay Rate. Store result in Gross Pay. Display Gross Pay END Multiply Hours by Pay Rate. Store result in Gross Pay. Process
  • 11.
    Flowchart & pseudoCode Start get radius, PI circumference = 2 * Pi* radius area=PI * radius * radius display circumference, area End START Get Radius Multiply radius with PI and 2 to get circumference END Multiply radius with radius and PI to get area Display circumference and area Display message “Enter Radius:”
  • 12.
    pseudo code andflow charts Finding multiplication of two numbers Start get num1, num2 product= num1*num2 display product End START Get num1 END Product=num1*num2 Display product Get num2
  • 13.
    Advantages & Disadvantagesof Flow charts Advantages • Better communication • Proper program documentation • Efficient coding • Systematic debugging • Systematic Testing Disadvantages  Stretch onto several pages  Not easy to modify  Time consuming  The program is likely to be unnecessary long.
  • 14.
    Advantages & Disadvantagesof pseudo code • Advantages – Converting a pseudo code is easier than flowcharting – Easier to modify – Less time • Disadvantages – No graphical representation – Communication problem- no standard rule – More difficult to follow logic of pseudo code
  • 15.
    1. Obtain twonumbers from the user and prints their sum, product, difference, quotient and remainder. 2. Calculate area of a rectangle as per formula shown (area = base * height). The base and height will be input by the user. 3. Find ‘no. of minutes’ and ‘no. of seconds’ from a given ‘no. of hours’. User will provide hours as input. Write pseudo code and draw flow chart of the following programs: