Downloaded 24 times
![Action Learning Project: Learnings
• Key questions we want to answer through the data:
• Registration
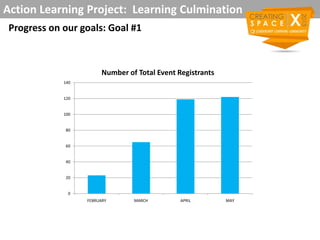
• What were the monthly trends?
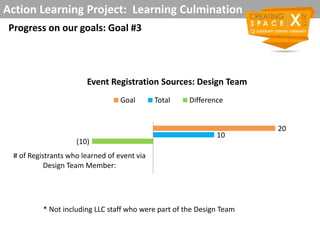
• Goal vs. Target (percent)
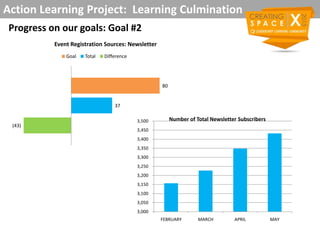
• Sources
• How did the participants learn about Creating Space? (newsletter, etc)
• Review registration form
• Review bit.ly data
• How effective was the influencer strategy for getting registrations?
• Review registration form
• Engagement
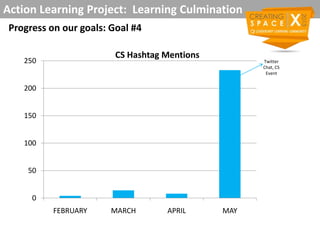
• How effective was the Twitter chat in engaging the community around
the conference?
• Review Twitter chat metrics around participants, messaging, role
of influencers
• How effective was Twitter in helping promote the event?
• Mentions/retweets metrics
• Themes? [Include sample tweets to represent content]](https://image.slidesharecdn.com/actionlearningprojectfinalmeetingslidesv11-130624164819-phpapp02/85/Action-Learning-Project-Culmination-Presentation-8-320.jpg)
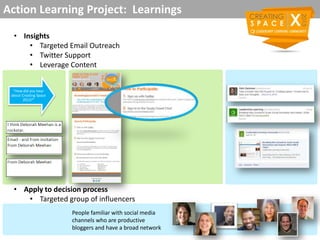
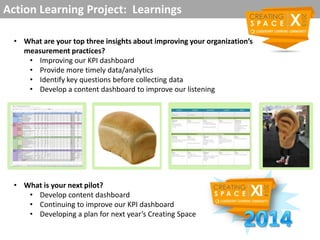

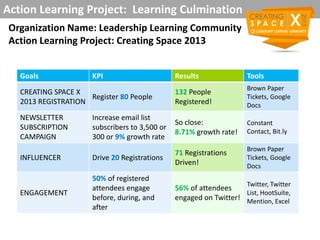
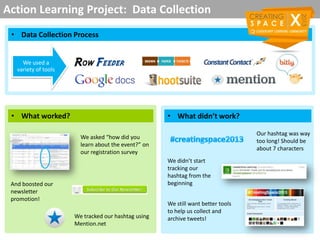
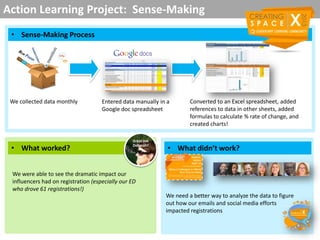
This document summarizes an action learning project done by the Leadership Learning Community to plan and run the Creating Space 2013 event. It discusses the goals, key performance indicators, results, and tools used. The project exceeded its registration and engagement goals. Insights from analyzing the data include the effectiveness of targeted email outreach, social media support like Twitter, and leveraging influencers. Areas for improvement include timely data collection and analysis to better understand the impact of promotional activities. The next steps proposed are developing content and KPI dashboards to improve measurement practices.