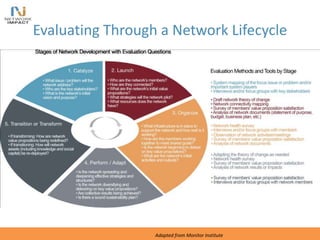
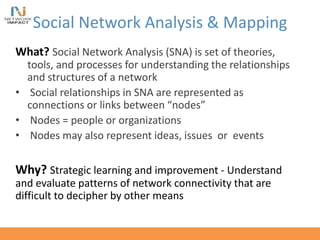
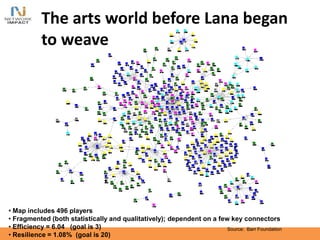
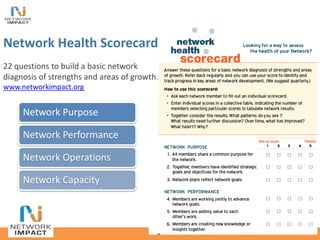
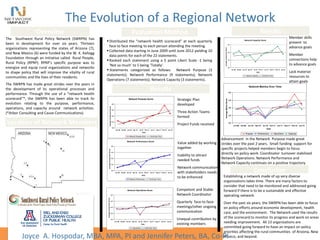
JULY | 2015
@leadershipera #leadershipnet
Strengthening Network Practice Through Evaluation
Presented by: Madeleine Taylor and Anne Whatley
LLC anticipates the future and is a dynamic
catalyst capable of creating a link from today’s
issues in leadership development to tomorrow’s
solutions.
(Donna Stark, The Annie E. Casey Foundation)
Network Research Application
LEADERSHIP LEARNING COMMUNITY
LEADERSHIP FOR A NEW ERA
The value of collective leadership networks is in their capacity
to solve problems quickly in an environment of uncertainty and complexity
(Watts, 2004)
Newest Publication
Strengthening Network Practice Through
Evaluation
Presented by:
• Madeleine Taylor, Founder and CEO at Network Impact
• Anne Whatley, Senior Consultant at Network Impact
TODAY’S PRESENTERS
Network Impact serves social-change agents with a mix of strategies, tools, research, and consulting
expertise to design and use networks for increased impact www.networkimpact.org
Strengthening Network Practice Through
Evaluation
July 15, 2015
Intros
The voices you are hearing
Madeleine Taylor
Anne Whatley
Intended Audience
• Changemakers who are or are considering using a network approach
to address a social challenge
What do we know
about how to develop
and grow effective
networks for change?
Why a Network?
Networks provide social change agents with a
fundamentally distinct and remarkably promising
“organizing principle” to achieve ambitious
goals.
Net Gains 2006
Network Advantage
•ACCESS
•LEARNING
•LEVERAGE
•RESILIENCE
Network Building is a Practice
• Network Start Up
• Network Management
– Governance
– Coordination
– Communications
– Financial Stewardship
– Network Health
• Network Monitoring and
Evaluation
About Network Impact
•We serve social-change agents with a mix of
strategies, tools, research, and consulting expertise
to design and use networks for increased impact
Research & Tools: Clients include:
Why are you here?
• What questions
do you have?
• What would you
like to hear
about today?
• Please enter
questions into
the chat. (or
raise your hand )
With our time today…
• Network basics
• What makes a network thrive?
• Network evaluation framework
• Tools & Approaches to assess network
process and results
13
Anatomy of a Network
Core
Link Node
Cluster
Periphery
Hub
Illustration from Social Networks for Social Change, Monitor Institute 2010
Many specialized terms
come from Social Network
Analysis (SNA)
Generative Networks
Base of Connections
Members deliberately build,
strengthen, and maintain ties
so they can be activated
again and again
Coalitions:
Can be more or less
formal, but are formed
at particular historical
moments focused on
specific objectives.
Often dissolve when the
job is over (win or loss)
Evolution of Network Functions
Action
Alignment
Connectivity
Build stronger connections
and trust: Share
knowledge; Create new
knowledge systems and
resource channels; Develop
understanding of systems
targeted for change
Align around common
goals, values and
standards
Engage in joint action for
specific outcomes
Base of Connections
Network Functions
Connectivity Alignment Action
Membership All comers
No eligibility rules
No “barriers” (e.g., fees)
Some eligibility rules
Few “barriers” (e.g., fees)
Invitation only
Stricter eligibility rules
Key task of
network
“builder”
Weaving – help people
meet each other, increase
ease of sharing and
searching for information
Facilitating – helping
people to explore potential
shared identity and value
propositions
Coordinating – helping
people plan and
implement
collaborative actions
Enabling
Infrastructure
Web platform with
networking tools for
communications,
documents
Capacity to analyze,
compare, and synthesize
frameworks, definitions,
etc.
• Project
management and
project budgeting
capacity
• Performance
accountability
mechanisms
Think about a
network you are
participating in
What conditions
helped make it
thrive?
• Value
• Trust
• Participation
• Communication
• Stewardship
• Learning & Evolving
Conditions that make a network thrive
include…
Network Evaluation
Purposes & Benefits
NETWORK STRATEGY
Support strategic learning and
continuous improvement.
ImpactInterim Outcomes
Examine network results or impact.
Ensure accountability for the use of resources.
Characteristics of Networks
that Matter for Evaluation
• Networks have numerous players, many of whom
enter and exit the network
• Networks are dynamic “moving targets” that adapt
to changes in their context or changes among their
membership
• It takes time to organize networks effectively and
show results
• Networks have a “chain of impact”
• Network shape and function matter
Network Dimensions
Connectivity
• What can be
monitored:
• Membership or the
people or organizations
that participate in
a network
• Structure or how
connections between
members are structured
and what flows
through those
connections
Health
• Resources or the
material resources a
network needs to
sustain itself (e.g.,
external funding)
• Infrastructure or the
internal systems and
structures that support
the network (e.g.,
communication,
rules and processes)
• Advantage or the
network’s capacity for
joint value creation
Results
• Interim outcomes or
the results achieved as
the network works
toward its ultimate goal
or intended impact
• The goal or intended
impact itself (e.g., a
policy outcome was
achieved, a particular
practice was spread,
the community or its
members changed in a
certain way).
Evaluating Through a Network Lifecycle
Adapted from Monitor Institute
Social Network Analysis & Mapping
What? Social Network Analysis (SNA) is set of theories,
tools, and processes for understanding the relationships
and structures of a network
• Social relationships in SNA are represented as
connections or links between “nodes”
• Nodes = people or organizations
• Nodes may also represent ideas, issues or events
Why? Strategic learning and improvement - Understand
and evaluate patterns of network connectivity that are
difficult to decipher by other means
SNA answers questions like:
• Who is connected to whom and how? Who is not
connected but should be?
• Has the network assembled members with the
capacities needed to meet network goals
(experience, skills, connections)?
• What is flowing through the network—information
and other resources?
The arts world before Lana began
to weave
• Map includes 496 players
• Fragmented (both statistically and qualitatively); dependent on a few key connectors
• Efficiency = 6.04 (goal is 3)
• Resilience = 1.08% (goal is 20)
Source: Barr Foundation
Purposeful approach to enhancing the network
Also (more dispersed on map):
• Arts and sports showcase
• Curriculum development initiative
Community Dance Studio
Outreach Departments –
Visual Arts Colleges
Hyde Park Arts Initiative
Facilities Group Convening
Source: Barr Foundation
Network Mapping to Show Changes Over
Time
2010
2011
Year # Density Avg #
ties
2009 55 2.2% 1.2
2010 90 2.7% 2.4
2011 85 5.3% 4.5
2012 82 8% 6.88
2009
2012
CARN
GPRPN
MRN
MSN
NARP
NURV
SWPRN
Rural Assembly SC
Geographic Distribution of CARN connections to
members of RPNs before WKKF grant (2006-2008)
CARN
GPRPN
MRN
MSN
NARP
NURV
SWPRN
Rural Assembly SC
Geographic Distribution of CARN connections to
members of RPNs in March 2013
Measuring Cross-sector Connections
Over Time
1
2
3
4
5
6
7
8
9
10
11
12
13
14
15
16
17
18
19
20
21
22
23
24
25
26
27
28
29
30
31
32
33
34
2005
Maps copyright © 2012 New Directions CollaborativeSource: Boston Green & Healthy Building Network, Beth Tener and Al Nierenberg, January 2008
1
2
3
4
5
6
7
8
9
10
11
12
13
14
15
16
17
18
19
20
21
22
23
24
25
26
27
28
29
30
31
32
33
34
2007
What is flowing between nodes?
•Durfee Foundation Stanton Fellowship awards
two year grants to social change leaders in LA
to think deeply and tease out solutions to
intractable problems.
Before & After Led to New Thinking
• Greatest increase, >300%,
connections that provided
“information that led to new
thinking or framing that has
been useful...”
Did not respond to survey
Name was not available on survey
n=27
Degree of connectivity
Post-Fellowship Connections By Cohort
• High level of
connectivity
between
cohorts
• On average
70% of Fellows'
connections
were with
Fellows from
other cohorts.
Nodes sized by In-Degree and colored by type,
Edges colored by fellow’s first or second priority
Did not respond to survey
n=27
Stanton Fellows and Priority Focus Areas
Resources
• NodeXL : a free network mapping software that
works within Microsoft Excel
• Netdraw and UCINET: used by academics, free but
a little harder to use
• Gephi : open source, no cost network visualization
tool, tutorials
• Kumu.io : new, easy-to-use web-based tool, free to
use if save map publically.
Network Health Monitoring Tools
What? Internal temperature check, insights into key
dimensions of network
Why?
• Clarify organizing principles that are fundamental to
network development
• Provide practitioners with an overview of network
conditions to inform internal adjustments
• Help guide technical assistance and professional
development opportunities
• Triangulate other evaluation data
Network Health tools answer
questions like:
• What are strengths and areas of growth for
our network?
• Where are members seeing value?
• What are the top priorities for members?
38
Network Health Scorecard
22 questions to build a basic network
diagnosis of strengths and areas of growth.
www.networkimpact.org
Network Purpose
Network Performance
Network Operations
Network Capacity
Example: Southwest Rural Policy Network
Distributed the “network
health scorecard” quarterly
over 3 years.
Has been able to track its
evolution relating to the
purpose, performance,
operations, and capacity
around network activities.
Network Metrics Over Time
3.0
3.5
4.0
4.5
5.0
Jun-09 Oct-09 Jan-10 Apr-10 Jul-10 Feb-11 Jun-11 Sep-11 Feb-12 Jun-12
Date
AverageMetricScore
Purpose Performance Operations Capacity
The Evolution of a Regional Network
The Southwest Rural Policy Network (SWRPN) has
been in development for over six years. Thirteen
organizations representing the states of Arizona (7),
and New Mexico (6) were funded by the W. K. Kellogg
Foundation through an initiative called Rural People,
Rural Policy (RPRP). RPRP’s specific purpose was to
energize and equip rural organizations and networks
to shape policy that will improve the vitality of rural
communities and the lives of their residents.
The SWRPN has made great strides over the years in
the development of its operational processes and
performance. Through the use of a “network health
scorecard”*, the SWRPN has been able to track its
evolution relating to the purpose, performance,
operations, and capacity around network activities.
(*Arbor Consulting and Cause Communications)
:
Overview
Location of Network Members
Results
Conclusion
Results
Evaluation Method
Establishing a network made of up very diverse
organizations takes time. There are many factors to
consider that need to be monitored and addressed going
forward if there is to be a sustainable and effective
operating network.
Over the past six years, the SWRPN has been able to focus
on policy efforts around economic development, health
care, and the environment. The Network used the results
of the scorecard to monitor its progress and work on areas
needing improvement. All 13 organizations are
committed going forward to have an impact on policy
priorities affecting the rural communities of Arizona, New
Mexico, and beyond.
Network Purpose Score
3.0
3.5
4.0
4.5
5.0
Jun-09 Oct-09 Jan-10 Apr-10 Jul-10 Feb-11 Jun-11 Sep-11 Feb-12 Jun-12
Date
AverageComponentScore
Network Purpose Score Trend Over Time
Network Performance Score
3.0
3.5
4.0
4.5
5.0
Jun-09 Oct-09 Jan-10 Apr-10 Jul-10 Feb-11 Jun-11 Sep-11 Feb-12 Jun-12
Date
AverageComponentScore
Network Performance Trend Over Time
Network Operations Score
3.0
3.5
4.0
4.5
5.0
Jun-09 Oct-09 Jan-10 Apr-10 Jul-10 Feb-11 Jun-11 Sep-11 Feb-12 Jun-12
Date
AverageComponentScore
Operations Trend Over Time
Network Capacity Score
3.0
3.5
4.0
4.5
Jun-09 Oct-09 Jan-10 Apr-10 Jul-10 Feb-11 Jun-11 Sep-11 Feb-12 Jun-12
Date
AverageComponentScore
Network Capacity Trend Over Time
Network Metrics Over Time
3.0
3.5
4.0
4.5
5.0
Jun-09 Oct-09 Jan-10 Apr-10 Jul-10 Feb-11 Jun-11 Sep-11 Feb-12 Jun-12
Date
AverageMetricScore
Purpose Performance Operations Capacity
Strategic Plan
developed
Three Action Teams
formed
Project Funds received
Value added by working
together
Inability to attract
needed funds
Network communication
with stakeholders needs
to be enhanced
Competent and Stable
Network Coordinator
Quarterly face-to face-
meetings/other ongoing
communication
Unequal contribution by
existing members
Member skills
present to
advance goals
Member
connections help
to advance goals
Lack material
resources to
attain goals
Advancement in the Network Purpose made great
strides over the past 2 years. Small funding support for
specific projects helped members begin to focus
directly on policy work. Coordinator turnover stabilized
Network Operations. Network Performance and
Network Capacity continues on a positive trajectory.
 Distributed the “network health scorecard” at each quarterly
face to face meeting to each person attending the meeting.
 Collected data starting in June 2009 until June 2012 yielding 10
data points for each of the 22 statements.
 Ranked each statement using a 5 point Likert Scale -1 being
‘Not so much’ to 5 being ‘Totally’.
 Statements categorized as follows: Network Purpose (3
statements); Network Performance (9 statements); Network
Operations (7 statements); Network Capacity (3 statements).
Joyce A. Hospodar, MBA, MPA, PI and Jennifer Peters, BA, Co-PI
Resources
• ConnectingtoChangetheWorld.net
• Network Evaluation Guide – Network Impact
• Network Health Scorecard – Network Impact
• Network Diagnostic – Monitor Group
• Guide to Assessing Collective Impact - FSG
43
Questions?
GET INVOLVED
Register for the LLC
Newsletter, then contribute
your writing to our blog!
Blog info@LeadershipLearning.orgblog
Register LeadershipLearning.org
SUPPORT THE WEBINAR SERIES
The suggested donation for this webinar is $30.
bit.ly/LLCDonate2013
Donate Today!
LLC THANKS YOU!

Strengthening Network Practice Through Evaluation

  • 1.
    JULY | 2015 @leadershipera#leadershipnet Strengthening Network Practice Through Evaluation Presented by: Madeleine Taylor and Anne Whatley
  • 2.
    LLC anticipates thefuture and is a dynamic catalyst capable of creating a link from today’s issues in leadership development to tomorrow’s solutions. (Donna Stark, The Annie E. Casey Foundation) Network Research Application LEADERSHIP LEARNING COMMUNITY
  • 3.
    LEADERSHIP FOR ANEW ERA The value of collective leadership networks is in their capacity to solve problems quickly in an environment of uncertainty and complexity (Watts, 2004) Newest Publication
  • 4.
    Strengthening Network PracticeThrough Evaluation Presented by: • Madeleine Taylor, Founder and CEO at Network Impact • Anne Whatley, Senior Consultant at Network Impact TODAY’S PRESENTERS
  • 5.
    Network Impact servessocial-change agents with a mix of strategies, tools, research, and consulting expertise to design and use networks for increased impact www.networkimpact.org Strengthening Network Practice Through Evaluation July 15, 2015
  • 6.
    Intros The voices youare hearing Madeleine Taylor Anne Whatley
  • 7.
    Intended Audience • Changemakerswho are or are considering using a network approach to address a social challenge What do we know about how to develop and grow effective networks for change?
  • 8.
    Why a Network? Networksprovide social change agents with a fundamentally distinct and remarkably promising “organizing principle” to achieve ambitious goals. Net Gains 2006
  • 9.
  • 10.
    Network Building isa Practice • Network Start Up • Network Management – Governance – Coordination – Communications – Financial Stewardship – Network Health • Network Monitoring and Evaluation
  • 11.
    About Network Impact •Weserve social-change agents with a mix of strategies, tools, research, and consulting expertise to design and use networks for increased impact Research & Tools: Clients include:
  • 12.
    Why are youhere? • What questions do you have? • What would you like to hear about today? • Please enter questions into the chat. (or raise your hand )
  • 13.
    With our timetoday… • Network basics • What makes a network thrive? • Network evaluation framework • Tools & Approaches to assess network process and results 13
  • 14.
    Anatomy of aNetwork Core Link Node Cluster Periphery Hub Illustration from Social Networks for Social Change, Monitor Institute 2010 Many specialized terms come from Social Network Analysis (SNA)
  • 15.
    Generative Networks Base ofConnections Members deliberately build, strengthen, and maintain ties so they can be activated again and again Coalitions: Can be more or less formal, but are formed at particular historical moments focused on specific objectives. Often dissolve when the job is over (win or loss)
  • 16.
    Evolution of NetworkFunctions Action Alignment Connectivity Build stronger connections and trust: Share knowledge; Create new knowledge systems and resource channels; Develop understanding of systems targeted for change Align around common goals, values and standards Engage in joint action for specific outcomes Base of Connections
  • 17.
    Network Functions Connectivity AlignmentAction Membership All comers No eligibility rules No “barriers” (e.g., fees) Some eligibility rules Few “barriers” (e.g., fees) Invitation only Stricter eligibility rules Key task of network “builder” Weaving – help people meet each other, increase ease of sharing and searching for information Facilitating – helping people to explore potential shared identity and value propositions Coordinating – helping people plan and implement collaborative actions Enabling Infrastructure Web platform with networking tools for communications, documents Capacity to analyze, compare, and synthesize frameworks, definitions, etc. • Project management and project budgeting capacity • Performance accountability mechanisms
  • 18.
    Think about a networkyou are participating in What conditions helped make it thrive?
  • 19.
    • Value • Trust •Participation • Communication • Stewardship • Learning & Evolving Conditions that make a network thrive include…
  • 20.
    Network Evaluation Purposes &Benefits NETWORK STRATEGY Support strategic learning and continuous improvement. ImpactInterim Outcomes Examine network results or impact. Ensure accountability for the use of resources.
  • 21.
    Characteristics of Networks thatMatter for Evaluation • Networks have numerous players, many of whom enter and exit the network • Networks are dynamic “moving targets” that adapt to changes in their context or changes among their membership • It takes time to organize networks effectively and show results • Networks have a “chain of impact” • Network shape and function matter
  • 22.
    Network Dimensions Connectivity • Whatcan be monitored: • Membership or the people or organizations that participate in a network • Structure or how connections between members are structured and what flows through those connections Health • Resources or the material resources a network needs to sustain itself (e.g., external funding) • Infrastructure or the internal systems and structures that support the network (e.g., communication, rules and processes) • Advantage or the network’s capacity for joint value creation Results • Interim outcomes or the results achieved as the network works toward its ultimate goal or intended impact • The goal or intended impact itself (e.g., a policy outcome was achieved, a particular practice was spread, the community or its members changed in a certain way).
  • 23.
    Evaluating Through aNetwork Lifecycle Adapted from Monitor Institute
  • 24.
    Social Network Analysis& Mapping What? Social Network Analysis (SNA) is set of theories, tools, and processes for understanding the relationships and structures of a network • Social relationships in SNA are represented as connections or links between “nodes” • Nodes = people or organizations • Nodes may also represent ideas, issues or events Why? Strategic learning and improvement - Understand and evaluate patterns of network connectivity that are difficult to decipher by other means
  • 25.
    SNA answers questionslike: • Who is connected to whom and how? Who is not connected but should be? • Has the network assembled members with the capacities needed to meet network goals (experience, skills, connections)? • What is flowing through the network—information and other resources?
  • 26.
    The arts worldbefore Lana began to weave • Map includes 496 players • Fragmented (both statistically and qualitatively); dependent on a few key connectors • Efficiency = 6.04 (goal is 3) • Resilience = 1.08% (goal is 20) Source: Barr Foundation
  • 27.
    Purposeful approach toenhancing the network Also (more dispersed on map): • Arts and sports showcase • Curriculum development initiative Community Dance Studio Outreach Departments – Visual Arts Colleges Hyde Park Arts Initiative Facilities Group Convening Source: Barr Foundation
  • 28.
    Network Mapping toShow Changes Over Time 2010 2011 Year # Density Avg # ties 2009 55 2.2% 1.2 2010 90 2.7% 2.4 2011 85 5.3% 4.5 2012 82 8% 6.88 2009 2012
  • 29.
    CARN GPRPN MRN MSN NARP NURV SWPRN Rural Assembly SC GeographicDistribution of CARN connections to members of RPNs before WKKF grant (2006-2008)
  • 30.
    CARN GPRPN MRN MSN NARP NURV SWPRN Rural Assembly SC GeographicDistribution of CARN connections to members of RPNs in March 2013
  • 31.
    Measuring Cross-sector Connections OverTime 1 2 3 4 5 6 7 8 9 10 11 12 13 14 15 16 17 18 19 20 21 22 23 24 25 26 27 28 29 30 31 32 33 34 2005 Maps copyright © 2012 New Directions CollaborativeSource: Boston Green & Healthy Building Network, Beth Tener and Al Nierenberg, January 2008 1 2 3 4 5 6 7 8 9 10 11 12 13 14 15 16 17 18 19 20 21 22 23 24 25 26 27 28 29 30 31 32 33 34 2007
  • 32.
    What is flowingbetween nodes? •Durfee Foundation Stanton Fellowship awards two year grants to social change leaders in LA to think deeply and tease out solutions to intractable problems.
  • 33.
    Before & AfterLed to New Thinking • Greatest increase, >300%, connections that provided “information that led to new thinking or framing that has been useful...” Did not respond to survey Name was not available on survey n=27 Degree of connectivity
  • 34.
    Post-Fellowship Connections ByCohort • High level of connectivity between cohorts • On average 70% of Fellows' connections were with Fellows from other cohorts.
  • 35.
    Nodes sized byIn-Degree and colored by type, Edges colored by fellow’s first or second priority Did not respond to survey n=27 Stanton Fellows and Priority Focus Areas
  • 36.
    Resources • NodeXL :a free network mapping software that works within Microsoft Excel • Netdraw and UCINET: used by academics, free but a little harder to use • Gephi : open source, no cost network visualization tool, tutorials • Kumu.io : new, easy-to-use web-based tool, free to use if save map publically.
  • 37.
    Network Health MonitoringTools What? Internal temperature check, insights into key dimensions of network Why? • Clarify organizing principles that are fundamental to network development • Provide practitioners with an overview of network conditions to inform internal adjustments • Help guide technical assistance and professional development opportunities • Triangulate other evaluation data
  • 38.
    Network Health toolsanswer questions like: • What are strengths and areas of growth for our network? • Where are members seeing value? • What are the top priorities for members? 38
  • 40.
    Network Health Scorecard 22questions to build a basic network diagnosis of strengths and areas of growth. www.networkimpact.org Network Purpose Network Performance Network Operations Network Capacity
  • 41.
    Example: Southwest RuralPolicy Network Distributed the “network health scorecard” quarterly over 3 years. Has been able to track its evolution relating to the purpose, performance, operations, and capacity around network activities. Network Metrics Over Time 3.0 3.5 4.0 4.5 5.0 Jun-09 Oct-09 Jan-10 Apr-10 Jul-10 Feb-11 Jun-11 Sep-11 Feb-12 Jun-12 Date AverageMetricScore Purpose Performance Operations Capacity
  • 42.
    The Evolution ofa Regional Network The Southwest Rural Policy Network (SWRPN) has been in development for over six years. Thirteen organizations representing the states of Arizona (7), and New Mexico (6) were funded by the W. K. Kellogg Foundation through an initiative called Rural People, Rural Policy (RPRP). RPRP’s specific purpose was to energize and equip rural organizations and networks to shape policy that will improve the vitality of rural communities and the lives of their residents. The SWRPN has made great strides over the years in the development of its operational processes and performance. Through the use of a “network health scorecard”*, the SWRPN has been able to track its evolution relating to the purpose, performance, operations, and capacity around network activities. (*Arbor Consulting and Cause Communications) : Overview Location of Network Members Results Conclusion Results Evaluation Method Establishing a network made of up very diverse organizations takes time. There are many factors to consider that need to be monitored and addressed going forward if there is to be a sustainable and effective operating network. Over the past six years, the SWRPN has been able to focus on policy efforts around economic development, health care, and the environment. The Network used the results of the scorecard to monitor its progress and work on areas needing improvement. All 13 organizations are committed going forward to have an impact on policy priorities affecting the rural communities of Arizona, New Mexico, and beyond. Network Purpose Score 3.0 3.5 4.0 4.5 5.0 Jun-09 Oct-09 Jan-10 Apr-10 Jul-10 Feb-11 Jun-11 Sep-11 Feb-12 Jun-12 Date AverageComponentScore Network Purpose Score Trend Over Time Network Performance Score 3.0 3.5 4.0 4.5 5.0 Jun-09 Oct-09 Jan-10 Apr-10 Jul-10 Feb-11 Jun-11 Sep-11 Feb-12 Jun-12 Date AverageComponentScore Network Performance Trend Over Time Network Operations Score 3.0 3.5 4.0 4.5 5.0 Jun-09 Oct-09 Jan-10 Apr-10 Jul-10 Feb-11 Jun-11 Sep-11 Feb-12 Jun-12 Date AverageComponentScore Operations Trend Over Time Network Capacity Score 3.0 3.5 4.0 4.5 Jun-09 Oct-09 Jan-10 Apr-10 Jul-10 Feb-11 Jun-11 Sep-11 Feb-12 Jun-12 Date AverageComponentScore Network Capacity Trend Over Time Network Metrics Over Time 3.0 3.5 4.0 4.5 5.0 Jun-09 Oct-09 Jan-10 Apr-10 Jul-10 Feb-11 Jun-11 Sep-11 Feb-12 Jun-12 Date AverageMetricScore Purpose Performance Operations Capacity Strategic Plan developed Three Action Teams formed Project Funds received Value added by working together Inability to attract needed funds Network communication with stakeholders needs to be enhanced Competent and Stable Network Coordinator Quarterly face-to face- meetings/other ongoing communication Unequal contribution by existing members Member skills present to advance goals Member connections help to advance goals Lack material resources to attain goals Advancement in the Network Purpose made great strides over the past 2 years. Small funding support for specific projects helped members begin to focus directly on policy work. Coordinator turnover stabilized Network Operations. Network Performance and Network Capacity continues on a positive trajectory.  Distributed the “network health scorecard” at each quarterly face to face meeting to each person attending the meeting.  Collected data starting in June 2009 until June 2012 yielding 10 data points for each of the 22 statements.  Ranked each statement using a 5 point Likert Scale -1 being ‘Not so much’ to 5 being ‘Totally’.  Statements categorized as follows: Network Purpose (3 statements); Network Performance (9 statements); Network Operations (7 statements); Network Capacity (3 statements). Joyce A. Hospodar, MBA, MPA, PI and Jennifer Peters, BA, Co-PI
  • 43.
    Resources • ConnectingtoChangetheWorld.net • NetworkEvaluation Guide – Network Impact • Network Health Scorecard – Network Impact • Network Diagnostic – Monitor Group • Guide to Assessing Collective Impact - FSG 43
  • 44.
  • 45.
    GET INVOLVED Register forthe LLC Newsletter, then contribute your writing to our blog! Blog info@LeadershipLearning.orgblog Register LeadershipLearning.org
  • 46.
    SUPPORT THE WEBINARSERIES The suggested donation for this webinar is $30. bit.ly/LLCDonate2013 Donate Today! LLC THANKS YOU!