Downloaded 13 times
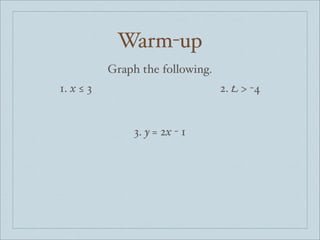
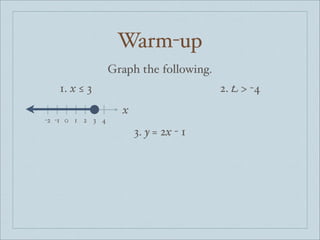
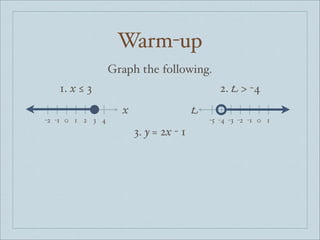
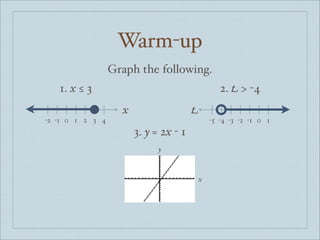


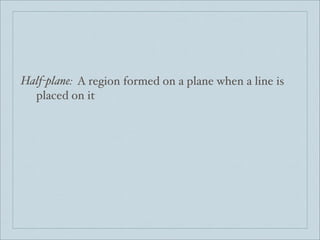
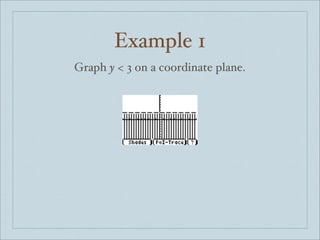
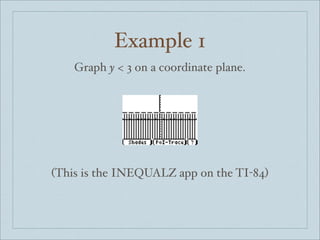
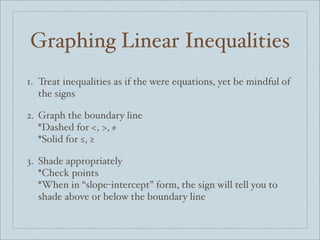
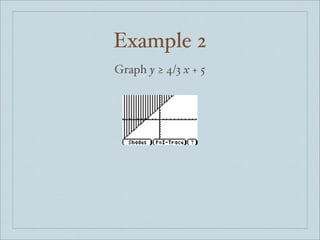
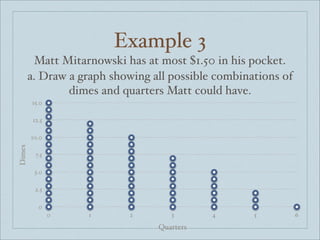


This document discusses graphing inequalities in the coordinate plane. It begins with examples of graphing simple inequalities like x ≤ 3 and t > -4. It then defines half-planes and boundaries for inequalities. Examples are given for graphing linear inequalities like y < 3 and y ≥ 4/3x + 5, including using dashed vs solid boundary lines and shading regions appropriately. The document also discusses lattice points and includes an example of graphing all possible combinations of quarters and dimes that could equal $1.50 or less. It concludes with assigning homework problems.