This document presents a model integration framework for assessing surface and subsurface water interaction. The framework couples the Soil and Water Assessment Tool (SWAT) hydrologic model with the MODFLOW groundwater model (SWAT-MODFLOW) to simulate the interaction between surface water and groundwater. It describes the components of the framework, including the SWAT and MODFLOW models, interfaces for coupling the models, and tools for pre- and post-processing. The framework is demonstrated through an application to the Fort Cobb Reservoir Experimental Watershed in Oklahoma.
Solar ghosts: Weighing the evidence for sunspot cycles in fossil treesScott St. George
In their study of tree rings from the Chemnitz Fossil Forest (Germany), Luthardt and Rößler (2017) claim to identify a regular near-11-yr cyclicity in growth, and present that pattern as evidence of the influence of the Schwabe solar cycle (Usokin and Mursula, 2003) on climate and forest productivity during the early Permian. If correctly interpreted, these fossil tree rings would indicate the sunspot cycle was the dominant influence on interannual variability in Earth’s climate during this period and that it has been a consistent aspect of our Sun’s behavior for at least the past 300 m.y. We argue the fossil tree-ring record from Chemnitz does not constitute reliable evidence of solar activity during the Permian because the individual tree-ring sequences are not correctly aligned (dendrochronologically dated) and, as a result, the mean ring-width composite is not a meaningful estimate of year-to-year variations in tree growth in this ancient forest.
The need for new theory in global dendroclimatologyScott St. George
So much of what we know about the Earth’s climate during the past two millennia comes from tree rings. Information gleaned from the physical or chemical properties of growth rings in trees have allowed us to extend hemispheric-scale temperature records back by several centuries, construct annual maps of drought severity that span several continents, and generate proxy estimates for many of the leading modes within the climate system. The theoretical foundation that underpins these products — and most others in dendroclimatology — was fully mature by the early 1990s and set out in detail by Cook and Kairiukstis in their seminal book, ‘Methods in Dendrochronology’. Most of the core analytical methods used to infer past climate from tree rings that appear in this reference (as well as prior works) depend on two concepts in particular: first, the idea that patterns common to many trees at many sites are more likely to be related to synoptic-scale climate variability (the principle of replication), and second, the notion that the most useful tree-ring records are found in forests where growth is particularly sensitive to a specific aspect of local climate (the principle of site selection). But because of (i) the gradual expansion, extension, and in-filling of the global tree-ring network and (ii) the emphasis given to atypical or even unique site-specific signals by some novel reconstruction methods, it is a point of debate within our community, at least implicitly, whether these principles remain valid. This presentation will review several recent studies that illustrate the possible advantages offered by a disregard for the usual ‘rules’ of dendroclimatology but will also discuss the potential pitfalls of placing too much emphasis on apparently optimal records. We hope this talk will encourage the sharing of ideas on how best to extract climate information from the ever-expanding network of tree-ring records across our planet and help open a discussion on the relevance of our standard theoretical framework to contemporary global dendroclimatology.
Strong variance at decadal and multidecadal timescales is a common feature of most tree-ring width records. But does this aspect of tree growth exhibit such long-memory behavior due to biology, climate, or some combination of the two factors? Understanding the origins of this behavior is crucial for efforts to evaluate the causes of decadal variability in the climate system.
Presentation at Johann Gutenburg University (Mainz) on February 16, 2017.
Disentangling the decadal ‘knot’ in high-resolution paleoclimatologyScott St. George
Even after more than a century of coordinated monitoring, instrumental weather observations are still too short to adequately constrain decadal or multidecadal behavior in the Earth’s climate system. Leading climatologists and climate modelers have called for the wider application of high-resolution proxy records to decadal variability and prediction studies, and our community has responded by producing new paleoclimate products that specifically target this type of ‘intermediate-term’ behavior. But we now also know our medium changes that message: the biological and geological systems that encode climate information into natural archives often also alter the original ‘input’, usually due to either seasonal filtering or non-climatic persistence. In this talk, we’ll discuss some of the challenges inherent to the use of high-resolution proxies to study decadal or multi-decadal climate variability, and suggest strategies that might clarify how climate acts on those timescales. And we’ll also present a new theoretical framework that could help paleo-scientists evaluate competing ideas about the causes of decadal- or multi-decadal events known to have occurred during the past one or two millennia.
Guarding against false discovery in large-scale dendroclimatologyScott St. George
Measurements of tree-ring widths are the most widely-distributed and best replicated source of surrogate environmental information on the planet, and are one of the main archives used to estimate changes in regional and global climate during the past several centuries or millennia. Because the Northern Hemisphere ring-width network is now so large, it is more crucial than ever to ensure our understanding of tree-environment relations is not influenced by decisions to include or exclude certain records. It may be the case that a particular set of ring-width records are, for whatever reason, more tightly coupled to a particular climate factor than other records from the same region or species and, as a result, may be superior estimators of that factor’s past behavior. At the same time, it is known that selecting a small number of predictors from a large pool of potential candidates increases the likelihood of a Type I error. That effect may be particularly relevant to dendroclimatology because the total number of available ring-width records is often much larger than the number of records used to produce reconstructions of large-scale climate features. As an initial step, it would be helpful if paleoclimate reconstructions derived from tree rings described more explicitly the criteria used to select ring-width records as potential predictors and specified those records excluded by that screening. By comparing ring-width chronologies and their relations with climate against the standard set by thousands of records across the hemisphere, we should be better able to distinguish climate signals from proxy noise and produce more accurate reconstructions of climate during the late Holocene.
Expecting the unexpected: The relevance of old floods to modern hydrologyScott St. George
As one of the most destructive hazards on our planet, floods kill thousands of people and cause billions of dollars in property damage every year. We usually try to gage the risk of future floods by fitting mathematic functions to hydrological data and then extrapolating the upper tail of those distributions. But because large floods are rare and river gage records are short, the conventional approach can sometimes drastically underestimate the threat posed to communities and infrastructure by extreme floods. In this lecture, I’ll argue that paleoflood hydrology — the study of ancient floods as recorded by river and lake sediments, trees, caves, and historical documents — is absolutely essential to judge the real risk of large, rare floods. And I’ll use examples from North America to illustrate how a ‘deeper river memory’ can help people evaluate their own vulnerability to floods, weigh the potential benefits of proposed infrastructure projects, and become more aware of what nature is truly capable of producing.
In many settings, trees growing on floodplains provide an important source of indirect evidence that may be used to infer the occurrence, extent, and magnitude of floods prior to direct observations. That evidence may take several forms, including external scars caused by abrasion or impact from floating debris, anatomical changes within the annual growth increment following prolonged stem or root inundation, or tilting or uprooting due to the hydraulic pressure of floodwaters. Likely the most useful characteristic of paleoflood studies based on floodplain trees is their relatively high temporal resolution and dating accuracy compared to most other methods. Dendrochronological methods can routinely date past floods to the year of their occurrence and, in rare cases, can estimate the timing of floods that occur during the growing season to within two weeks. This high degree of chronological control, which is surpassed only by that provided by direct observation or instrumentation, can be used to determine whether floods in separate watersheds were synchronous or offset by several years and test hypotheses that suppose linkages between extreme floods and specific forcing mechanisms. Furthermore, the wide geographic distribution of tree species with dateable rings combined with the broad suite of methods available to examine interconnections between floods and tree growth allow this style of paleoflood hydrology to be applied to many settings that are not suitable for techniques that depend on geological evidence. Future paleoflood research involving tree rings will need to strike a balance between improving our understanding of the biological and fluvial processes that link tree growth to past events, and providing answers to questions about flood dynamics and hazards that are needed to safeguard people and property from future floods.
Long droughts: Using natural climate archives to gage the risks of future “me...Scott St. George
In the Biblical story of Joseph, following seven years of abundance, the Kingdom of Egypt was confronted by seven years of drought and famine. In the parlance of modern climate science, intervals with several consecutive extremely dry years are described as ‘“megadroughts”. In this short talk, I’ll describe how climate scientists combine clues from natural weather archives (including corals, tree rings, lake sediments, and many other sources) to reveal the history of ancient megadroughts across our planet. And I’ll highlight new research that combines these surrogate drought records with simulations from state-of-the-art climate models to help us better anticipate the risks of unusually persistent droughts during the coming century.
Noah, Joseph, And High-Resolution PaleoclimatologyScott St. George
In 1968, Benoit Mandelbrot and James Wallis published an article titled ‘Noah, Joseph, and operational Hydrology’ in the journal Water Resources Research. In it, they argued that hydrological models of the day were not able to estimate the true risk of extreme floods or prolonged drought, and that rare hydrological events were much more common than usually assumed.
In this lecture, I’ll review how high-resolution paleoenvironmental archives can help us judge more accurately the risks posed by the ‘Noah’- and ‘Joseph’-style events described by Mandelbrot and Wallis. I’ll give particular emphasis to the environmental information recovered from the rings of ancient trees, and explain how dendrochronology (tree-ring research) has been used to redefine the ‘flood of record’, test potential avenues for long-lead climate predictions, and gage the performance of state-of-the-art climate models.
Oak woodlands of California provide a wide range of societal values and ecosystem services, including forage for livestock, wildlife habitat, recreation, soil conservation, and watershed protection. The future of these ecosystems is threatened by a combination grazing pressure, competition from exotic grasses, wildfire severity, and climate change. Kueppers et al. predicted that by the year 2099 the ranges of California endemic oaks would shrink by over 50% of modern potential range sizes, and would shift northward due to climate warming trends and larger precipitation deficits during the growing season.
Expanding the window - the past, present, and future of Minnesota's waterScott St. George
Nearly all decisions about water in Minnesota relate either directly or indirectly to data collected by the state’s hydrological observing network. Because most gauges were installed in early 20th century, as a whole the network provides us with roughly a 100-year ‘window’ to estimate flood risks, develop worst-case scenarios for drought, and set maximum allowable withdrawals for aquifers. But when we rely exclusively on observations made during this relatively brief interval, we may inadvertently increase our exposure to hydrological ‘surprises’. In order to make sound decisions about water in Minnesota, we need to expand this window: into the past, drawing upon historical accounts and natural archives; and into the future, via projections from climate and hydrological models. By cultivating a broader perspective on hydrological variability and extremes across the state, we will be better prepared to ensure adequate water supplies and mitigate the impacts of future floods and droughts.
Madrid's experience developing an integrated, technology-enabled transport system. Presented by Antonio García Pastor at Transforming Transportation 2015.
Transforming Transportation 2015: Smart Cities for Shared Prosperity is the annual conference co-organized by the World Resources Institute and the World Bank.
Multimedia content based retrieval slideshare.pptgovintech1
information retrieval for text and multimedia content has become an important research area.
Content based retrieval in multimedia is a challenging problem since multimedia data needs detailed interpretation
from pixel values. In this presentation, an overview of the content based retrieval is presented along with
the different strategies in terms of syntactic and semantic indexing for retrieval. The matching techniques
used and learning methods employed are also analyzed.
Using Computer-simulated hydrological model (SWAT) to estimate the ground-wat...Dhiraj Jhunjhunwala
This work is the result of a project-based course, Water Resources Engineering. The project is about the estimation of ground-water recharge due to rainfall in a US-based watershed. The semi-distributed hydrological model(SWAT) has been used to simulate the monthly input and output sub-basin-wise streamflow values,which have been used to compute the total infiltration. The results have been depicted in th form of various monthy and yearly infilration values
2018 ASPRS: Big Data: Utilizing Landsat to Detect Ephemeral Water Sources in ...GIS in the Rockies
Since 1971, federal agencies have been tasked with managing burros in federally-designated herd management areas (HMAs). Because these areas are often large and remote, obtaining sufficient data on horse and burro populations and habitat preference can be difficult and expensive. In recent years, the United States Geological Survey (USGS) has partnered with the Bureau of Land Management (BLM) to study the population dynamics and habitat preferences of wild horse and burro populations on the Sinbad HMA in central Utah. Researchers at the USGS and BLM hypothesize that surface water is potentially an important factor in wild horse and burro habitat selection, thus these agencies are interested in determining how water availability affects species’ movement in both time and space. NASA DEVELOP leveraged NASA Earth observations and pre-existing water availability data to determine the spatial and temporal distribution of water on the landscape. Maps were developed to help researchers create habitat selection models for wild horses and burros on the Sinbad HMA and elsewhere.
Listed are few questions related to the content, process, and structure for each paper explored in this presentation and the questions are meant to facilitate in-class discussions. Discussions were facilitated by Richard Maclean and Jenkins Macedo.
Monitoring Kuhdasht Plain Aquifer Using the Drastic Model (Water Quality Inde...AJHSSR Journal
ABSTRACT:Identification and provision of zoning of vulnerable aquifers, i.e. areas where pollutants can
penetrate and distribute from ground surface to groundwater system, is an appropriate management tool to
prevent the contamination of groundwater resources. There are several methods to assess the vulnerability of
aquifers, which are generally divided into three main groups: statistical methods, mathematical methods, and
overlapping indexes methods. In this research, due to the importance of plain aquifer for agricultural and
drinking water supply of the region, drastic method is one of the most applicable overlapping methods used. The
plain aquifer vulnerability map derived from the combination of seven raster maps of drastic model parameters
(water table depth, pure supply, aquifer type, soil type, topographic slope, non-saturated environment
ingredients and hydraulic conductivity) is used; it has been developed in seven layers in ArcGis software. The
final aquifer vulnerability map was prepared for contamination by weighting and ranking and combining the
seven layers above. Matching the nitrate ion on the final drastic map, it was determined that all points with high
nitrate are in the high contamination range, approving the accuracy of the model. According to the zoning map
obtained, about 0.98%, 12.98%, 62.56%, and 23.48% of the study area were within the low, moderate, moderate
to high, and high vulnerability ranges, respectively. The results of this study indicate that the highest
vulnerability potential is in the moderate to high class, and the northern, northwestern and western areas of the
plain have a high potential, while the southwest areas have the lowest potential.
Panel 2: Understanding Risk in Natural and Manmade SystemsResilienceByDesign
Risk plays an increasingly large role in shaping our cities. Risks on a global scale, such as terror threats and climate change, challenge cities to prepare and become resilient. At the same time, spatial decisions are often more driven by risks on a project scale, such as political calculations or the ability to obtain finance.
The panel will focus on understanding the complex roles of risk, and look at different ways in which systems theory helps us understand risk in our cities and landscapes. For instance, it is now understood that for a city to become resilient one has to look at physical, social, organizational aspects, understand the interdependencies between these aspects, and look at the ability to ‘learn’ and adapt. [We think our cities as complex adaptive systems, systems of many components, at different levels of organization, that interact in non-linear ways to adapt to changing environments – add or not? MB] What does this understanding of cities and landscape mean for the role of designers? Can design thinking be a form of systems thinking?
Project Overview: Ecological & Evolutionary Genetics of Southwestern White Pi...Justin C. Bagley
Provides a brief overview of our project on the ecological and evolutionary genetics of southwestern white pine (SWWP), an alpine white pine distributed in the sky-islands of the North American desert southwest.
The HortFlora Research Spectrum (HRS), is an international-peer reviewed, open access journal that serves as a forum for the exchange and dissemination of R & D advances and innovations in all facets of Horticultural Sciences (Pomology, Olericulture, Floriculture, Post Harvest Technology, Plant Biotechnology, and Medicinal & Aromatic Plants etc.) and its allied branches on an international level. HRS is officially published quarterly (March, June, September and December) every year, in English (print & online version), under the keen auspices of Biosciences & Agriculture Advancement Society (BAAS), Meerut (India)
www.hortflorajournal.com
TEMPORAL AND SPATIAL VARIABILITY IN PLANT PATHOENS.pptxsunilsuriya1
Temporal and spatial variability in plant pathogens refers to the dynamic changes in the distribution, abundance, and activity of plant pathogens over time and across different geographical locations. This variability plays a crucial role in understanding disease dynamics, predicting disease outbreaks, and implementing effective management strategies in agricultural systems. Here's a detailed description:
Temporal Variability:**
**Seasonal Dynamics:** Plant pathogens often exhibit seasonal fluctuations in their populations due to changes in environmental conditions such as temperature, humidity, and rainfall. For example, some pathogens thrive in warm and humid conditions, leading to increased disease incidence during certain seasons.
**Life Cycle of Pathogens:** The life cycle of a pathogen influences its temporal variability. Some pathogens have short life cycles, rapidly reproducing and spreading during favorable conditions. Others may have dormant stages, surviving adverse conditions until favorable conditions return.
**Epidemic Cycles:** Plant diseases can show epidemic cycles, with periods of rapid disease spread followed by periods of decline. Factors such as host susceptibility, pathogen virulence, and environmental conditions contribute to the timing and severity of disease outbreaks.
**Long-Term Trends:** Changes in climate patterns and human activities can lead to long-term trends in disease occurrence. For instance, global warming may alter the geographic range of pathogens, affecting their temporal patterns of activity.
**Management Implications:** Understanding the temporal variability of plant pathogens helps in timing disease control measures such as fungicide applications, planting disease-resistant cultivars, and adjusting cropping schedules to avoid peak disease periods.
---
**Spatial Variability:**
**Geographic Distribution:** Plant pathogens may exhibit different levels of prevalence and severity across geographical regions. This variation is influenced by factors such as climate, soil type, topography, and host plant diversity.
**Localized Hotspots:** Within a field or orchard, there can be localized hotspots of disease where pathogen populations are particularly high. These hotspots can be influenced by factors like soil moisture, nutrient availability, and previous cropping history.
**Disease Gradient:** The severity of disease often decreases with distance from the infection source. This creates a disease gradient, where plants closest to the infection source are most affected, and disease severity decreases farther away.
**Vector Movement:** Some plant pathogens rely on vectors, such as insects or wind, for dispersal. This leads to spatial patterns of disease that follow the movement of these vectors.
**Management Implications:** Mapping the spatial distribution of plant pathogens helps in targeted disease management. This includes precision application of control measures, zoning for quarantine or er
Willie Nelson Net Worth: A Journey Through Music, Movies, and Business Venturesgreendigital
Willie Nelson is a name that resonates within the world of music and entertainment. Known for his unique voice, and masterful guitar skills. and an extraordinary career spanning several decades. Nelson has become a legend in the country music scene. But, his influence extends far beyond the realm of music. with ventures in acting, writing, activism, and business. This comprehensive article delves into Willie Nelson net worth. exploring the various facets of his career that have contributed to his large fortune.
Follow us on: Pinterest
Introduction
Willie Nelson net worth is a testament to his enduring influence and success in many fields. Born on April 29, 1933, in Abbott, Texas. Nelson's journey from a humble beginning to becoming one of the most iconic figures in American music is nothing short of inspirational. His net worth, which estimated to be around $25 million as of 2024. reflects a career that is as diverse as it is prolific.
Early Life and Musical Beginnings
Humble Origins
Willie Hugh Nelson was born during the Great Depression. a time of significant economic hardship in the United States. Raised by his grandparents. Nelson found solace and inspiration in music from an early age. His grandmother taught him to play the guitar. setting the stage for what would become an illustrious career.
First Steps in Music
Nelson's initial foray into the music industry was fraught with challenges. He moved to Nashville, Tennessee, to pursue his dreams, but success did not come . Working as a songwriter, Nelson penned hits for other artists. which helped him gain a foothold in the competitive music scene. His songwriting skills contributed to his early earnings. laying the foundation for his net worth.
Rise to Stardom
Breakthrough Albums
The 1970s marked a turning point in Willie Nelson's career. His albums "Shotgun Willie" (1973), "Red Headed Stranger" (1975). and "Stardust" (1978) received critical acclaim and commercial success. These albums not only solidified his position in the country music genre. but also introduced his music to a broader audience. The success of these albums played a crucial role in boosting Willie Nelson net worth.
Iconic Songs
Willie Nelson net worth is also attributed to his extensive catalog of hit songs. Tracks like "Blue Eyes Crying in the Rain," "On the Road Again," and "Always on My Mind" have become timeless classics. These songs have not only earned Nelson large royalties but have also ensured his continued relevance in the music industry.
Acting and Film Career
Hollywood Ventures
In addition to his music career, Willie Nelson has also made a mark in Hollywood. His distinctive personality and on-screen presence have landed him roles in several films and television shows. Notable appearances include roles in "The Electric Horseman" (1979), "Honeysuckle Rose" (1980), and "Barbarosa" (1982). These acting gigs have added a significant amount to Willie Nelson net worth.
Television Appearances
Nelson's char
"Understanding the Carbon Cycle: Processes, Human Impacts, and Strategies for...MMariSelvam4
The carbon cycle is a critical component of Earth's environmental system, governing the movement and transformation of carbon through various reservoirs, including the atmosphere, oceans, soil, and living organisms. This complex cycle involves several key processes such as photosynthesis, respiration, decomposition, and carbon sequestration, each contributing to the regulation of carbon levels on the planet.
Human activities, particularly fossil fuel combustion and deforestation, have significantly altered the natural carbon cycle, leading to increased atmospheric carbon dioxide concentrations and driving climate change. Understanding the intricacies of the carbon cycle is essential for assessing the impacts of these changes and developing effective mitigation strategies.
By studying the carbon cycle, scientists can identify carbon sources and sinks, measure carbon fluxes, and predict future trends. This knowledge is crucial for crafting policies aimed at reducing carbon emissions, enhancing carbon storage, and promoting sustainable practices. The carbon cycle's interplay with climate systems, ecosystems, and human activities underscores its importance in maintaining a stable and healthy planet.
In-depth exploration of the carbon cycle reveals the delicate balance required to sustain life and the urgent need to address anthropogenic influences. Through research, education, and policy, we can work towards restoring equilibrium in the carbon cycle and ensuring a sustainable future for generations to come.
WRI’s brand new “Food Service Playbook for Promoting Sustainable Food Choices” gives food service operators the very latest strategies for creating dining environments that empower consumers to choose sustainable, plant-rich dishes. This research builds off our first guide for food service, now with industry experience and insights from nearly 350 academic trials.
Artificial Reefs by Kuddle Life Foundation - May 2024punit537210
Situated in Pondicherry, India, Kuddle Life Foundation is a charitable, non-profit and non-governmental organization (NGO) dedicated to improving the living standards of coastal communities and simultaneously placing a strong emphasis on the protection of marine ecosystems.
One of the key areas we work in is Artificial Reefs. This presentation captures our journey so far and our learnings. We hope you get as excited about marine conservation and artificial reefs as we are.
Please visit our website: https://kuddlelife.org
Our Instagram channel:
@kuddlelifefoundation
Our Linkedin Page:
https://www.linkedin.com/company/kuddlelifefoundation/
and write to us if you have any questions:
info@kuddlelife.org
Characterization and the Kinetics of drying at the drying oven and with micro...Open Access Research Paper
The objective of this work is to contribute to valorization de Nephelium lappaceum by the characterization of kinetics of drying of seeds of Nephelium lappaceum. The seeds were dehydrated until a constant mass respectively in a drying oven and a microwawe oven. The temperatures and the powers of drying are respectively: 50, 60 and 70°C and 140, 280 and 420 W. The results show that the curves of drying of seeds of Nephelium lappaceum do not present a phase of constant kinetics. The coefficients of diffusion vary between 2.09.10-8 to 2.98. 10-8m-2/s in the interval of 50°C at 70°C and between 4.83×10-07 at 9.04×10-07 m-8/s for the powers going of 140 W with 420 W the relation between Arrhenius and a value of energy of activation of 16.49 kJ. mol-1 expressed the effect of the temperature on effective diffusivity.
Natural farming @ Dr. Siddhartha S. Jena.pptxsidjena70
A brief about organic farming/ Natural farming/ Zero budget natural farming/ Subash Palekar Natural farming which keeps us and environment safe and healthy. Next gen Agricultural practices of chemical free farming.
2. A MODEL INTEGRATION FRAMEWORK FOR ASSESSING SURFACE AND SUBSURFACE WATER INTERACTION
Improve process model simulation at the WS
• New research knowledge becomes available
• Finer spatio-temporal resolutions data
• Feedback fluxes
• Long-term impacts assessments
• Future scenarios
• Agro-ecosystem interactions
• Decrease uncertainty in model outputs
Surface
SubSurface
3. Guzman et al. (2012a, 2012b, 2013)
Surface
USZ
SZ
BF
OF
PET
I
DP CR
Ain
Aout
RO
PF
WF IR
• Distributed ET fluxes
• Distributed percolation fluxes
• Distributed groundwater
feedback fluxes
• Surface-groundwater interaction
Atmospheric-surface-subsurface hydrologic linkage
• Hydrologic cycle is a complex system
• Essential to account for in water budgets
A MODEL INTEGRATION FRAMEWORK FOR ASSESSING SURFACE AND SUBSURFACE WATER INTERACTION
4. A MODEL INTEGRATION FRAMEWORK FOR ASSESSING SURFACE AND SUBSURFACE WATER INTERACTION
SPELLmap
SWATmf
SWAT‐MODFLOW
Spatio‐Temporal Analysis
Visualization SWAT‐MODFLOW project
builder
Surface‐Subsurface integrated model
EB_ET
Model Integration Framework
ArcSWAT
SWAT project
builder
5. B→13s→ 1m→ Areafrac
B→14s→ 1m → Areafrac
B→22s→ 1m → Areafrac
B→23s→ 1m → Areafrac
B→24s→ 1m → Areafrac
B→31s→ 5m → Areafrac
B→32s→ 5m → Areafrac
A→33s→ 5m → Areafrac
A→34s→ 5m → Areafrac
A→41s→ 5m → Areafrac
A→42s→ 5m → Areafrac
A→43s→ 5m → Areafrac
A→52s→ 5m → Areafrac
A B A
D
E
C
xll,yll
xll,yll
0s 1s 9s
10s
79
19s
70s 78
60s
0m 3m
4m
8m 11m
1m
10m
7m
1w
2w
3w
4w
(b)
SWAT‐MODFLOW
domains indexation
(Lookup table)
SWATmf‐app
(SPELLmap)
SWATmf‐model †
Raster
Time series
• NAM, BAS, DIS,
NWT, LIST, UPW,
LPF, OC, RCH,
WEL, DRN, CHD,
GHB, RES
• Log file
• Update file
handles
• Lookup tables
• Contextual data
• MODFLOW outputs
(LIST, RCH‐S, HDS,
WEL‐S)
• SWAT outputs
SPELLmap
ArcSWAT
SWAT
project
• HDS time series
• HDS daily maps
• EXT time series
• Metrics
MODFLOW project SWAT‐MODFLOW project
SWAT
MODFLOW
Interface
† SWATmf‐model
HRU
Feature class
(a)
arcSWAT HRU polygon domain
SWAT HRU grid domain
MODFLOW cells grid domain
MODFLOW wells domain
A MODEL INTEGRATION FRAMEWORK FOR ASSESSING SURFACE AND SUBSURFACE WATER INTERACTION
Remote sensing grid domain
EB‐ET
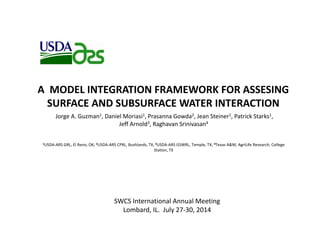
6. A MODEL INTEGRATION FRAMEWORK FOR ASSESSING SURFACE AND SUBSURFACE WATER INTERACTION
The Fort Cobb Reservoir Experimental Watershed (FCREW)
USDA‐ARS Grazinglands Research Laboratory, Oklahoma
7. UNCERTAINTY CONSIDERATIONS IN CALIBRATION AND VALIDATION OF HYDROLOGIC AND WATER QUALITY MODELS
SPATIAL DISCRETIZATION & LINKAGE
Land Use
Slope
Soil Class
HRUs ID Grid
Extraction
Wells
Wells to HRUs
SURFACE DOMAIN
(30 x 30 m)
River
Network
FCREW
Lookup
Table
(b)
(c)
MODEL
CONCEPTUALIZATION
LAND USE
LANSAT
(a)
10. ‐8
‐6
‐4
‐2
0
2
4
6
Jan‐11 Mar‐11 May‐11 Jun‐11 Aug‐11 Oct‐11 Dec‐11
ET Deviation (mm d‐1)
HRU‐5 HRU‐804
INTEGRATION OF ENERGY BALANCE EVAPOTRANSPIRATION & SWATmf MODEL
Rainfall 460.5
Avg. RO 75
HRU‐5
EB_ET : 805.2
Model : 430.6
‐‐‐‐‐‐‐‐‐‐‐‐‐‐‐‐‐‐‐‐
‐374.6
HRU‐804
EB_ET : 1114.8
Model : 474.1
‐‐‐‐‐‐‐‐‐‐‐‐‐‐‐‐‐‐‐‐
‐640.7
2011
Model – EB_ET
11. Interfacing
Routines
Lookup tables
Contextual data
BAS, DIS, NWT,
LIST, UPW, LPF,
OC, RCH, WEL,
DRN, CHD,
GHB, RES
• Setup NAM, OC
• Log file
• Update file
handles
Interfacing
Routines
HRUs percolation
HRUs irrigation
• Updated RCH
• Updated WEL
• Log file
SWAT‐code
daily loop
MODFLOW‐code
Stress period
simulation
BAS, DIS, NWT,
LIST, UPW, LPF,
OC, DRN, CHD,
GHB, RES
Day =first
yes
no
Day =last
MODFLOW‐code
launch
1
SWATmf‐model
*.cio
SWAT data
MODFLOW‐code
close
END
SWAT ‐code
simulation
SWAT‐code
close
1
no
yes
coupled
yes
coupled
yes
2
no
2
no
coupled
no
yes
A MODEL INTEGRATION FRAMEWORK FOR ASSESSING SURFACE AND SUBSURFACE WATER INTERACTION
12. JAN FEB MAR
APR MAY JUN
JUL AUG SEP
OCT NOV DEC
Jul‐18‐11 Jul‐19‐11 Jul‐20‐11
Jul‐22‐11 Jul‐23‐11
(a) (b)
(c)
A MODEL INTEGRATION FRAMEWORK FOR ASSESSING SURFACE AND SUBSURFACE WATER INTERACTION
13. A
A’ B
B’C
C’
CROSS SECTION
Distance
20,00015,00010,0005,0000
480
460
440
420
400
380
360
CROSS SECTION
Distance
25,00020,00015,00010,0005,0000
500
480
460
440
420
400
380
CROSS SECTION
Distance
30,00025,00020,00015,00010,0005,0000
520
500
480
460
440
420
400
380
A
A’ B
B’C
C’
Core2
Eakly
Alfalfa
A-A’
B-B’
C-C’
GWL
GWL
GWL
Marlow Formation
Marlow Formation
Marlow Formation
Rush Spring Aquifer
Rush Spring Aquifer
Rush Spring Aquifer
Core2 Alfalfa
Alfalfa
Eaklyn
Eaklyn
Core2
Jul 17‐11
(a) (b)
(c)
Top MODFLOW boundary
Terrain surface
Simulated
groundwater level
Observed
Simulated
Alfalfa
Core2
Eakly
A MODEL INTEGRATION FRAMEWORK FOR ASSESSING SURFACE AND SUBSURFACE WATER INTERACTION