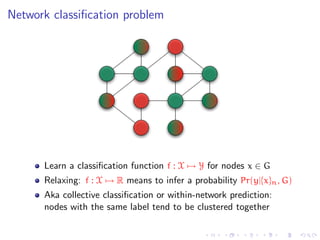
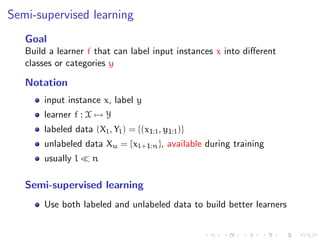
The document discusses the challenges of network classification, particularly the sparsity of labeled nodes and the impact of network structure on model accuracy. It introduces semi-supervised learning methods that leverage both labeled and unlabeled data through graph-based approaches, emphasizing harmonic functions and iterative methods for label propagation. Additionally, it explores sampling techniques to reduce complexity while approximating classifications within large graphs.
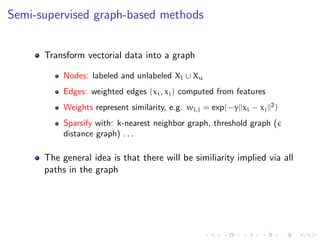
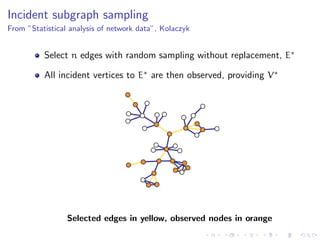
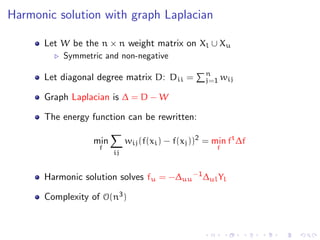
![Semi-supervised graph-based methods
Smoothness assumption
In a weighted graph, nodes that are similar are connected by heavy
edges (high density region) and therefore tend to have the same
label. Density is not uniform
[From Zhu et al. ICML 2003]](https://image.slidesharecdn.com/main-110926073139-phpapp01/85/A-discussion-on-sampling-graphs-to-approximate-network-classification-functions-8-320.jpg)
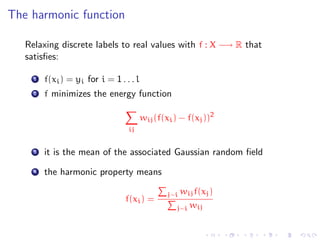
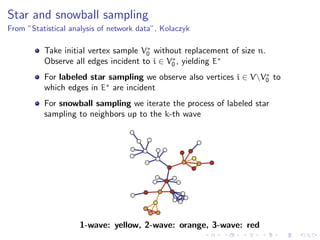
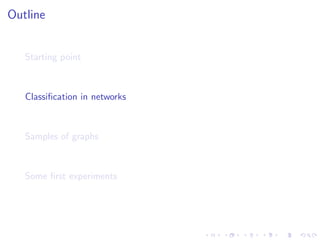
![A random walk interpretation on directed graphs
wij
Randomly walk from node i to j with probability
k wik
The harmonic function tells about Pr(hit label 1 | start from i)
[From Zhu’s tutorial at ICML 2007]](https://image.slidesharecdn.com/main-110926073139-phpapp01/85/A-discussion-on-sampling-graphs-to-approximate-network-classification-functions-11-320.jpg)
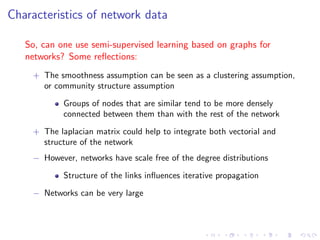
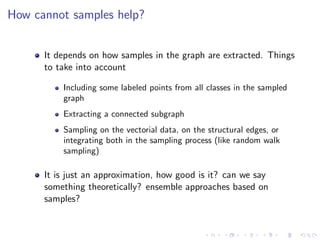
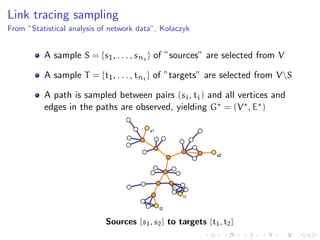
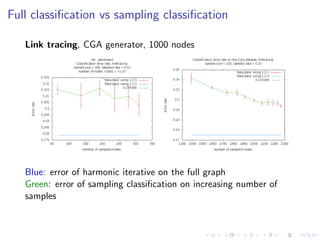
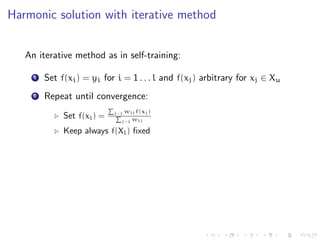
![How can samples help?
Samples have less edges than the full graph, so diffusion is different
from the full graph
Subgraphs will be random, so maybe a good behavior on average
The iterative algorithm (or laplacian harmonic) will be applied only
on samples. Complexity is reduced
The nodes not contained in any sample, will be labeled following
the assumptions of the random walk interpretation given by the
harmonic iterative solution
[From Zhu’s tutorial at ICML 2007]](https://image.slidesharecdn.com/main-110926073139-phpapp01/85/A-discussion-on-sampling-graphs-to-approximate-network-classification-functions-16-320.jpg)