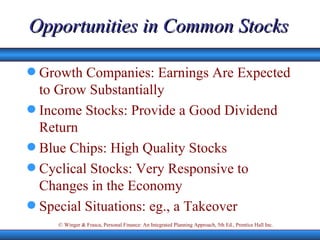
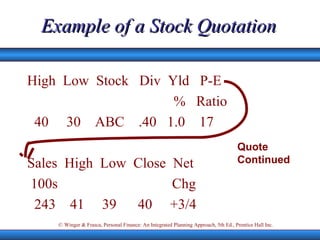
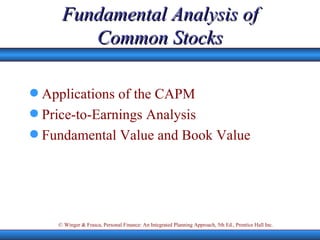
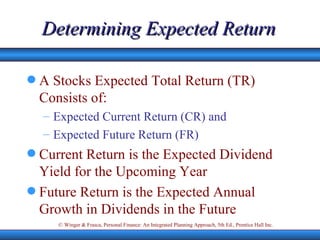
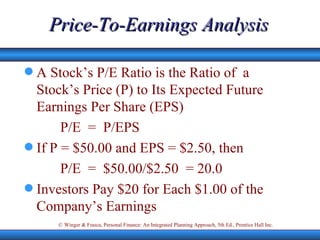
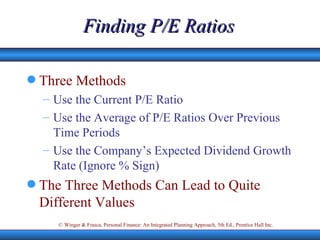
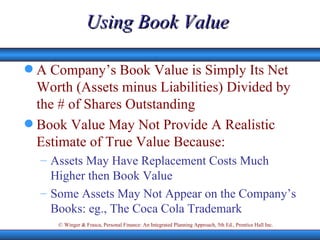
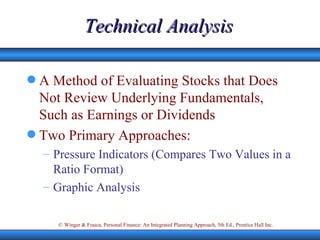
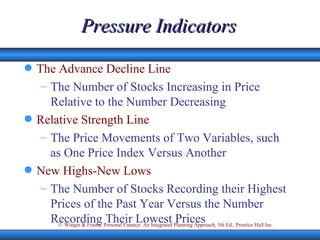
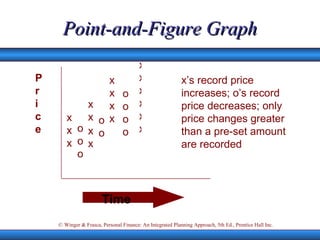
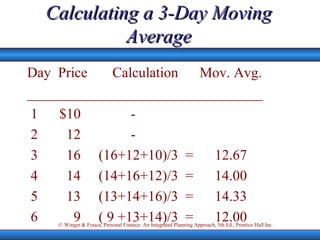
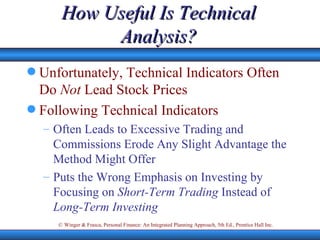
Personal Finance: An Integrated Planning Approach Winger & Frasca Chapter 11  Common Stock
Major Topics Characteristics of Common Stock Fundamental Analysis of Common Stocks Technical Analysis
Characteristics of Common Stock Shareholders’ Rights Distributions to Shareholders Opportunities in Common Stocks How to Read Stock Quotations
Shareholders’ Rights Right to Vote--Usually, One Share Earns One Vote Preemptive Right Allows Shareholders to Maintain Their Proportionate Ownership Share in the Corporation Right to Share in Earnings or Asset Distributions
Shareholders Come Last Shareholders Have a  Residual Claim  on Assets, Which Means All Other Claims Must Be Paid Before Shareholders Can Receive Any Distribution However, Other Claims Are Fixed: So, if the Company Has Good Earnings, Shareholders Benefit Considerably But Poor Earnings Can Be Damaging
An Example of Earnings Distribution Poor Earnings of only $9,000 Interest to bondholders  $5,000 Dividends to preferred shareholders  3,000 The balance  to common shareholders  1,000 Good Earnings of $20,000 Interest to bondholders  $5,000 Dividends to preferred shareholders  3,000 The balance to common shareholders  12,000
Distributions to Common Shareholders Cash Distributions Regular (Quarterly) Dividend Periodic Share Repurchases Non-cash Distributions Stock Dividend Stock Split
Stock Dividends and Splits Although Favored by Some Shareholders, Stock Dividends and Splits Do Not Increase Shareholder Wealth They Simply Provide Shareholders with a Greater Number of Shares, But: The Prices of Shares Fall so that the Total Market Value Remains the Same
Opportunities in Common Stocks Growth Companies: Earnings Are Expected to Grow Substantially Income Stocks: Provide a Good Dividend Return Blue Chips: High Quality Stocks Cyclical Stocks: Very Responsive to Changes in the Economy Special Situations: eg., a Takeover
Example of a Stock Quotation High  Low  Stock  Div  Yld  P-E  %  Ratio 40  30  ABC  .40  1.0  17 Sales  High  Low  Close  Net 100s  Chg 243  41  39  40  +3/4 Quote Continued
Fundamental Analysis of Common Stocks Applications of the CAPM Price-to-Earnings Analysis Fundamental Value and Book Value
Determining Expected Return A Stocks Expected Total Return (TR) Consists of: Expected Current Return (CR) and Expected Future Return (FR) Current Return is the Expected Dividend Yield for the Upcoming Year Future Return is the Expected Annual Growth in Dividends in the Future
Calculating Expected Return Data for ABC Company: Current Stock Price = $20/share Expected Dividend Next Year = $1.20 Current Return (CR) = ($1.20/$20) = .06 Expected Annual Growth in Dividends in the Foreseeable Future  (FR)= 0.08 Total Return = Current Return + Future Return TR = CR + FR TR = 0.06 + 0.08 = 0.14, or 14.0%
Review of CAPM Approach The Method Provides a Pertinent View of a Company’s Risk--its Beta Value It Brings a Company’s Risk Into the Picture Through the Required Return Equation, Which Expresses How Much Return You  Should  Earn on the Stock Comparing This Return to What You  Expect  the Company to Earn Provides a Clear Decision Signal--the Alpha Value
Fig. 11.5 Comparing Mead’s required rate of return with its expected rate of return, 1998 Required Rate of Return Expected  Rate of Return
Fig. 11.5 Comparing Mead’s required rate of return with its expected rate of return, 1998 Required rate of return  Expected  rate of return  = 12.9% = 11.5% Alpha  = - 1.1% Sell
Price-To-Earnings Analysis A Stock’s P/E Ratio is the Ratio of  a Stock’s Price (P) to Its Expected Future Earnings Per Share (EPS) P/E  =  P/EPS If P = $50.00 and EPS = $2.50, then P/E  =  $50.00/$2.50  = 20.0 Investors Pay $20 for Each $1.00 of the Company’s Earnings
Finding P/E Ratios Three Methods Use the Current P/E Ratio Use the Average of P/E Ratios Over Previous Time Periods Use the Company’s Expected Dividend Growth Rate (Ignore % Sign) The Three Methods Can Lead to Quite Different Values
Using Book Value A Company’s Book Value is Simply Its Net Worth (Assets minus Liabilities) Divided by the # of Shares Outstanding Book Value May Not Provide A Realistic Estimate of True Value Because: Assets May Have Replacement Costs Much Higher then Book Value Some Assets May Not Appear on the Company’s Books: eg., The Coca Cola Trademark
The Market-to-Book Ratio Despite Book Value’s Limitations, Some Analysts Use the Market-to-Book Ratio This Ratio Divides the Stock’s Price by its Book Value. Example: if Price is $40/Share and Book Value is $10/Share, Market-to-Book = 4.0 All Other Things Equal, Analysts Prefer Low Values for this Ratio
The PEG Ratio Shows the Relationship between the PE Ratio and the Long-Term Growth Rate PEG = (P/E)/Growth All Things Equal, Low Numbers Are Desirable--You’re Buying Growth at a Low Price
Technical Analysis A Method of Evaluating Stocks that Does Not Review Underlying Fundamentals, Such as Earnings or Dividends Two Primary Approaches: Pressure Indicators (Compares Two Values in a Ratio Format) Graphic Analysis
Pressure Indicators The Advance Decline Line The Number of Stocks Increasing in Price Relative to the Number Decreasing Relative Strength Line The Price Movements of Two Variables, such as One Price Index Versus Another New Highs-New Lows The Number of Stocks Recording their Highest Prices of the Past Year Versus the Number Recording Their Lowest Prices
A Time Graph Support Line Resistance Line 1999 2000 Break Out Price Volume
Point-and-Figure Graph x x x o o o x x x x o o x x x x o o o o x x x x x x P r i c e x’s record price increases; o’s record price decreases; only price changes greater than a pre-set amount are recorded Time
Calculating a 3-Day Moving Average Day  Price  Calculation  Mov. Avg. _________________________________ 1  $10  - 2  12  - 3  16  (16+12+10)/3  =  12.67 4  14  (14+16+12)/3  =  14.00 5  13  (13+14+16)/3  =  14.33  6  9  ( 9 +13+14)/3  =  12.00
How Useful Is Technical Analysis? Unfortunately, Technical Indicators Often Do  Not  Lead Stock Prices Following Technical Indicators Often Leads to Excessive Trading and Commissions Erode Any Slight Advantage the Method Might Offer Puts the Wrong Emphasis on Investing by Focusing on  Short-Term Trading  Instead of  Long-Term Investing
Next Chapter 12 Fixed-Income Securities

Dividends

  • 1.
    Personal Finance: AnIntegrated Planning Approach Winger & Frasca Chapter 11 Common Stock
  • 2.
    Major Topics Characteristicsof Common Stock Fundamental Analysis of Common Stocks Technical Analysis
  • 3.
    Characteristics of CommonStock Shareholders’ Rights Distributions to Shareholders Opportunities in Common Stocks How to Read Stock Quotations
  • 4.
    Shareholders’ Rights Rightto Vote--Usually, One Share Earns One Vote Preemptive Right Allows Shareholders to Maintain Their Proportionate Ownership Share in the Corporation Right to Share in Earnings or Asset Distributions
  • 5.
    Shareholders Come LastShareholders Have a Residual Claim on Assets, Which Means All Other Claims Must Be Paid Before Shareholders Can Receive Any Distribution However, Other Claims Are Fixed: So, if the Company Has Good Earnings, Shareholders Benefit Considerably But Poor Earnings Can Be Damaging
  • 6.
    An Example ofEarnings Distribution Poor Earnings of only $9,000 Interest to bondholders $5,000 Dividends to preferred shareholders 3,000 The balance to common shareholders 1,000 Good Earnings of $20,000 Interest to bondholders $5,000 Dividends to preferred shareholders 3,000 The balance to common shareholders 12,000
  • 7.
    Distributions to CommonShareholders Cash Distributions Regular (Quarterly) Dividend Periodic Share Repurchases Non-cash Distributions Stock Dividend Stock Split
  • 8.
    Stock Dividends andSplits Although Favored by Some Shareholders, Stock Dividends and Splits Do Not Increase Shareholder Wealth They Simply Provide Shareholders with a Greater Number of Shares, But: The Prices of Shares Fall so that the Total Market Value Remains the Same
  • 9.
    Opportunities in CommonStocks Growth Companies: Earnings Are Expected to Grow Substantially Income Stocks: Provide a Good Dividend Return Blue Chips: High Quality Stocks Cyclical Stocks: Very Responsive to Changes in the Economy Special Situations: eg., a Takeover
  • 10.
    Example of aStock Quotation High Low Stock Div Yld P-E % Ratio 40 30 ABC .40 1.0 17 Sales High Low Close Net 100s Chg 243 41 39 40 +3/4 Quote Continued
  • 11.
    Fundamental Analysis ofCommon Stocks Applications of the CAPM Price-to-Earnings Analysis Fundamental Value and Book Value
  • 12.
    Determining Expected ReturnA Stocks Expected Total Return (TR) Consists of: Expected Current Return (CR) and Expected Future Return (FR) Current Return is the Expected Dividend Yield for the Upcoming Year Future Return is the Expected Annual Growth in Dividends in the Future
  • 13.
    Calculating Expected ReturnData for ABC Company: Current Stock Price = $20/share Expected Dividend Next Year = $1.20 Current Return (CR) = ($1.20/$20) = .06 Expected Annual Growth in Dividends in the Foreseeable Future (FR)= 0.08 Total Return = Current Return + Future Return TR = CR + FR TR = 0.06 + 0.08 = 0.14, or 14.0%
  • 14.
    Review of CAPMApproach The Method Provides a Pertinent View of a Company’s Risk--its Beta Value It Brings a Company’s Risk Into the Picture Through the Required Return Equation, Which Expresses How Much Return You Should Earn on the Stock Comparing This Return to What You Expect the Company to Earn Provides a Clear Decision Signal--the Alpha Value
  • 15.
    Fig. 11.5 ComparingMead’s required rate of return with its expected rate of return, 1998 Required Rate of Return Expected Rate of Return
  • 16.
    Fig. 11.5 ComparingMead’s required rate of return with its expected rate of return, 1998 Required rate of return Expected rate of return = 12.9% = 11.5% Alpha = - 1.1% Sell
  • 17.
    Price-To-Earnings Analysis AStock’s P/E Ratio is the Ratio of a Stock’s Price (P) to Its Expected Future Earnings Per Share (EPS) P/E = P/EPS If P = $50.00 and EPS = $2.50, then P/E = $50.00/$2.50 = 20.0 Investors Pay $20 for Each $1.00 of the Company’s Earnings
  • 18.
    Finding P/E RatiosThree Methods Use the Current P/E Ratio Use the Average of P/E Ratios Over Previous Time Periods Use the Company’s Expected Dividend Growth Rate (Ignore % Sign) The Three Methods Can Lead to Quite Different Values
  • 19.
    Using Book ValueA Company’s Book Value is Simply Its Net Worth (Assets minus Liabilities) Divided by the # of Shares Outstanding Book Value May Not Provide A Realistic Estimate of True Value Because: Assets May Have Replacement Costs Much Higher then Book Value Some Assets May Not Appear on the Company’s Books: eg., The Coca Cola Trademark
  • 20.
    The Market-to-Book RatioDespite Book Value’s Limitations, Some Analysts Use the Market-to-Book Ratio This Ratio Divides the Stock’s Price by its Book Value. Example: if Price is $40/Share and Book Value is $10/Share, Market-to-Book = 4.0 All Other Things Equal, Analysts Prefer Low Values for this Ratio
  • 21.
    The PEG RatioShows the Relationship between the PE Ratio and the Long-Term Growth Rate PEG = (P/E)/Growth All Things Equal, Low Numbers Are Desirable--You’re Buying Growth at a Low Price
  • 22.
    Technical Analysis AMethod of Evaluating Stocks that Does Not Review Underlying Fundamentals, Such as Earnings or Dividends Two Primary Approaches: Pressure Indicators (Compares Two Values in a Ratio Format) Graphic Analysis
  • 23.
    Pressure Indicators TheAdvance Decline Line The Number of Stocks Increasing in Price Relative to the Number Decreasing Relative Strength Line The Price Movements of Two Variables, such as One Price Index Versus Another New Highs-New Lows The Number of Stocks Recording their Highest Prices of the Past Year Versus the Number Recording Their Lowest Prices
  • 24.
    A Time GraphSupport Line Resistance Line 1999 2000 Break Out Price Volume
  • 25.
    Point-and-Figure Graph xx x o o o x x x x o o x x x x o o o o x x x x x x P r i c e x’s record price increases; o’s record price decreases; only price changes greater than a pre-set amount are recorded Time
  • 26.
    Calculating a 3-DayMoving Average Day Price Calculation Mov. Avg. _________________________________ 1 $10 - 2 12 - 3 16 (16+12+10)/3 = 12.67 4 14 (14+16+12)/3 = 14.00 5 13 (13+14+16)/3 = 14.33 6 9 ( 9 +13+14)/3 = 12.00
  • 27.
    How Useful IsTechnical Analysis? Unfortunately, Technical Indicators Often Do Not Lead Stock Prices Following Technical Indicators Often Leads to Excessive Trading and Commissions Erode Any Slight Advantage the Method Might Offer Puts the Wrong Emphasis on Investing by Focusing on Short-Term Trading Instead of Long-Term Investing
  • 28.
    Next Chapter 12Fixed-Income Securities