IMPORTANCE OF PE
RATIOS OF THE
COMPANIES
PE RATIO
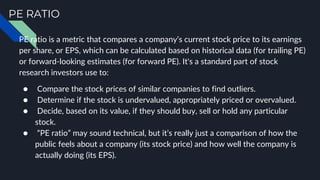
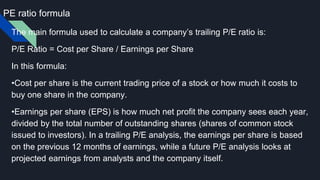
PE ratio is a metric that compares a company’s current stock price to its earnings
per share, or EPS, which can be calculated based on historical data (for trailing PE)
or forward-looking estimates (for forward PE). It's a standard part of stock
research investors use to:
● Compare the stock prices of similar companies to find outliers.
● Determine if the stock is undervalued, appropriately priced or overvalued.
● Decide, based on its value, if they should buy, sell or hold any particular
stock.
● “PE ratio” may sound technical, but it’s really just a comparison of how the
public feels about a company (its stock price) and how well the company is
actually doing (its EPS).
Example
A company posts stable profits quarter after quarter, and its
projected profits are equally stable.
If its stock price jumps but its earnings stay
What happens to the intrinsic value of the company ?
Does it change ?
Why did the price increase then?
If a company’s PE ratio is significantly higher than its peers
what does it mean?
It’s a measure of how much investors are paying for every Rs.1 of a
company’s earnings. Imagine two similar companies in the same
sector. One has a share price of Rs.100 and a PE ratio of 15. The
other has a share price of Rs 50 and a PE ratio of 30. The first
company’s share price may be higher, but a PE ratio of 15 means
you’re only paying Rs. 15 for every Re.1 of the company’s earnings.
Investors in the company with a PE ratio of 30 are paying Rs. 30 for
Re 1 of earnings.
How to Calculate P/E Ratios
There are two main types of P/E ratio analysis:
Trailing
A trailing P/E analysis divides the cost per share by the company’s past 12
months of earnings (often referred to as the trailing twelve months or TTM).
This method is the most commonly used approach because the data is
objective — as long as the company has reported its earnings correctly and
honestly, a trailing P/E ratio uses only concrete data, rather than subjective
or projected data.
However, because past earnings are only reported every quarter, and stock
prices can change daily as the market evolves, the trailing P/E ratio will
constantly change.
Forward
A forward P/E analysis uses forecasted earnings — how much a
company expects to earn in the future. Forward P/E ratios are useful
because a company’s past data is not always indicative of future
performance.
However, a forward P/E relies heavily on estimations from analysts
and the company itself. A company may over or underestimate its
future earnings as a way to toy with its P/E ratios and drive changes
in investor behavior.
PE ratio formula
The main formula used to calculate a company’s trailing P/E ratio is:
P/E Ratio = Cost per Share / Earnings per Share
In this formula:
•Cost per share is the current trading price of a stock or how much it costs to
buy one share in the company.
•Earnings per share (EPS) is how much net profit the company sees each year,
divided by the total number of outstanding shares (shares of common stock
issued to investors). In a trailing P/E analysis, the earnings per share is based
on the previous 12 months of earnings, while a future P/E analysis looks at
projected earnings from analysts and the company itself.
A company’s P/E ratio will be shown in a “#x” type of format (such as
20x or 15x) — this signifies how many times higher the stock price is
compared to the earnings per share.
Raymond March 2023
EPS= Rs 79.45 Current price is =Rs 1907
PE ratio= 24
One way to put it is that the stock is trading 24 times higher than the
company’s earnings, or 24x.
To truly understand the value of a company’s P/E ratio, it needs to be compared to
another company. Let’s look at the following table:
Company A Company B Industry Average
Cost per Share Rs30 Rs20
Earnings per Share Re1 Re0.50
P/E Ratio 30x 40x 30x
Because Company B is cheaper per share, it is tempting to assume it is a better deal
than Company A. However, Company A is cheaper because you are paying less for
every $1 of earnings per year. Especially if we take into consideration that the
industry average for these companies is 30x, Company A is the more “on par”
investment — it is well-priced compared to most companies in the industry.
Company B is overvalued. This could indicate that investors are expecting high future
growth for that company, but the investment is riskier overall.
FACTORS AFFECTING P/E RATIO
Growth in earnings and sales
This is one of the primary factors driving P/E ratios of stocks. Markets always prefer companies
that are able to grow their top-line and their bottom line at a rapid pace. This could be newer
markets or due to greater penetration of existing markets. The idea is that investors are willing to
pay a higher price for growing stocks than for non-growing stocks. That explains why stocks like
Motherson Sumi continue to get rich P/Es because they have proven consistent growth over a
period of time. When it comes to growth, what matters are not just the projections but what has
been delivered consistently?
Operating profits margins and net margins
Companies that are able to expand their operating margins (OPM) and their net margins (NPM)
consistently over time get better valuations in the market. That is because such companies are
showing momentum in converting growth into profits. OPM is given greater importance than
NPM.
Return on equity and return on capital employed
The P/E ratio of the stock will be ultimately be determined by the Return on Equity and
the Return on capital employed. Equity will be willing to pay a higher price only if you
earn substantially better returns on the capital. Normally, companies with a large debt
component or a large equity base will tend to have lower ROEs and also command
lower P/E ratios.
Macro conditions prevailing in the market
The impact varies from sector to sector . These are mainly anticipatory in nature. For
example,
● When rural incomes are likely to increase you will find the P/E ratio of two
wheelers, tractors and FMCG expanding.
● When the capital cycle is looking to turn around you will find the P/E ratio of
heavy equipment and capital goods companies turning around.
● When interest rates are trending lower, then rate sensitives like banks, realty
and NBFCs get better P/E valuations.
Stage of the cycle in case of commodities
This is very specific to commodities like steel, aluminium, copper, oil etc. Normally, you
will find that these commodity companies tend to command lower P/E ratios
compared to sectors like automobiles, IT, FMCG or pharma.
That is because, there is not much to differentiate and price is the only factors. But
you will find that the P/E ratios of these commodity companies tend to move up when
there is clear evidence of the global commodity cycle moving up.
Brands, distribution networks and other intangibles
P/E ratios are not just about tangibles on the income statement and balance sheet but
also about intangibles(qualitative factors,moat). Many companies are able to
differentiate and create an edge. For example,
Hindustan Unilever has created an edge through its brands while
ITC has created an edge through its unmatched distribution network. These
intangibles are a key factor in assigning a higher P/E ratio for select stocks.
Lower debt and lower equity base
Markets prefer companies that do not have too much debt on their balance
sheet. Higher debt means greater financial risk and lower coverage ratios. In
fact, if you look at the companies with higher than average P/E Ratio, they
are companies that are not leveraged too much and have a low equity base.
Eicher Motors , MRF
Dividend Theory
Dividend decision of the firm is yet another crucial area of financial management. The
important aspect of dividend policy is to determine the amount of earnings to be distributed
to shareholders and the amount to be retained in the firm.
ISSUES IN DIVIDEND POLICY
the objective of a dividend policy should be to maximize a shareholder’s return so that the
value of his investment is maximized. Shareholders’ return consists of two components:
dividends and capital gains.
DIVIDEND RELEVANCE: WALTER’S MODEL
Assumptions
● Internal financing The firm finances all investment through retained earnings; that is,
debt or new equity is not issued.
● Constant return and cost of capital The firm’s rate of return, r, and its cost of capital,
k, are constant.
● 100 per cent payout or retention All earnings are either distributed as dividends or
reinvested internally immediately.
● Constant EPS and DIV Beginning earnings and dividends never change. The values of
the earnings per share, EPS, and the dividend per share, DIV, may be changed in the
model to determine results, but any given values of EPS or DIV are assumed to remain
constant forever in determining a given value.
● Infinite time The firm has a very long or infinite life.
DIAS PRESENTATION.pptx

DIAS PRESENTATION.pptx

  • 1.
    IMPORTANCE OF PE RATIOSOF THE COMPANIES
  • 2.
    PE RATIO PE ratiois a metric that compares a company’s current stock price to its earnings per share, or EPS, which can be calculated based on historical data (for trailing PE) or forward-looking estimates (for forward PE). It's a standard part of stock research investors use to: ● Compare the stock prices of similar companies to find outliers. ● Determine if the stock is undervalued, appropriately priced or overvalued. ● Decide, based on its value, if they should buy, sell or hold any particular stock. ● “PE ratio” may sound technical, but it’s really just a comparison of how the public feels about a company (its stock price) and how well the company is actually doing (its EPS).
  • 3.
    Example A company postsstable profits quarter after quarter, and its projected profits are equally stable. If its stock price jumps but its earnings stay What happens to the intrinsic value of the company ? Does it change ? Why did the price increase then? If a company’s PE ratio is significantly higher than its peers what does it mean?
  • 4.
    It’s a measureof how much investors are paying for every Rs.1 of a company’s earnings. Imagine two similar companies in the same sector. One has a share price of Rs.100 and a PE ratio of 15. The other has a share price of Rs 50 and a PE ratio of 30. The first company’s share price may be higher, but a PE ratio of 15 means you’re only paying Rs. 15 for every Re.1 of the company’s earnings. Investors in the company with a PE ratio of 30 are paying Rs. 30 for Re 1 of earnings.
  • 5.
    How to CalculateP/E Ratios There are two main types of P/E ratio analysis: Trailing A trailing P/E analysis divides the cost per share by the company’s past 12 months of earnings (often referred to as the trailing twelve months or TTM). This method is the most commonly used approach because the data is objective — as long as the company has reported its earnings correctly and honestly, a trailing P/E ratio uses only concrete data, rather than subjective or projected data. However, because past earnings are only reported every quarter, and stock prices can change daily as the market evolves, the trailing P/E ratio will constantly change.
  • 6.
    Forward A forward P/Eanalysis uses forecasted earnings — how much a company expects to earn in the future. Forward P/E ratios are useful because a company’s past data is not always indicative of future performance. However, a forward P/E relies heavily on estimations from analysts and the company itself. A company may over or underestimate its future earnings as a way to toy with its P/E ratios and drive changes in investor behavior.
  • 7.
    PE ratio formula Themain formula used to calculate a company’s trailing P/E ratio is: P/E Ratio = Cost per Share / Earnings per Share In this formula: •Cost per share is the current trading price of a stock or how much it costs to buy one share in the company. •Earnings per share (EPS) is how much net profit the company sees each year, divided by the total number of outstanding shares (shares of common stock issued to investors). In a trailing P/E analysis, the earnings per share is based on the previous 12 months of earnings, while a future P/E analysis looks at projected earnings from analysts and the company itself.
  • 8.
    A company’s P/Eratio will be shown in a “#x” type of format (such as 20x or 15x) — this signifies how many times higher the stock price is compared to the earnings per share. Raymond March 2023 EPS= Rs 79.45 Current price is =Rs 1907 PE ratio= 24 One way to put it is that the stock is trading 24 times higher than the company’s earnings, or 24x.
  • 9.
    To truly understandthe value of a company’s P/E ratio, it needs to be compared to another company. Let’s look at the following table: Company A Company B Industry Average Cost per Share Rs30 Rs20 Earnings per Share Re1 Re0.50 P/E Ratio 30x 40x 30x Because Company B is cheaper per share, it is tempting to assume it is a better deal than Company A. However, Company A is cheaper because you are paying less for every $1 of earnings per year. Especially if we take into consideration that the industry average for these companies is 30x, Company A is the more “on par” investment — it is well-priced compared to most companies in the industry. Company B is overvalued. This could indicate that investors are expecting high future growth for that company, but the investment is riskier overall.
  • 11.
    FACTORS AFFECTING P/ERATIO Growth in earnings and sales This is one of the primary factors driving P/E ratios of stocks. Markets always prefer companies that are able to grow their top-line and their bottom line at a rapid pace. This could be newer markets or due to greater penetration of existing markets. The idea is that investors are willing to pay a higher price for growing stocks than for non-growing stocks. That explains why stocks like Motherson Sumi continue to get rich P/Es because they have proven consistent growth over a period of time. When it comes to growth, what matters are not just the projections but what has been delivered consistently? Operating profits margins and net margins Companies that are able to expand their operating margins (OPM) and their net margins (NPM) consistently over time get better valuations in the market. That is because such companies are showing momentum in converting growth into profits. OPM is given greater importance than NPM.
  • 12.
    Return on equityand return on capital employed The P/E ratio of the stock will be ultimately be determined by the Return on Equity and the Return on capital employed. Equity will be willing to pay a higher price only if you earn substantially better returns on the capital. Normally, companies with a large debt component or a large equity base will tend to have lower ROEs and also command lower P/E ratios. Macro conditions prevailing in the market The impact varies from sector to sector . These are mainly anticipatory in nature. For example, ● When rural incomes are likely to increase you will find the P/E ratio of two wheelers, tractors and FMCG expanding. ● When the capital cycle is looking to turn around you will find the P/E ratio of heavy equipment and capital goods companies turning around. ● When interest rates are trending lower, then rate sensitives like banks, realty and NBFCs get better P/E valuations.
  • 13.
    Stage of thecycle in case of commodities This is very specific to commodities like steel, aluminium, copper, oil etc. Normally, you will find that these commodity companies tend to command lower P/E ratios compared to sectors like automobiles, IT, FMCG or pharma. That is because, there is not much to differentiate and price is the only factors. But you will find that the P/E ratios of these commodity companies tend to move up when there is clear evidence of the global commodity cycle moving up. Brands, distribution networks and other intangibles P/E ratios are not just about tangibles on the income statement and balance sheet but also about intangibles(qualitative factors,moat). Many companies are able to differentiate and create an edge. For example, Hindustan Unilever has created an edge through its brands while ITC has created an edge through its unmatched distribution network. These intangibles are a key factor in assigning a higher P/E ratio for select stocks.
  • 14.
    Lower debt andlower equity base Markets prefer companies that do not have too much debt on their balance sheet. Higher debt means greater financial risk and lower coverage ratios. In fact, if you look at the companies with higher than average P/E Ratio, they are companies that are not leveraged too much and have a low equity base. Eicher Motors , MRF
  • 15.
    Dividend Theory Dividend decisionof the firm is yet another crucial area of financial management. The important aspect of dividend policy is to determine the amount of earnings to be distributed to shareholders and the amount to be retained in the firm. ISSUES IN DIVIDEND POLICY the objective of a dividend policy should be to maximize a shareholder’s return so that the value of his investment is maximized. Shareholders’ return consists of two components: dividends and capital gains.
  • 16.
    DIVIDEND RELEVANCE: WALTER’SMODEL Assumptions ● Internal financing The firm finances all investment through retained earnings; that is, debt or new equity is not issued. ● Constant return and cost of capital The firm’s rate of return, r, and its cost of capital, k, are constant. ● 100 per cent payout or retention All earnings are either distributed as dividends or reinvested internally immediately. ● Constant EPS and DIV Beginning earnings and dividends never change. The values of the earnings per share, EPS, and the dividend per share, DIV, may be changed in the model to determine results, but any given values of EPS or DIV are assumed to remain constant forever in determining a given value. ● Infinite time The firm has a very long or infinite life.

Editor's Notes

  • #4 the same (and no earnings increases are expected), the company’s intrinsic value didn’t change; the market’s perception of the company did.
  • #11 From the above chart it can be gauged that the P/E Ratio of the Sensex has been shifting from as low as 15X earnings to as high as 25X earnings. Of course, these are yearly averages and markets have seen much greater volatility during the year. For example in March 2003 and in March 2009, the index was available at 11-12 times P/E. Similarly, in Jan 2000 and in Jan 2008, the Sensex was valued at close to 28 times P/E. But, we get back to our core question of the factors that actually influence the P/E ratio of a stock