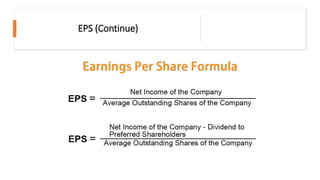
What is Fundamental Analysis?
• Fundamental analysis is the process of evaluating a security to make forecasts
about its future price. For a stock, fundamental analysis typically includes
reviewing many elements related to stock prices, including:
SHAORT QUESTIONS
Q: What is the benefit of using fundamental analysis?
• Fundamental analysis looks at the company’s financials and
industry to determine if it is a good long-term investment.
Q: What factors influence fundamental analysis?
• Factors that influence fundamental analysis include the
economy, industry, management and the firm’s financial
condition.
• Performance of the overall industry the company
participates in
• Domestic political conditions
• Relevant trade agreements and external politics
• The company’s financial statements
• The company’s press releases
• News releases related to the company and its
business
• Competitor analysis
• If some fundamental indicators of a company
imply a negative impact, this is likely to
eventually be reflected in its share price. On the
other hand, if positive data is released, like a
favorable earnings report, this can boost the
stock price of the respective company.
• Here are some examples of key company
performance statistics that are commonly
used to perform fundamental analysis on
stocks:
• Earnings per share (EPS)
• Price-to-earnings (P/E) ratio
• Price-to-book (P/B) ratio
• Return on equity (ROE)
• Beta
• Each of these key performance statistics gives
information that is helpful to conduct a
fundamental stock price analysis. You can
then buy the stock on the assumption that the
price will increase if your analysis suggests
the price of the stock should rise from its
present level.
Example of Fundamental
Analysis
• Although there’s no standard way to do
fundamental analysis, since stock trading
is not as accurate as a math problem, you
can follow certain guidelines. Also, the
same information in one industry and
stock may not mean the exact thing in
another. A few of the most important
statistics used in fundamental stock
analysis are described in greater detail
below.
EPS
• Earnings per share relate to the portion of a company’s
profit allocated to each of the company’s shares. The EPS is an
indication of the firm’s profitability. The higher the earnings per share,
the healthier the company, so the better the stock should perform for
an investor.
• At the same time, if a stock’s earnings per share are unusually high
for its company’s industry, this could mean one or more of the
following things:
• Earnings are expected to decrease back to more normal levels.
• The price of the stock could increase to normalize the stock’s EPS.
• An adverse condition exists for the company that has depressed its
share price.
EPS (Continue)
Diluted EPS
While EPS just considers the number of common shares issued by a company, many
fundamental analysts prefer to look at diluted EPS that also includes convertible securities.
Diluted EPS considers what would happen if dilutive securities were exercised. Dilutive
securities are securities that are not common stock but can be converted to common stock if
the holder exercises that option. If converted, dilutive securities effectively increase the
weighted number of shares outstanding, which decreases EPS.
• Diluted earnings per share (diluted EPS) calculates
a company’s earnings per share if all convertible
securities were converted.
• Dilutive securities aren’t common stock, but instead
securities that can be converted to common stock.
• Converting these securities decreases EPS, thus,
diluted EPS tends to always be lower than EPS.
• Dilutive EPS is considered a conservative metric
because it indicates a worst-case scenario in terms of
EPS.
• Formula
• Diluted EPS=Net Income−Preferred Dividends/WAS
O+CDS
• where:
• EPS=Earnings per share
• WASO=Weighted Average Shares Outstanding
• CDS=Conversion of dilutive securities​
Price To
Earnings
Ratio
• The price-to-earnings (P/E) ratio is used to
evaluate companies and determine if they are
under or overvalued. The ratio is computed by
taking the share price of the company and
dividing that by its earnings per share. The P/E
ratio shows whether a share of stock pays
well compared to its price.
• For example, imagine that the price per share is
$30 and the stock pays $2 earnings per share.
The P/E ratio of the stock is computed as
follows:
• 30 / 2 = 15
Price To
Earnings
Ratio
(Cont)
• The lower the P/E ratio, the higher the
earnings compared to the stock price, and
the more attractive the stock. Furthermore,
an unusually low P/E ratio could show
extra potential for a future price rise.
• If the P/E ratio is too low, below 10 for
example, this means that the price per
share seems low compared to the
company’s earnings especially if
competing firms typically have higher P/E
ratios. This might mean that the stock
could be undervalued, so its price can
increase significantly. The opposite holds
true for high P/E ratios.
Price-to-Book Ratio
• The price-to-book (P/B) ratio is a financial ratio that shows how
much the stock is worth compared to the book value of the company.
It is computed by taking the price per share and dividing that by the
book value per share.
• For example, if a company worth $10 million has 500,000 shares
outstanding, it will have a book value per share of:
• $10,000,000 / 500,000 shares = $20 book value per share
• If its stock trades at $80 per share, then the P/B ratio is:
• $80 / $20 = 4 P/B ratio
• If the P/B ratio is more than 1, this means the market’s consensus is
that the stock will grow at a faster pace than its book value suggests,
which is the reason why its price is higher than its book value. In
some cases, you can see very high P/B ratios of 100 or more. High
P/B ratios are often seen in high growth stocks.
Return on Equity (ROE)
• The return on equity is a measurement that determines how
efficient a company is when using its shareholders’
equity. You calculate the ROE by dividing the shareholders’
equity by the company’s net income. If a company has
generated $5 million this year and its shareholder’s equity is
$50 million, this means the ROE is:
• $5,000,000 / $50,000,000 = 0.1 or 10%
• Note that analysts typically display the ROE result as a
percentage. The higher the ROE, the more efficient the
company is. If a company generates a less than $5 million
income this year (say $2 million) with the same shareholders’
equity, this means it is less efficient:
• Note that analysts typically display the ROE result as a
percentage. The higher the ROE, the more efficient the
company is. If a company generates a less than $5 million
income this year (say $2 million) with the same shareholders’
equity, this means it is less efficient:
• $2,000,000 / $50,000,000 = 0.04 or 4%
• Here, the company has a lower ROE given the same
shareholder’s equity, so it is less efficient in using its
shareholders’ equity to generate income.
Beta (Systematic Risk)
• The beta coefficient or market beta provides information about
how the stock’s price correlates on average to the entire
market. This can be computed by comparing the stock to a
benchmark index like the S&P 500 or the NASDAQ indices. The
beta usually varies between -1 and 1. Sometimes values can
go much lower than -1 or much higher than 1.
• Values above 0 mean that the stock correlates positively
compared to the benchmark index. The higher the beta, the
higher the correlation. A higher beta also usually means that
the volatility of that stock is higher as well, so the risk of
holding it can be greater.
• Values below 0 mean that the stock is inversely correlated to
the benchmark index. The lower the beta goes below 0, the
higher the inverse correlation between the stock and the market
index.

Fundamental analysis Defination and Examples..pptx

  • 1.
    What is FundamentalAnalysis? • Fundamental analysis is the process of evaluating a security to make forecasts about its future price. For a stock, fundamental analysis typically includes reviewing many elements related to stock prices, including:
  • 2.
    SHAORT QUESTIONS Q: Whatis the benefit of using fundamental analysis? • Fundamental analysis looks at the company’s financials and industry to determine if it is a good long-term investment. Q: What factors influence fundamental analysis? • Factors that influence fundamental analysis include the economy, industry, management and the firm’s financial condition.
  • 3.
    • Performance ofthe overall industry the company participates in • Domestic political conditions • Relevant trade agreements and external politics • The company’s financial statements • The company’s press releases • News releases related to the company and its business • Competitor analysis • If some fundamental indicators of a company imply a negative impact, this is likely to eventually be reflected in its share price. On the other hand, if positive data is released, like a favorable earnings report, this can boost the stock price of the respective company.
  • 4.
    • Here aresome examples of key company performance statistics that are commonly used to perform fundamental analysis on stocks: • Earnings per share (EPS) • Price-to-earnings (P/E) ratio • Price-to-book (P/B) ratio • Return on equity (ROE) • Beta • Each of these key performance statistics gives information that is helpful to conduct a fundamental stock price analysis. You can then buy the stock on the assumption that the price will increase if your analysis suggests the price of the stock should rise from its present level.
  • 5.
    Example of Fundamental Analysis •Although there’s no standard way to do fundamental analysis, since stock trading is not as accurate as a math problem, you can follow certain guidelines. Also, the same information in one industry and stock may not mean the exact thing in another. A few of the most important statistics used in fundamental stock analysis are described in greater detail below.
  • 6.
    EPS • Earnings pershare relate to the portion of a company’s profit allocated to each of the company’s shares. The EPS is an indication of the firm’s profitability. The higher the earnings per share, the healthier the company, so the better the stock should perform for an investor. • At the same time, if a stock’s earnings per share are unusually high for its company’s industry, this could mean one or more of the following things: • Earnings are expected to decrease back to more normal levels. • The price of the stock could increase to normalize the stock’s EPS. • An adverse condition exists for the company that has depressed its share price.
  • 7.
  • 8.
    Diluted EPS While EPSjust considers the number of common shares issued by a company, many fundamental analysts prefer to look at diluted EPS that also includes convertible securities. Diluted EPS considers what would happen if dilutive securities were exercised. Dilutive securities are securities that are not common stock but can be converted to common stock if the holder exercises that option. If converted, dilutive securities effectively increase the weighted number of shares outstanding, which decreases EPS.
  • 9.
    • Diluted earningsper share (diluted EPS) calculates a company’s earnings per share if all convertible securities were converted. • Dilutive securities aren’t common stock, but instead securities that can be converted to common stock. • Converting these securities decreases EPS, thus, diluted EPS tends to always be lower than EPS. • Dilutive EPS is considered a conservative metric because it indicates a worst-case scenario in terms of EPS. • Formula • Diluted EPS=Net Income−Preferred Dividends/WAS O+CDS • where: • EPS=Earnings per share • WASO=Weighted Average Shares Outstanding • CDS=Conversion of dilutive securities​
  • 10.
    Price To Earnings Ratio • Theprice-to-earnings (P/E) ratio is used to evaluate companies and determine if they are under or overvalued. The ratio is computed by taking the share price of the company and dividing that by its earnings per share. The P/E ratio shows whether a share of stock pays well compared to its price. • For example, imagine that the price per share is $30 and the stock pays $2 earnings per share. The P/E ratio of the stock is computed as follows: • 30 / 2 = 15
  • 11.
    Price To Earnings Ratio (Cont) • Thelower the P/E ratio, the higher the earnings compared to the stock price, and the more attractive the stock. Furthermore, an unusually low P/E ratio could show extra potential for a future price rise. • If the P/E ratio is too low, below 10 for example, this means that the price per share seems low compared to the company’s earnings especially if competing firms typically have higher P/E ratios. This might mean that the stock could be undervalued, so its price can increase significantly. The opposite holds true for high P/E ratios.
  • 12.
    Price-to-Book Ratio • Theprice-to-book (P/B) ratio is a financial ratio that shows how much the stock is worth compared to the book value of the company. It is computed by taking the price per share and dividing that by the book value per share. • For example, if a company worth $10 million has 500,000 shares outstanding, it will have a book value per share of: • $10,000,000 / 500,000 shares = $20 book value per share • If its stock trades at $80 per share, then the P/B ratio is: • $80 / $20 = 4 P/B ratio • If the P/B ratio is more than 1, this means the market’s consensus is that the stock will grow at a faster pace than its book value suggests, which is the reason why its price is higher than its book value. In some cases, you can see very high P/B ratios of 100 or more. High P/B ratios are often seen in high growth stocks.
  • 13.
    Return on Equity(ROE) • The return on equity is a measurement that determines how efficient a company is when using its shareholders’ equity. You calculate the ROE by dividing the shareholders’ equity by the company’s net income. If a company has generated $5 million this year and its shareholder’s equity is $50 million, this means the ROE is: • $5,000,000 / $50,000,000 = 0.1 or 10% • Note that analysts typically display the ROE result as a percentage. The higher the ROE, the more efficient the company is. If a company generates a less than $5 million income this year (say $2 million) with the same shareholders’ equity, this means it is less efficient:
  • 14.
    • Note thatanalysts typically display the ROE result as a percentage. The higher the ROE, the more efficient the company is. If a company generates a less than $5 million income this year (say $2 million) with the same shareholders’ equity, this means it is less efficient: • $2,000,000 / $50,000,000 = 0.04 or 4% • Here, the company has a lower ROE given the same shareholder’s equity, so it is less efficient in using its shareholders’ equity to generate income.
  • 15.
    Beta (Systematic Risk) •The beta coefficient or market beta provides information about how the stock’s price correlates on average to the entire market. This can be computed by comparing the stock to a benchmark index like the S&P 500 or the NASDAQ indices. The beta usually varies between -1 and 1. Sometimes values can go much lower than -1 or much higher than 1. • Values above 0 mean that the stock correlates positively compared to the benchmark index. The higher the beta, the higher the correlation. A higher beta also usually means that the volatility of that stock is higher as well, so the risk of holding it can be greater. • Values below 0 mean that the stock is inversely correlated to the benchmark index. The lower the beta goes below 0, the higher the inverse correlation between the stock and the market index.