Download to read offline


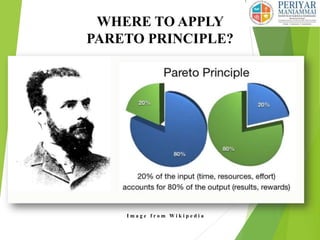

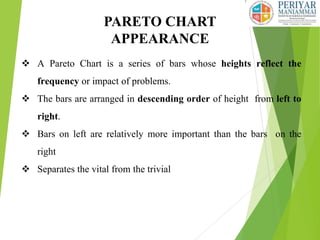
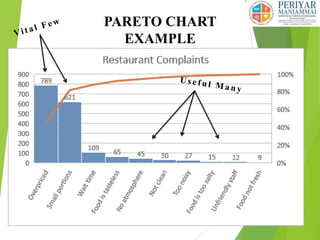
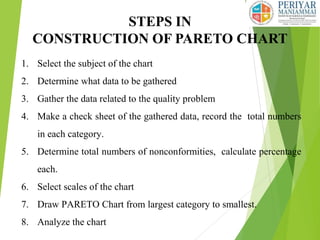


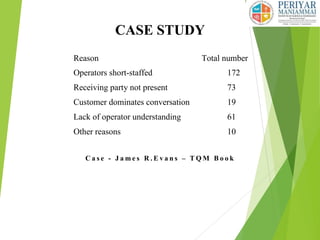
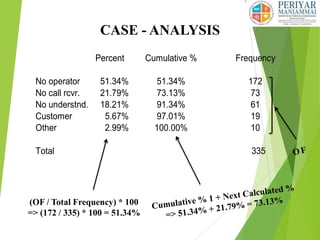
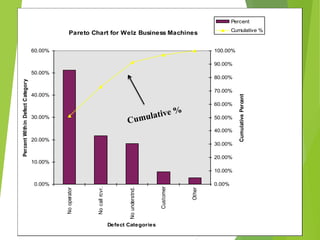
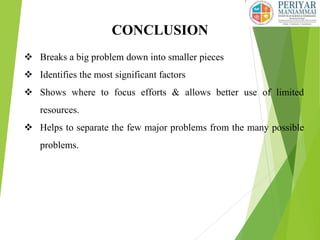


The document discusses quality management and introduces the Pareto diagram, one of the seven basic tools of quality. It explains that a Pareto diagram is a type of bar chart that follows the Pareto principle, where a small number of causes often account for the majority of problems. The document provides steps for constructing a Pareto diagram and gives an example. It also discusses applications of the Pareto principle in problem solving, to-do lists, and relationships. A case study example is presented and analyzed.


![7 qc tools[1] to print](https://cdn.slidesharecdn.com/ss_thumbnails/7qctools1toprint-191017092858-thumbnail.jpg?width=640&height=640&fit=bounds)


