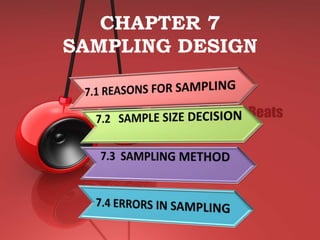
CHAPTER 7
SAMPLING DESIGN
SAMPLING
SAMPLING

The process of selecting a
sufficient number of elements from
the population, so that results from
analyzing the sample are
generalizable to the population.
REASONS
FOR
SAMPLING
Less
cost

Less
time

Less
errors due
to less
fatigue

Destruction
of elements
avoided
SAMPLE SIZE DECISION
There are variety sample size decision that
available . The choice can be defend on the
following:
 Population
 The element
 Population frame
 Sample
 Sampling unit
 The subject
SAMPLE SIZE DECISION
a) Population
-Refer to the entire group of people, events or things
of interest that the population that the researches
wishes to investigate.
b) Element
- Single member of the population. The census is a
count of all elements in the human population.
c) Population frame
- the listing of all the element in the population
from which the sample is drawn. It is also known
as sampling frame.
SAMPLE SIZE DECISION
d) Sample
-Subset of the population. It is a subgroup of
the population selected using sampling
method or design.
e) Sampling unit
-the element or set of the elements that is
available for selection in some stage of the
sampling process.
f) Subject
-a subject is a single member of the sample.
The sampling
process
Define the
population
Execute the
sampling
process

Determine
the
appropriate
sample size

Determine
the sample
frame

Determine
the sampling
design
Sample Size
Most research

Sub-samples

• > 30 < 500
are
appropriate

• Min 30 for
each
category

Multivariate
research

Experimental
research

• At least
10 times
more than
the
number
of
variables

• Can be
low as
10 to 20
Sample size
Precision

• How close the estimate to
the true population
characteristics with low
margin of error

Confidence

• How certain the estimate will
really hold true for the
population.
• Commonly accepted confidence
level ≤0.05 (95% confidence)
Population
Geographical

Boundaries
&
Time

Elements

Defined
in
terms
Sample Frame
Physical
representation of
all the elements in
the population
from which the
sample is drawn

Make sure that
sample frame the
latest and most upto-date to avoid
coverage error
Sampling Design
Target population
of focus to the
study

The exact
parameters need
to be investigated

Availability of
sampling frame

Sample size
needed

Costs associated
to the sampling
design

Time frame
available for data
collection
Sampling Design
Probability
sampling

Nonprobability
sampling
SAMPLING TECHNIQUES
Probability Sampling
Simple Random Sampling

Systematic Sampling

Stratified Random Sampling

Cluster Sampling
Simple Random Sampling
PROCEDURE

– Each element has a known and
equal chance of being selected
CHARACTERISTICS
– Highly generalizable
– Easily understood
– Reliable
population
necessary

frame
Systematic Sampling
PROCEDURE

– Each nth element, starting
with random choice of an
element between 1 and n
CHARACTERISTICS

– Easier than simple random
sampling
– Systematic biases when
Cluster Sampling
PROCEDURE
– Divide of population in clusters
– Random selection of clusters
– Include all elements from selected clusters

CHARACTERISTICS
– Intercluster homogeneity
– Intracluster heterogeneity
– Easy and cost efficient
– Low correspondence with reality
Stratified Sampling
PROCEDURE
– The process of dividing members
of
the
population
into
homogeneous subgroups before
sampling
– There are two types Cof stratified
Stratum
A
B
random sampling:
Population size
100
200
300
1/2
1/2
•Sampling fraction
Proportionate 1/2
Final sample size

50

100

150
•Disproportionate
Stratum

A

B

C

Population size

100

200

300

Sampling fraction

1/2

¾

1/3

Final sample size

50

150

100

CHARACTERISTICS
– Interstrata heterogeneity
– Intrastratum homogeneity
– Includes all relevant
subpopulations
Nonprobability Sampling
Convenienc
e Sampling

Members of the population are
chosen based on their relative ease
of access.

Judgment
Sampling

The researcher chooses the sample
based on who they think would be
appropriate for the study.

Quota
Sampling

A quota is established (say 65%
women) and researchers are free to
choose any respondent they wish as
long as the quota is met.
5 Common Sampling Errors
o POPULATION SPECIFICATION ERROR
o SAMPLE FRAME ERROR
o SELECTION ERROR
o NON-RESPONSE

o SAMPLING ERRORS
Measurement of
Variables

Operational definition
Scales
Measurement
the
assignment of
numbers or
other symbols
to
characteristics
(or attributes)
of objects
according to a
pre-specified
set of rules.

(Characteristics of)
Objects

Type of
variables

Object – house,
countries,
restaurants.

One lends itself
to objective and
precise
measurement;

Examples of
characteristics of
objects are
arousal seeking
tendency,
achievement
motivation,
organizational
effectiveness

The other is
more nebulous
and does not
lend itself to
accurate
measurement
because of its
abstract and
subjective
nature.
Operationalizing Concepts
Operationalizing
is done by looking
at the
behavioural
dimensions, facets,
or properties
denoted by the
concept.

Operationalizing
concepts:
reduction of
abstract concepts
to render them
measurable in a
tangible way.

26
Example

27
Scale
Tool or mechanism by
which individuals are
distinguished as to how
they differ from one
another on the variables
of interest to our study.

28
4 TYPES
OF SCALES
Nominal Scale
•

A nominal scale is one that allows the researcher
to assign subjects to certain categories or
groups.

•

What is your department?
O Marketing
O Maintenance
O Finance
O Production
O Servicing
O Personnel
O Sales
O Public Relations O
Accounting

•

What is your gender?
O Male
O Female
30
Ordinal Scale

Ordinal scale: not only categorizes variables in
such a way as to denote differences among
various categories, it also rank-orders
categories in some meaningful way.
What is the highest level of education you
have completed?
O
Less than High School
O
High School
O
College Degree
O
Masters Degree
O
Doctoral Degree
31
Interval Scale
• Interval scale: whereas the nominal
scale allows us only to qualitatively
distinguish groups by categorizing
them into mutually exclusive and
collectively exhaustive sets, and the
ordinal scale to rank-order the
preferences, the interval scale lets us
measure the distance between any two
points on the scale.
32
• Circle the number that represents your feelings at this particular
moment best. There are no right or wrong answers. Please answer every
question.
1. I invest more in my work than I get out of it
I disagree completely

1 2 3 4 5 I agree completely

2. I exert myself too much considering what I get back in return
I disagree completely

1 2 3 4 5 I agree completely

3. For the efforts I put into the organization, I get much in return
I disagree completely

1 2 3 4 5 I agree completely
33
Ratio scale
• Indicates not only the
magnitude of the differences
but also their proportion.
THE END!!!
THANK YOU FOR YOUR
CONCENTRATION!!!

7 dan 8

  • 1.
  • 2.
  • 3.
    SAMPLING The process ofselecting a sufficient number of elements from the population, so that results from analyzing the sample are generalizable to the population.
  • 4.
  • 5.
  • 6.
    SAMPLE SIZE DECISION Thereare variety sample size decision that available . The choice can be defend on the following:  Population  The element  Population frame  Sample  Sampling unit  The subject
  • 7.
    SAMPLE SIZE DECISION a)Population -Refer to the entire group of people, events or things of interest that the population that the researches wishes to investigate. b) Element - Single member of the population. The census is a count of all elements in the human population. c) Population frame - the listing of all the element in the population from which the sample is drawn. It is also known as sampling frame.
  • 8.
    SAMPLE SIZE DECISION d)Sample -Subset of the population. It is a subgroup of the population selected using sampling method or design. e) Sampling unit -the element or set of the elements that is available for selection in some stage of the sampling process. f) Subject -a subject is a single member of the sample.
  • 9.
    The sampling process Define the population Executethe sampling process Determine the appropriate sample size Determine the sample frame Determine the sampling design
  • 10.
    Sample Size Most research Sub-samples •> 30 < 500 are appropriate • Min 30 for each category Multivariate research Experimental research • At least 10 times more than the number of variables • Can be low as 10 to 20
  • 11.
    Sample size Precision • Howclose the estimate to the true population characteristics with low margin of error Confidence • How certain the estimate will really hold true for the population. • Commonly accepted confidence level ≤0.05 (95% confidence)
  • 12.
  • 13.
    Sample Frame Physical representation of allthe elements in the population from which the sample is drawn Make sure that sample frame the latest and most upto-date to avoid coverage error
  • 14.
    Sampling Design Target population offocus to the study The exact parameters need to be investigated Availability of sampling frame Sample size needed Costs associated to the sampling design Time frame available for data collection
  • 15.
  • 16.
    SAMPLING TECHNIQUES Probability Sampling SimpleRandom Sampling Systematic Sampling Stratified Random Sampling Cluster Sampling
  • 17.
    Simple Random Sampling PROCEDURE –Each element has a known and equal chance of being selected CHARACTERISTICS – Highly generalizable – Easily understood – Reliable population necessary frame
  • 18.
    Systematic Sampling PROCEDURE – Eachnth element, starting with random choice of an element between 1 and n CHARACTERISTICS – Easier than simple random sampling – Systematic biases when
  • 19.
    Cluster Sampling PROCEDURE – Divideof population in clusters – Random selection of clusters – Include all elements from selected clusters CHARACTERISTICS – Intercluster homogeneity – Intracluster heterogeneity – Easy and cost efficient – Low correspondence with reality
  • 20.
    Stratified Sampling PROCEDURE – Theprocess of dividing members of the population into homogeneous subgroups before sampling – There are two types Cof stratified Stratum A B random sampling: Population size 100 200 300 1/2 1/2 •Sampling fraction Proportionate 1/2 Final sample size 50 100 150
  • 21.
    •Disproportionate Stratum A B C Population size 100 200 300 Sampling fraction 1/2 ¾ 1/3 Finalsample size 50 150 100 CHARACTERISTICS – Interstrata heterogeneity – Intrastratum homogeneity – Includes all relevant subpopulations
  • 22.
    Nonprobability Sampling Convenienc e Sampling Membersof the population are chosen based on their relative ease of access. Judgment Sampling The researcher chooses the sample based on who they think would be appropriate for the study. Quota Sampling A quota is established (say 65% women) and researchers are free to choose any respondent they wish as long as the quota is met.
  • 23.
    5 Common SamplingErrors o POPULATION SPECIFICATION ERROR o SAMPLE FRAME ERROR o SELECTION ERROR o NON-RESPONSE o SAMPLING ERRORS
  • 24.
  • 25.
    Measurement the assignment of numbers or othersymbols to characteristics (or attributes) of objects according to a pre-specified set of rules. (Characteristics of) Objects Type of variables Object – house, countries, restaurants. One lends itself to objective and precise measurement; Examples of characteristics of objects are arousal seeking tendency, achievement motivation, organizational effectiveness The other is more nebulous and does not lend itself to accurate measurement because of its abstract and subjective nature.
  • 26.
    Operationalizing Concepts Operationalizing is doneby looking at the behavioural dimensions, facets, or properties denoted by the concept. Operationalizing concepts: reduction of abstract concepts to render them measurable in a tangible way. 26
  • 27.
  • 28.
    Scale Tool or mechanismby which individuals are distinguished as to how they differ from one another on the variables of interest to our study. 28
  • 29.
  • 30.
    Nominal Scale • A nominalscale is one that allows the researcher to assign subjects to certain categories or groups. • What is your department? O Marketing O Maintenance O Finance O Production O Servicing O Personnel O Sales O Public Relations O Accounting • What is your gender? O Male O Female 30
  • 31.
    Ordinal Scale Ordinal scale:not only categorizes variables in such a way as to denote differences among various categories, it also rank-orders categories in some meaningful way. What is the highest level of education you have completed? O Less than High School O High School O College Degree O Masters Degree O Doctoral Degree 31
  • 32.
    Interval Scale • Intervalscale: whereas the nominal scale allows us only to qualitatively distinguish groups by categorizing them into mutually exclusive and collectively exhaustive sets, and the ordinal scale to rank-order the preferences, the interval scale lets us measure the distance between any two points on the scale. 32
  • 33.
    • Circle thenumber that represents your feelings at this particular moment best. There are no right or wrong answers. Please answer every question. 1. I invest more in my work than I get out of it I disagree completely 1 2 3 4 5 I agree completely 2. I exert myself too much considering what I get back in return I disagree completely 1 2 3 4 5 I agree completely 3. For the efforts I put into the organization, I get much in return I disagree completely 1 2 3 4 5 I agree completely 33
  • 34.
    Ratio scale • Indicatesnot only the magnitude of the differences but also their proportion.
  • 35.
    THE END!!! THANK YOUFOR YOUR CONCENTRATION!!!