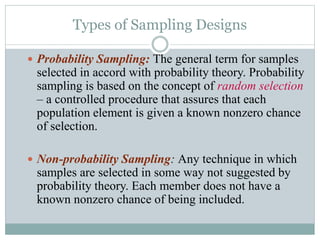
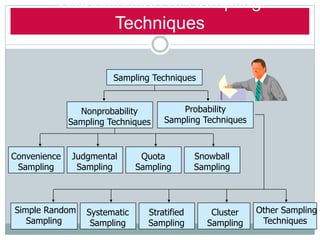
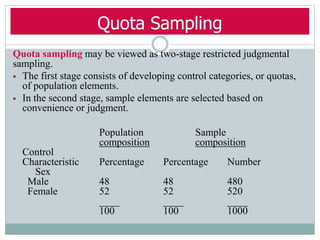
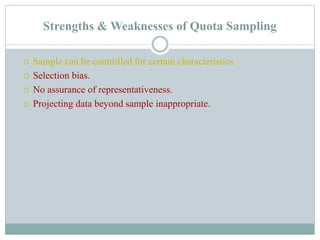
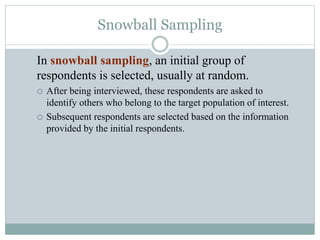
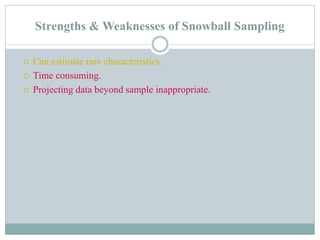
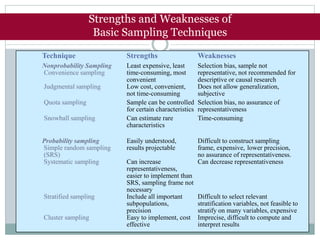
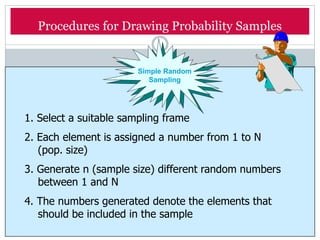
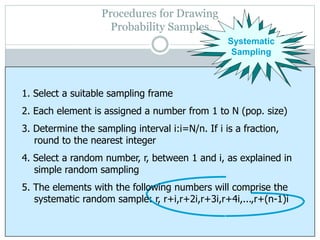
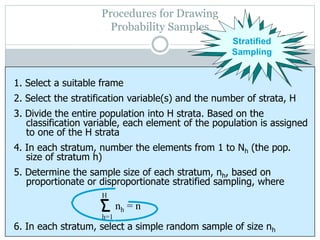
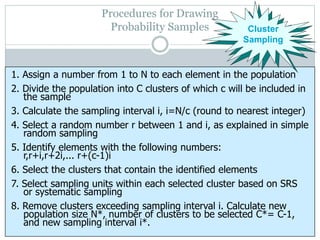
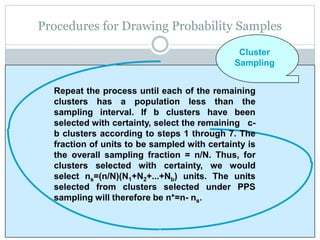
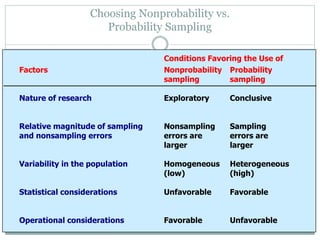
TYPES OF SAMPLING
Prepared by
Manoj Xavier
Research Scholar
Reg.No. 69/2016
M.G. University
Kottayam
Types of Sampling Designs
 Probability Sampling: The general term for samples
selected in accord with probability theory. Probability
sampling is based on the concept of random selection
– a controlled procedure that assures that each
population element is given a known nonzero chance
of selection.
 Non-probability Sampling: Any technique in which
samples are selected in some way not suggested by
probability theory. Each member does not have a
known nonzero chance of being included.
Classification of Sampling
Techniques
Sampling Techniques
Nonprobability
Sampling Techniques
Probability
Sampling Techniques
Convenience
Sampling
Judgmental
Sampling
Quota
Sampling
Snowball
Sampling
Systematic
Sampling
Stratified
Sampling
Cluster
Sampling
Other Sampling
Techniques
Simple Random
Sampling
Nonprobability Samples
 With a subjective approach like nonprobability
sampling, the probability of selecting population
elements is unknown.
 There is a greater opportunity for bias to enter the
sample and distort findings. We cannot estimate any
range within which to expect the population
parameter.
 Despite these disadvantages, there are practical
reasons to use nonprobability samples.
Nonprobability Samples
Cost
Feasibility
Time
No need to
generalize
Limited
objectives
When the research does not require generalization to a population parameter, then there is
no need to ensure that the sample fully reflects the population. The researcher may have
limited objectives such as those in exploratory research. It is less expensive to use
non-probability sampling. It also requires less time. Finally, a list may not be available.
Nonprobability Sampling Methods
Convenience
Judgment
Quota
Snowball
Convenience sampling.
Convenience Sampling
Non probability samples that are unrestricted are called
convenient samples.
Convenience sampling attempts to obtain a sample of
convenient elements. Often, respondents are selected
because they happen to be in the right place at the right
time.
 use of students, and members of social organizations
 mall intercept interviews without qualifying the
respondents
 “people on the street” interviews
Strengths & Weaknesses of Convenient Sampling
 Least expensive.
 Least time-consuming.
 Most convenient.
 Selection bias.
 Sample not representative.
 Not recommended for descriptive or causal research.
Judgmental Sampling
Judgmental sampling is a form of convenience sampling
in which the population elements are selected based on
the judgment of the researcher.
Strengths & Weaknesses of Judgmental Sampling
 Low cost.
 Not time consuming.
 Useful for some types of forecasting.
 Does not allow generalization.
 Subjective, may make the sample unrepresentative.
Quota Sampling
Quota sampling may be viewed as two-stage restricted judgmental
sampling.
 The first stage consists of developing control categories, or quotas,
of population elements.
 In the second stage, sample elements are selected based on
convenience or judgment.
Population Sample
composition composition
Control
Characteristic Percentage Percentage Number
Sex
Male 48 48 480
Female 52 52 520
____ ____ ____
100 100 1000
Strengths & Weaknesses of Quota Sampling
 Sample can be controlled for certain characteristics.
 Selection bias.
 No assurance of representativeness.
 Projecting data beyond sample inappropriate.
Snowball Sampling
In snowball sampling, an initial group of
respondents is selected, usually at random.
 After being interviewed, these respondents are asked to
identify others who belong to the target population of interest.
 Subsequent respondents are selected based on the information
provided by the initial respondents.
Strengths & Weaknesses of Snowball Sampling
 Can estimate rare characteristics.
 Time consuming.
 Projecting data beyond sample inappropriate.
Simple Random Sampling
 Each element in the population has a known and equal
probability of selection.
 Each possible sample of a given size (n) has a known
and equal probability of being the sample actually
selected.
 This implies that every element is selected
independently of every other element.
Strengths & Weaknesses of Simple Random Sampling
 Easily understood.
 Results projectable.
 Difficult to construct sampling frame.
 Expensive. Often due to dispersed respondents.
Systematic sampling
Systematic Sampling
 The sample is chosen by selecting a random starting
point and then picking every ith element in succession
from the sampling frame.
 The sampling interval, i, is determined by dividing the
population size N by the sample size n and rounding to
the nearest integer.
For example, there are 100,000 elements in the population and a
sample of 1,000 is desired. In this case the sampling interval, i,
is 100. A random number between 1 and 100 is selected. If, for
example, this number is 23, the sample consists of elements 23,
123, 223, 323, 423, 523, and so on.
Strengths & Weaknesses of Systematic Sampling
 Can increase representativeness.
 Easier to implement than SRS.
 Can decrease representativeness. Must be particularly concerned
with possible ordering in the population.
Stratified sampling
Stratified Sampling
 A two-step process in which the population is
partitioned into subpopulations, or strata.
 The strata should be mutually exclusive and collectively
exhaustive in that every population element should be
assigned to one and only one stratum and no population
elements should be omitted.
 Next, elements are selected from each stratum by a
random procedure, usually SRS.
 A major objective of stratified sampling is to increase
precision without increasing cost.
Stratified Sampling
 The elements within a stratum should be as homogeneous as possible,
but the elements in different strata should be as heterogeneous as
possible.
 The stratification variables should also be closely related to the
characteristic of interest.
 Finally, the variables should decrease the cost of the stratification
process by being easy to measure and apply.
 In proportionate stratified sampling, the size of the sample drawn from
each stratum is proportionate to the relative size of that stratum in the
total population.
 In disproportionate stratified sampling, the size of the sample from
each stratum is proportionate to the relative size of that stratum and to
the standard deviation of the distribution of the characteristic of
interest among all the elements in that stratum.
Strengths & Weaknesses of Stratified Sampling
 Includes all important sub-populations.
 Precision.
 Expensive.
 Difficult to select relevant stratification variables.
Cluster sampling
Cluster Sampling
 The target population is first divided into mutually
exclusive and collectively exhaustive subpopulations, or
clusters.
 Then a random sample of clusters is selected, based on a
probability sampling technique such as SRS.
 For each selected cluster, either all the elements are
included in the sample (one-stage) or a sample of elements
is drawn probabilistically (two-stage).
 Elements within a cluster should be as heterogeneous as
possible, but clusters themselves should be as
homogeneous as possible. Ideally, each cluster should be a
small-scale representation of the population.
Stratified Vs Cluster Sampling
Technique Strengths Weaknesses
Nonprobability Sampling
Convenience sampling
Least expensive, least
time-consuming, most
convenient
Selection bias, sample not
representative, not recommended for
descriptive or causal research
Judgmental sampling Low cost, convenient,
not time-consuming
Does not allow generalization,
subjective
Quota sampling Sample can be controlled
for certain characteristics
Selection bias, no assurance of
representativeness
Snowball sampling Can estimate rare
characteristics
Time-consuming
Probability sampling
Simple random sampling
(SRS)
Easily understood,
results projectable
Difficult to construct sampling
frame, expensive, lower precision,
no assurance of representativeness.
Systematic sampling Can increase
representativeness,
easier to implement than
SRS, sampling frame not
necessary
Can decrease representativeness
Stratified sampling Include all important
subpopulations,
precision
Difficult to select relevant
stratification variables, not feasible to
stratify on many variables, expensive
Cluster sampling Easy to implement, cost
effective
Imprecise, difficult to compute and
interpret results
Strengths and Weaknesses of
Basic Sampling Techniques
Procedures for Drawing Probability Samples
Simple Random
Sampling
1. Select a suitable sampling frame
2. Each element is assigned a number from 1 to N
(pop. size)
3. Generate n (sample size) different random numbers
between 1 and N
4. The numbers generated denote the elements that
should be included in the sample
Procedures for Drawing
Probability Samples
Systematic
Sampling
1. Select a suitable sampling frame
2. Each element is assigned a number from 1 to N (pop. size)
3. Determine the sampling interval i:i=N/n. If i is a fraction,
round to the nearest integer
4. Select a random number, r, between 1 and i, as explained in
simple random sampling
5. The elements with the following numbers will comprise the
systematic random sample: r, r+i,r+2i,r+3i,r+4i,...,r+(n-1)i
1. Select a suitable frame
2. Select the stratification variable(s) and the number of strata, H
3. Divide the entire population into H strata. Based on the
classification variable, each element of the population is assigned
to one of the H strata
4. In each stratum, number the elements from 1 to Nh (the pop.
size of stratum h)
5. Determine the sample size of each stratum, nh, based on
proportionate or disproportionate stratified sampling, where
6. In each stratum, select a simple random sample of size nh
Procedures for Drawing
Probability Samples
nh = n
h=1
H
Stratified
Sampling
Procedures for Drawing
Probability Samples Cluster
Sampling
1. Assign a number from 1 to N to each element in the population
2. Divide the population into C clusters of which c will be included in
the sample
3. Calculate the sampling interval i, i=N/c (round to nearest integer)
4. Select a random number r between 1 and i, as explained in simple
random sampling
5. Identify elements with the following numbers:
r,r+i,r+2i,... r+(c-1)i
6. Select the clusters that contain the identified elements
7. Select sampling units within each selected cluster based on SRS
or systematic sampling
8. Remove clusters exceeding sampling interval i. Calculate new
population size N*, number of clusters to be selected C*= C-1,
and new sampling interval i*.
Procedures for Drawing Probability Samples
Repeat the process until each of the remaining
clusters has a population less than the
sampling interval. If b clusters have been
selected with certainty, select the remaining c-
b clusters according to steps 1 through 7. The
fraction of units to be sampled with certainty is
the overall sampling fraction = n/N. Thus, for
clusters selected with certainty, we would
select ns=(n/N)(N1+N2+...+Nb) units. The units
selected from clusters selected under PPS
sampling will therefore be n*=n- ns.
Cluster
Sampling
Choosing Nonprobability vs.
Probability Sampling
Conditions Favoring the Use of
Factors Nonprobability
sampling
Probability
sampling
Nature of research Exploratory Conclusive
Relative magnitude of sampling
and nonsampling errors
Nonsampling
errors are
larger
Sampling
errors are
larger
Variability in the population Homogeneous
(low)
Heterogeneous
(high)
Statistical considerations Unfavorable Favorable
Operational considerations Favorable Unfavorable

Types of sampling designs

  • 1.
    TYPES OF SAMPLING Preparedby Manoj Xavier Research Scholar Reg.No. 69/2016 M.G. University Kottayam
  • 2.
    Types of SamplingDesigns  Probability Sampling: The general term for samples selected in accord with probability theory. Probability sampling is based on the concept of random selection – a controlled procedure that assures that each population element is given a known nonzero chance of selection.  Non-probability Sampling: Any technique in which samples are selected in some way not suggested by probability theory. Each member does not have a known nonzero chance of being included.
  • 3.
    Classification of Sampling Techniques SamplingTechniques Nonprobability Sampling Techniques Probability Sampling Techniques Convenience Sampling Judgmental Sampling Quota Sampling Snowball Sampling Systematic Sampling Stratified Sampling Cluster Sampling Other Sampling Techniques Simple Random Sampling
  • 4.
    Nonprobability Samples  Witha subjective approach like nonprobability sampling, the probability of selecting population elements is unknown.  There is a greater opportunity for bias to enter the sample and distort findings. We cannot estimate any range within which to expect the population parameter.  Despite these disadvantages, there are practical reasons to use nonprobability samples.
  • 5.
    Nonprobability Samples Cost Feasibility Time No needto generalize Limited objectives When the research does not require generalization to a population parameter, then there is no need to ensure that the sample fully reflects the population. The researcher may have limited objectives such as those in exploratory research. It is less expensive to use non-probability sampling. It also requires less time. Finally, a list may not be available.
  • 6.
  • 7.
  • 8.
    Convenience Sampling Non probabilitysamples that are unrestricted are called convenient samples. Convenience sampling attempts to obtain a sample of convenient elements. Often, respondents are selected because they happen to be in the right place at the right time.  use of students, and members of social organizations  mall intercept interviews without qualifying the respondents  “people on the street” interviews
  • 9.
    Strengths & Weaknessesof Convenient Sampling  Least expensive.  Least time-consuming.  Most convenient.  Selection bias.  Sample not representative.  Not recommended for descriptive or causal research.
  • 10.
    Judgmental Sampling Judgmental samplingis a form of convenience sampling in which the population elements are selected based on the judgment of the researcher.
  • 11.
    Strengths & Weaknessesof Judgmental Sampling  Low cost.  Not time consuming.  Useful for some types of forecasting.  Does not allow generalization.  Subjective, may make the sample unrepresentative.
  • 12.
    Quota Sampling Quota samplingmay be viewed as two-stage restricted judgmental sampling.  The first stage consists of developing control categories, or quotas, of population elements.  In the second stage, sample elements are selected based on convenience or judgment. Population Sample composition composition Control Characteristic Percentage Percentage Number Sex Male 48 48 480 Female 52 52 520 ____ ____ ____ 100 100 1000
  • 13.
    Strengths & Weaknessesof Quota Sampling  Sample can be controlled for certain characteristics.  Selection bias.  No assurance of representativeness.  Projecting data beyond sample inappropriate.
  • 14.
    Snowball Sampling In snowballsampling, an initial group of respondents is selected, usually at random.  After being interviewed, these respondents are asked to identify others who belong to the target population of interest.  Subsequent respondents are selected based on the information provided by the initial respondents.
  • 15.
    Strengths & Weaknessesof Snowball Sampling  Can estimate rare characteristics.  Time consuming.  Projecting data beyond sample inappropriate.
  • 16.
    Simple Random Sampling Each element in the population has a known and equal probability of selection.  Each possible sample of a given size (n) has a known and equal probability of being the sample actually selected.  This implies that every element is selected independently of every other element.
  • 17.
    Strengths & Weaknessesof Simple Random Sampling  Easily understood.  Results projectable.  Difficult to construct sampling frame.  Expensive. Often due to dispersed respondents.
  • 18.
  • 19.
    Systematic Sampling  Thesample is chosen by selecting a random starting point and then picking every ith element in succession from the sampling frame.  The sampling interval, i, is determined by dividing the population size N by the sample size n and rounding to the nearest integer. For example, there are 100,000 elements in the population and a sample of 1,000 is desired. In this case the sampling interval, i, is 100. A random number between 1 and 100 is selected. If, for example, this number is 23, the sample consists of elements 23, 123, 223, 323, 423, 523, and so on.
  • 20.
    Strengths & Weaknessesof Systematic Sampling  Can increase representativeness.  Easier to implement than SRS.  Can decrease representativeness. Must be particularly concerned with possible ordering in the population.
  • 21.
  • 22.
    Stratified Sampling  Atwo-step process in which the population is partitioned into subpopulations, or strata.  The strata should be mutually exclusive and collectively exhaustive in that every population element should be assigned to one and only one stratum and no population elements should be omitted.  Next, elements are selected from each stratum by a random procedure, usually SRS.  A major objective of stratified sampling is to increase precision without increasing cost.
  • 23.
    Stratified Sampling  Theelements within a stratum should be as homogeneous as possible, but the elements in different strata should be as heterogeneous as possible.  The stratification variables should also be closely related to the characteristic of interest.  Finally, the variables should decrease the cost of the stratification process by being easy to measure and apply.  In proportionate stratified sampling, the size of the sample drawn from each stratum is proportionate to the relative size of that stratum in the total population.  In disproportionate stratified sampling, the size of the sample from each stratum is proportionate to the relative size of that stratum and to the standard deviation of the distribution of the characteristic of interest among all the elements in that stratum.
  • 24.
    Strengths & Weaknessesof Stratified Sampling  Includes all important sub-populations.  Precision.  Expensive.  Difficult to select relevant stratification variables.
  • 25.
  • 26.
    Cluster Sampling  Thetarget population is first divided into mutually exclusive and collectively exhaustive subpopulations, or clusters.  Then a random sample of clusters is selected, based on a probability sampling technique such as SRS.  For each selected cluster, either all the elements are included in the sample (one-stage) or a sample of elements is drawn probabilistically (two-stage).  Elements within a cluster should be as heterogeneous as possible, but clusters themselves should be as homogeneous as possible. Ideally, each cluster should be a small-scale representation of the population.
  • 27.
  • 28.
    Technique Strengths Weaknesses NonprobabilitySampling Convenience sampling Least expensive, least time-consuming, most convenient Selection bias, sample not representative, not recommended for descriptive or causal research Judgmental sampling Low cost, convenient, not time-consuming Does not allow generalization, subjective Quota sampling Sample can be controlled for certain characteristics Selection bias, no assurance of representativeness Snowball sampling Can estimate rare characteristics Time-consuming Probability sampling Simple random sampling (SRS) Easily understood, results projectable Difficult to construct sampling frame, expensive, lower precision, no assurance of representativeness. Systematic sampling Can increase representativeness, easier to implement than SRS, sampling frame not necessary Can decrease representativeness Stratified sampling Include all important subpopulations, precision Difficult to select relevant stratification variables, not feasible to stratify on many variables, expensive Cluster sampling Easy to implement, cost effective Imprecise, difficult to compute and interpret results Strengths and Weaknesses of Basic Sampling Techniques
  • 29.
    Procedures for DrawingProbability Samples Simple Random Sampling 1. Select a suitable sampling frame 2. Each element is assigned a number from 1 to N (pop. size) 3. Generate n (sample size) different random numbers between 1 and N 4. The numbers generated denote the elements that should be included in the sample
  • 30.
    Procedures for Drawing ProbabilitySamples Systematic Sampling 1. Select a suitable sampling frame 2. Each element is assigned a number from 1 to N (pop. size) 3. Determine the sampling interval i:i=N/n. If i is a fraction, round to the nearest integer 4. Select a random number, r, between 1 and i, as explained in simple random sampling 5. The elements with the following numbers will comprise the systematic random sample: r, r+i,r+2i,r+3i,r+4i,...,r+(n-1)i
  • 31.
    1. Select asuitable frame 2. Select the stratification variable(s) and the number of strata, H 3. Divide the entire population into H strata. Based on the classification variable, each element of the population is assigned to one of the H strata 4. In each stratum, number the elements from 1 to Nh (the pop. size of stratum h) 5. Determine the sample size of each stratum, nh, based on proportionate or disproportionate stratified sampling, where 6. In each stratum, select a simple random sample of size nh Procedures for Drawing Probability Samples nh = n h=1 H Stratified Sampling
  • 32.
    Procedures for Drawing ProbabilitySamples Cluster Sampling 1. Assign a number from 1 to N to each element in the population 2. Divide the population into C clusters of which c will be included in the sample 3. Calculate the sampling interval i, i=N/c (round to nearest integer) 4. Select a random number r between 1 and i, as explained in simple random sampling 5. Identify elements with the following numbers: r,r+i,r+2i,... r+(c-1)i 6. Select the clusters that contain the identified elements 7. Select sampling units within each selected cluster based on SRS or systematic sampling 8. Remove clusters exceeding sampling interval i. Calculate new population size N*, number of clusters to be selected C*= C-1, and new sampling interval i*.
  • 33.
    Procedures for DrawingProbability Samples Repeat the process until each of the remaining clusters has a population less than the sampling interval. If b clusters have been selected with certainty, select the remaining c- b clusters according to steps 1 through 7. The fraction of units to be sampled with certainty is the overall sampling fraction = n/N. Thus, for clusters selected with certainty, we would select ns=(n/N)(N1+N2+...+Nb) units. The units selected from clusters selected under PPS sampling will therefore be n*=n- ns. Cluster Sampling
  • 34.
    Choosing Nonprobability vs. ProbabilitySampling Conditions Favoring the Use of Factors Nonprobability sampling Probability sampling Nature of research Exploratory Conclusive Relative magnitude of sampling and nonsampling errors Nonsampling errors are larger Sampling errors are larger Variability in the population Homogeneous (low) Heterogeneous (high) Statistical considerations Unfavorable Favorable Operational considerations Favorable Unfavorable