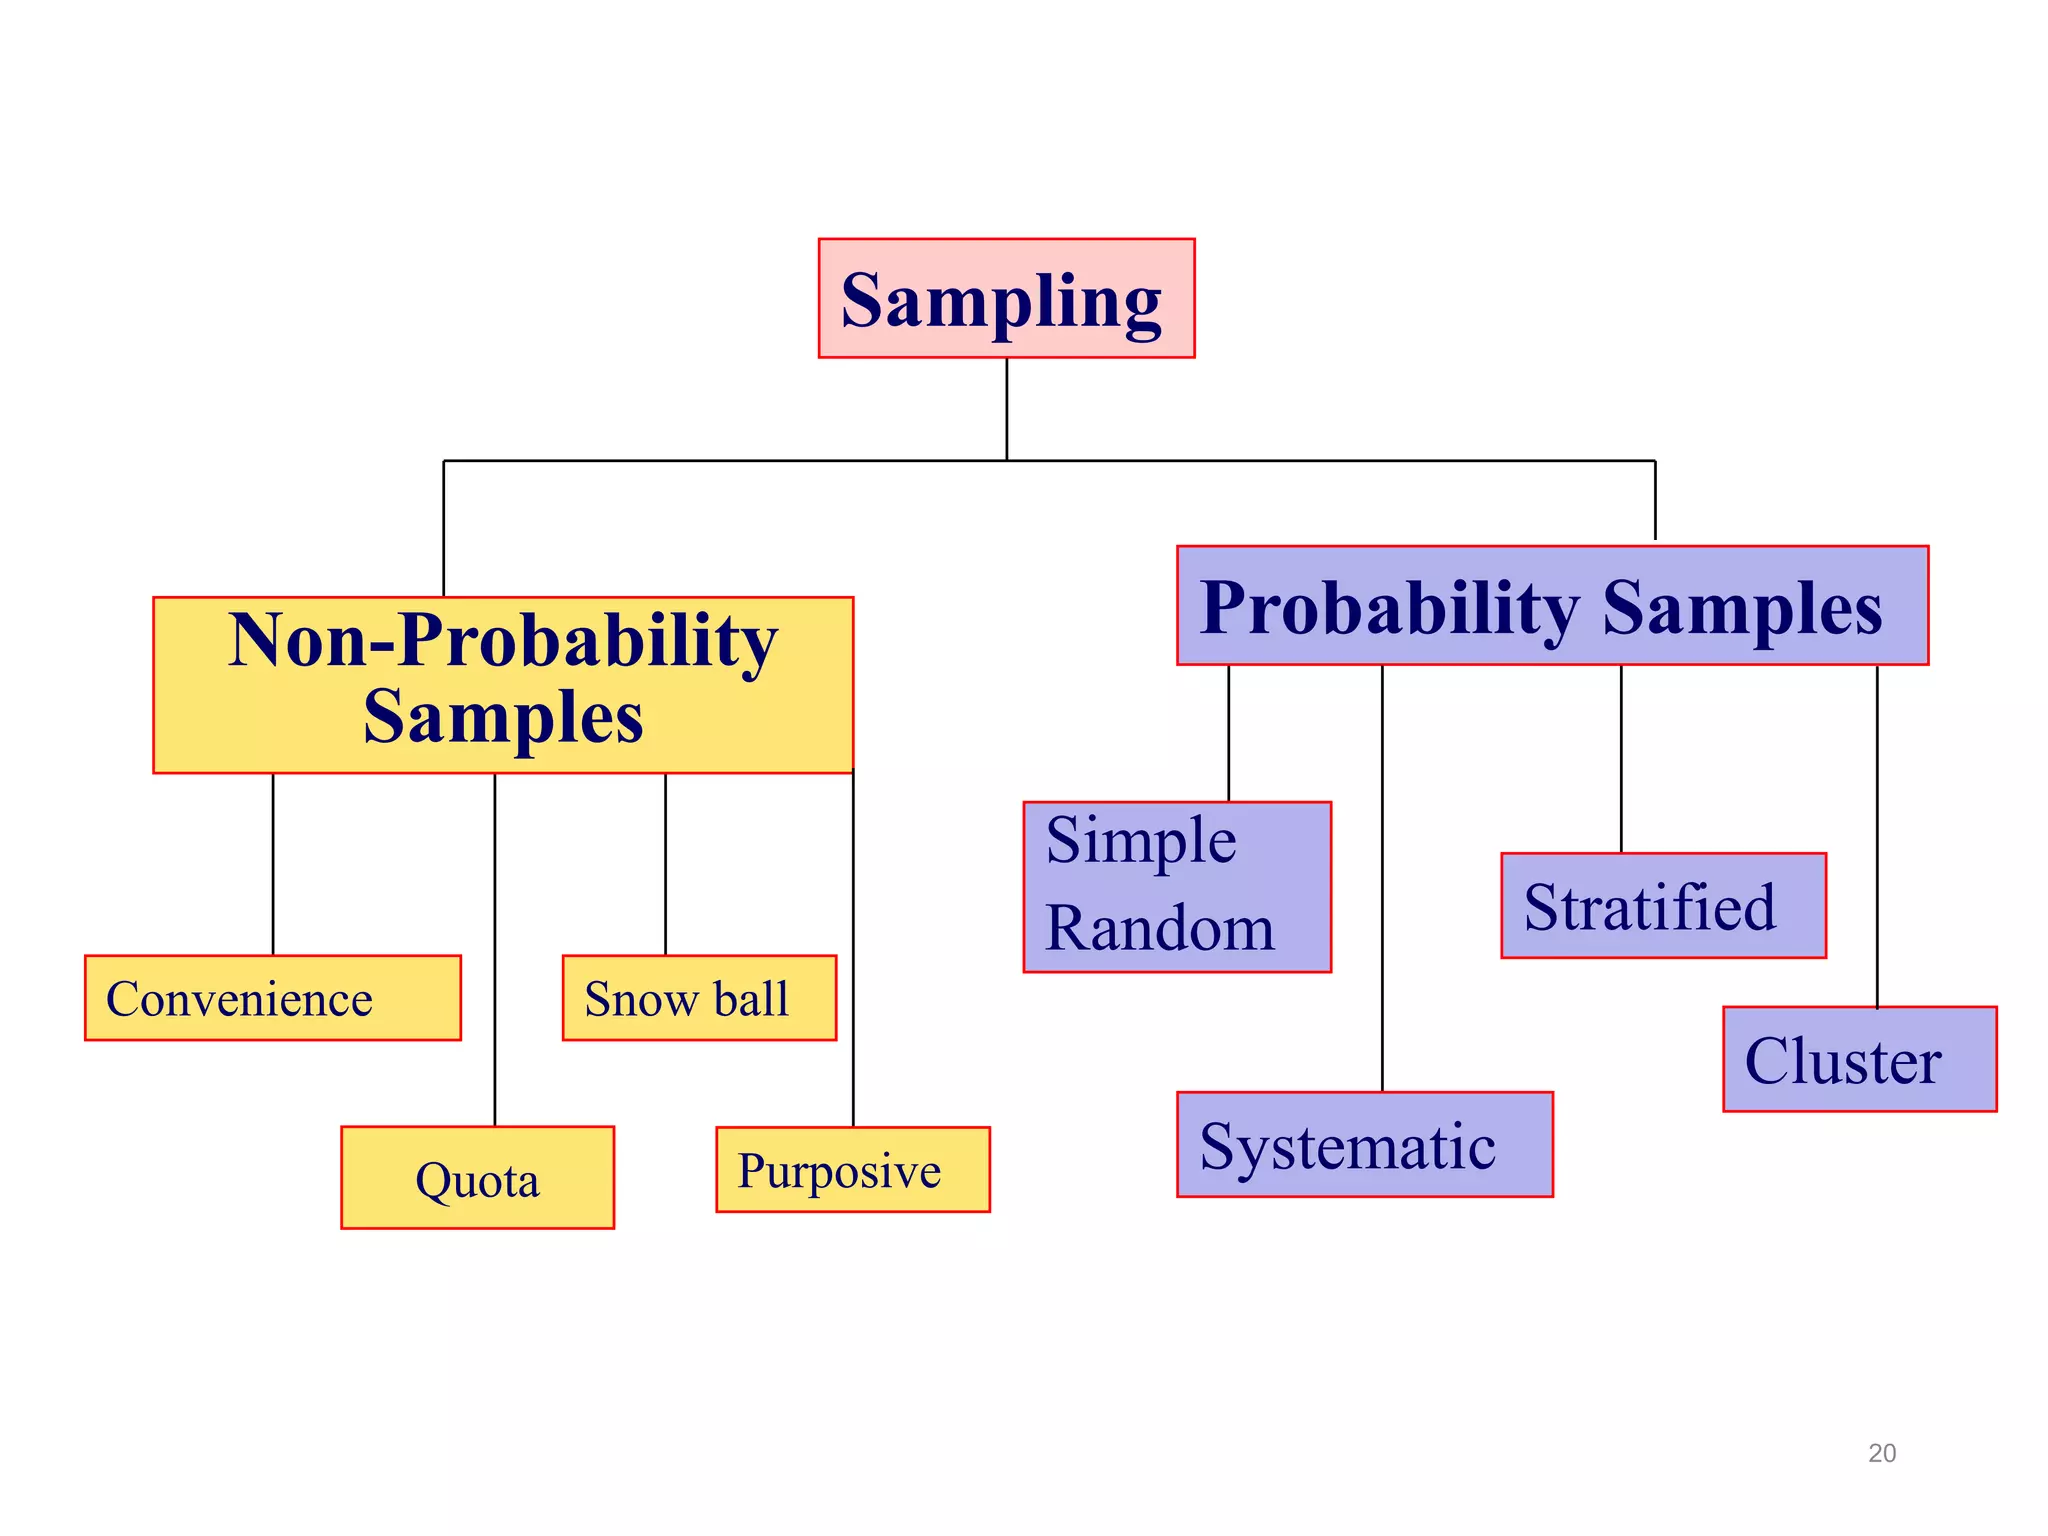
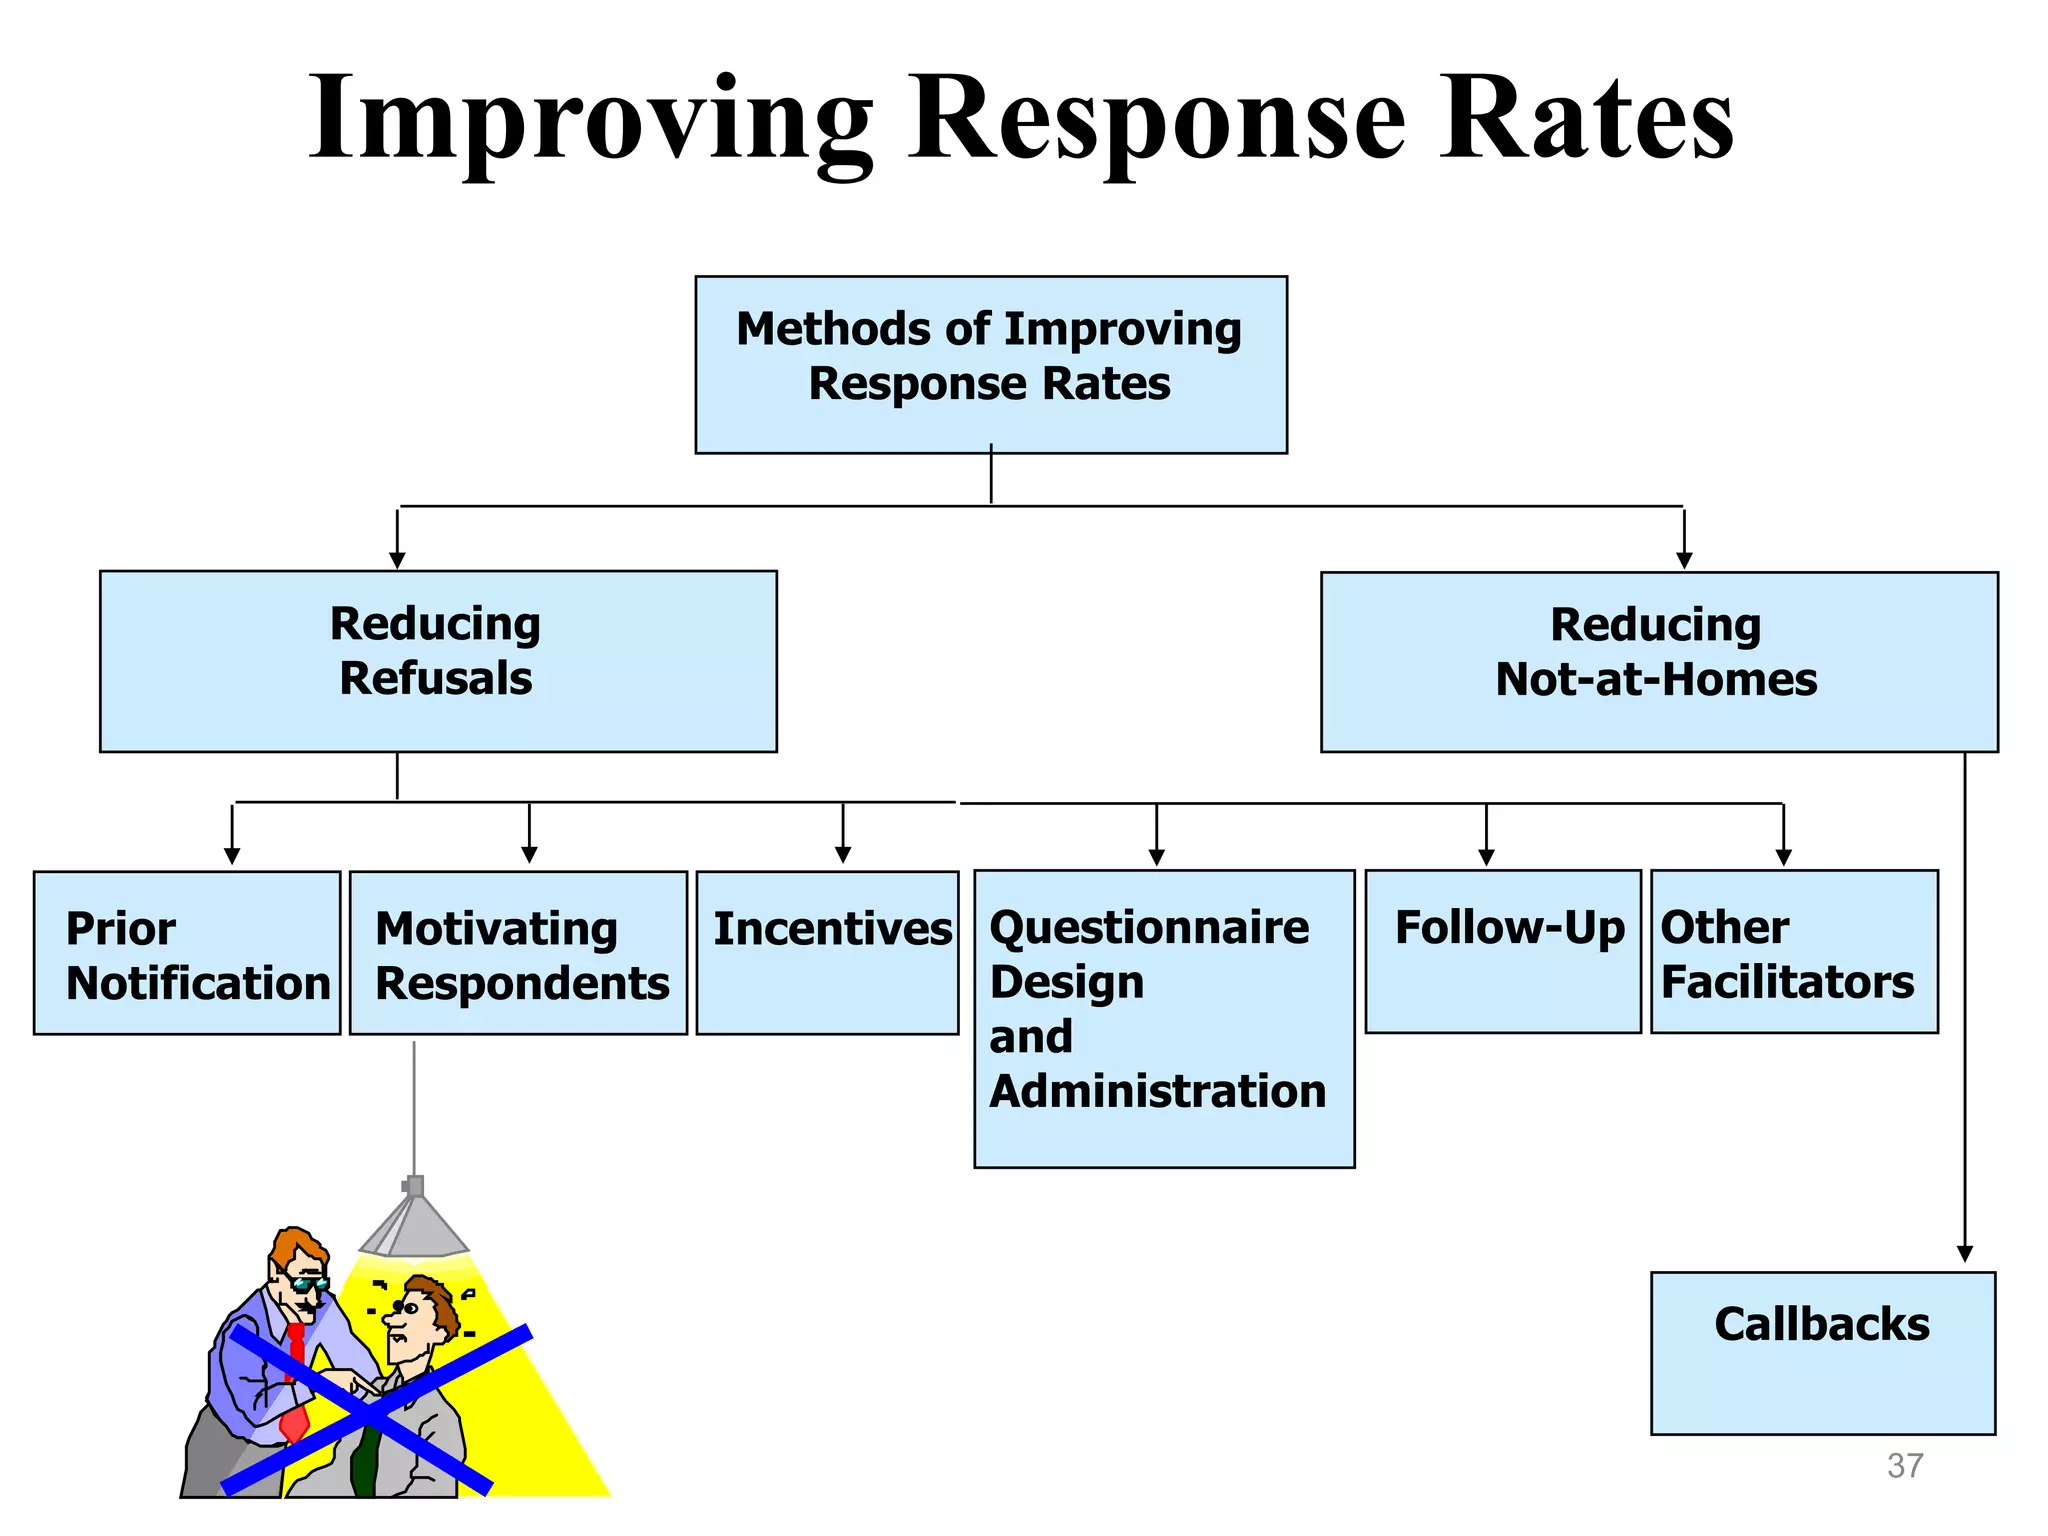
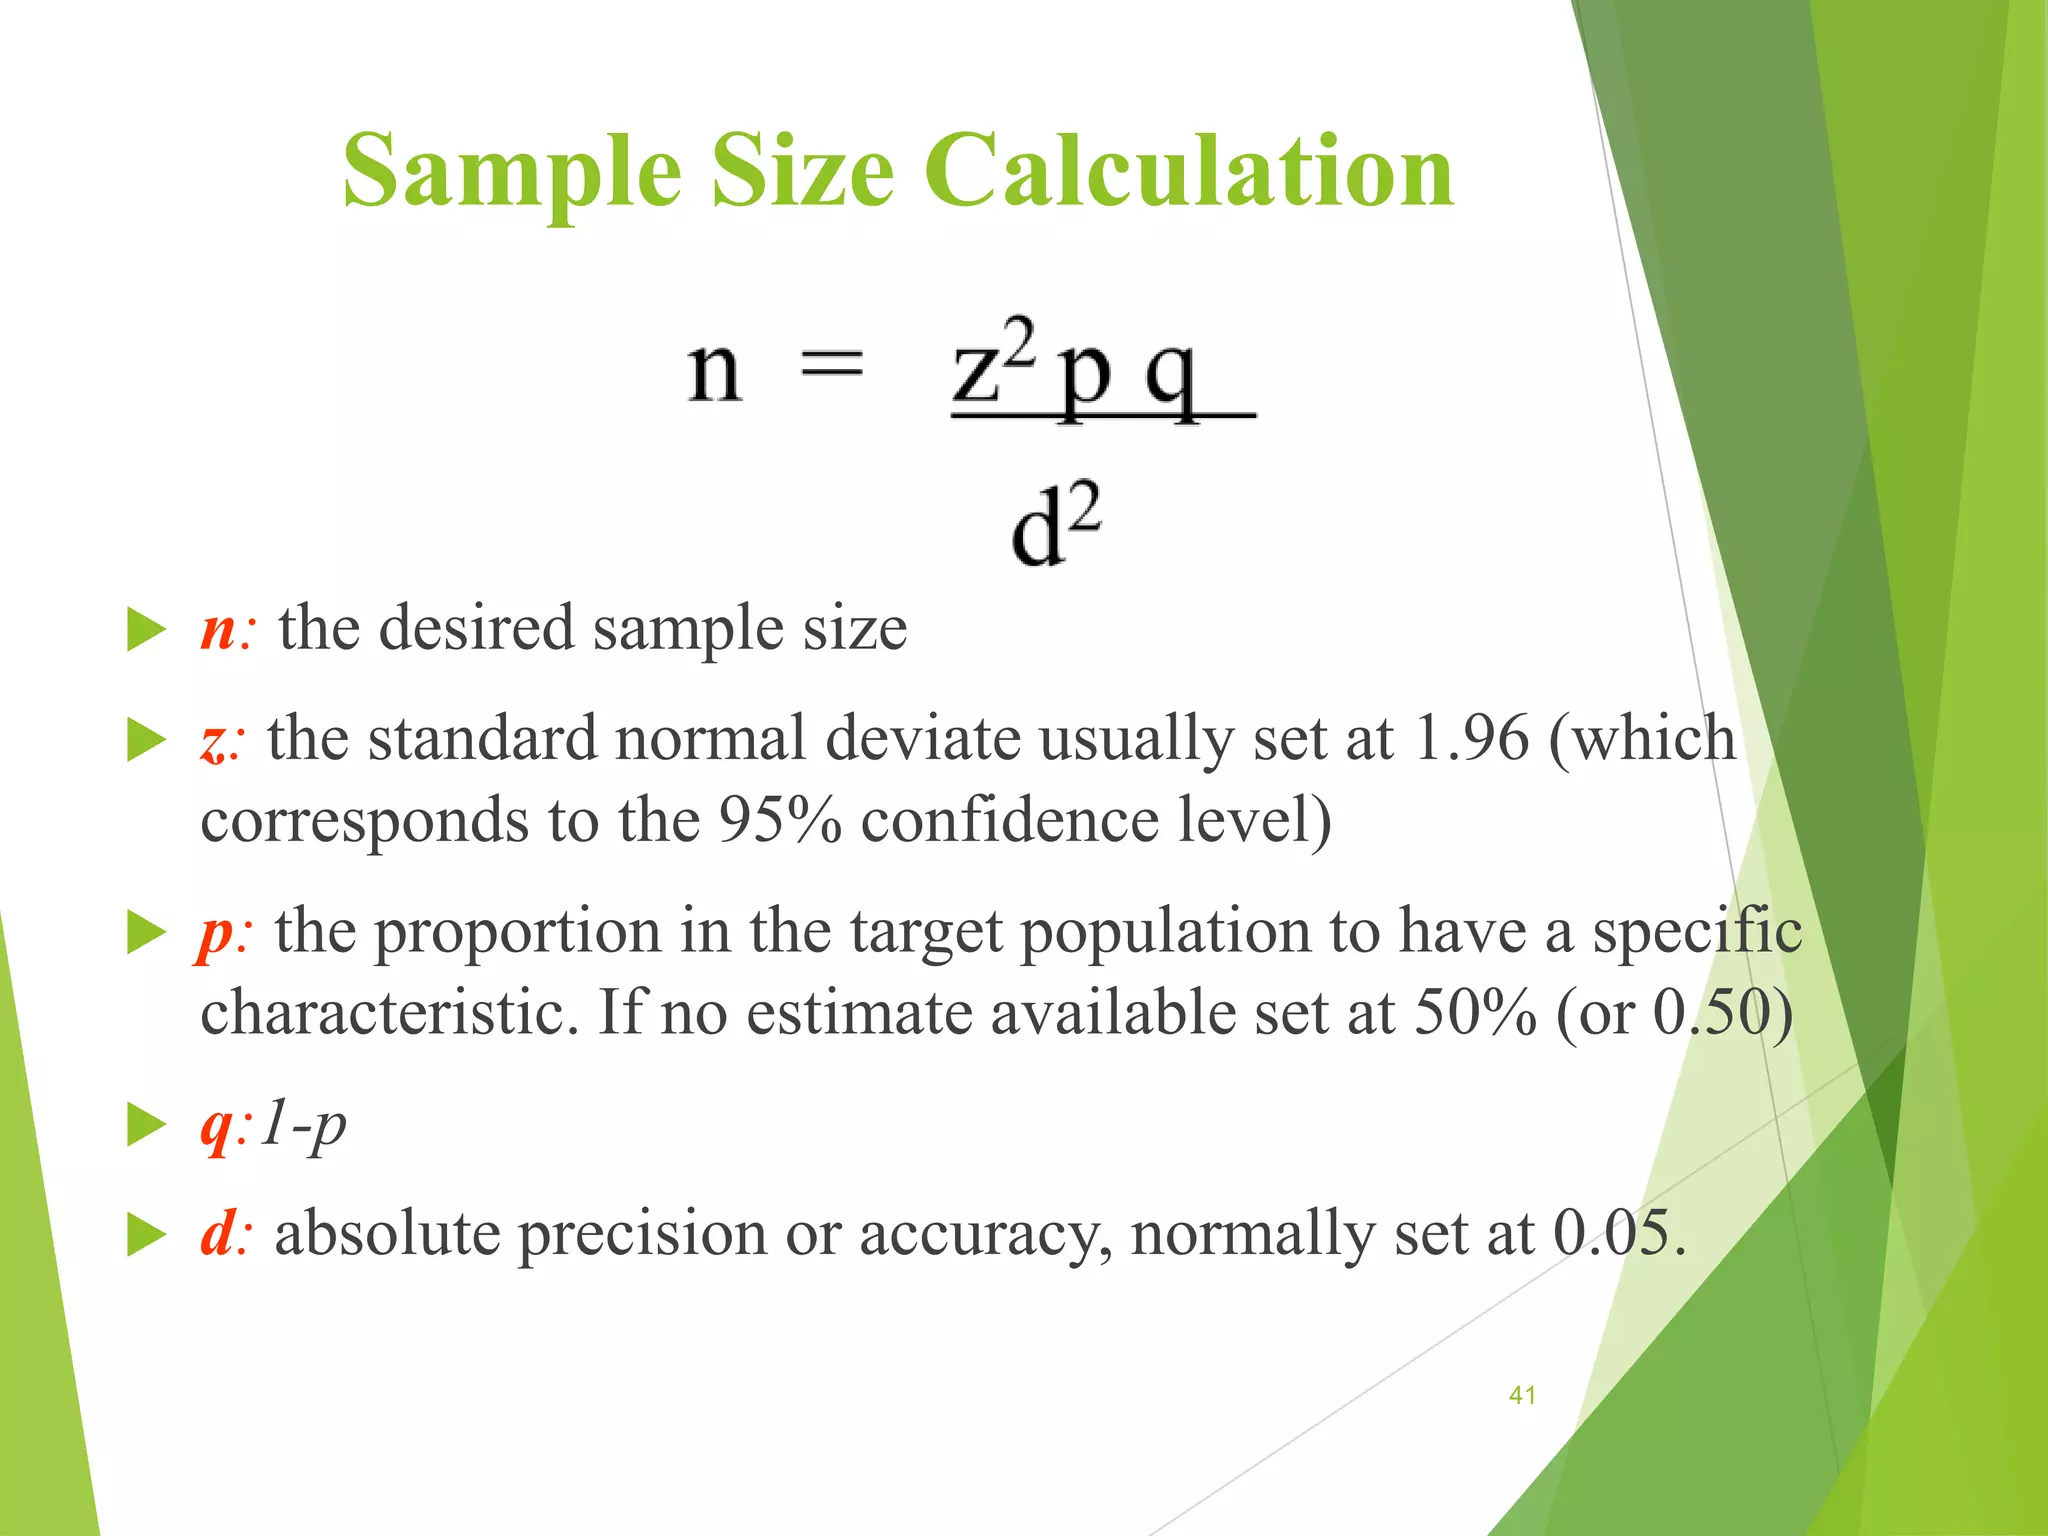
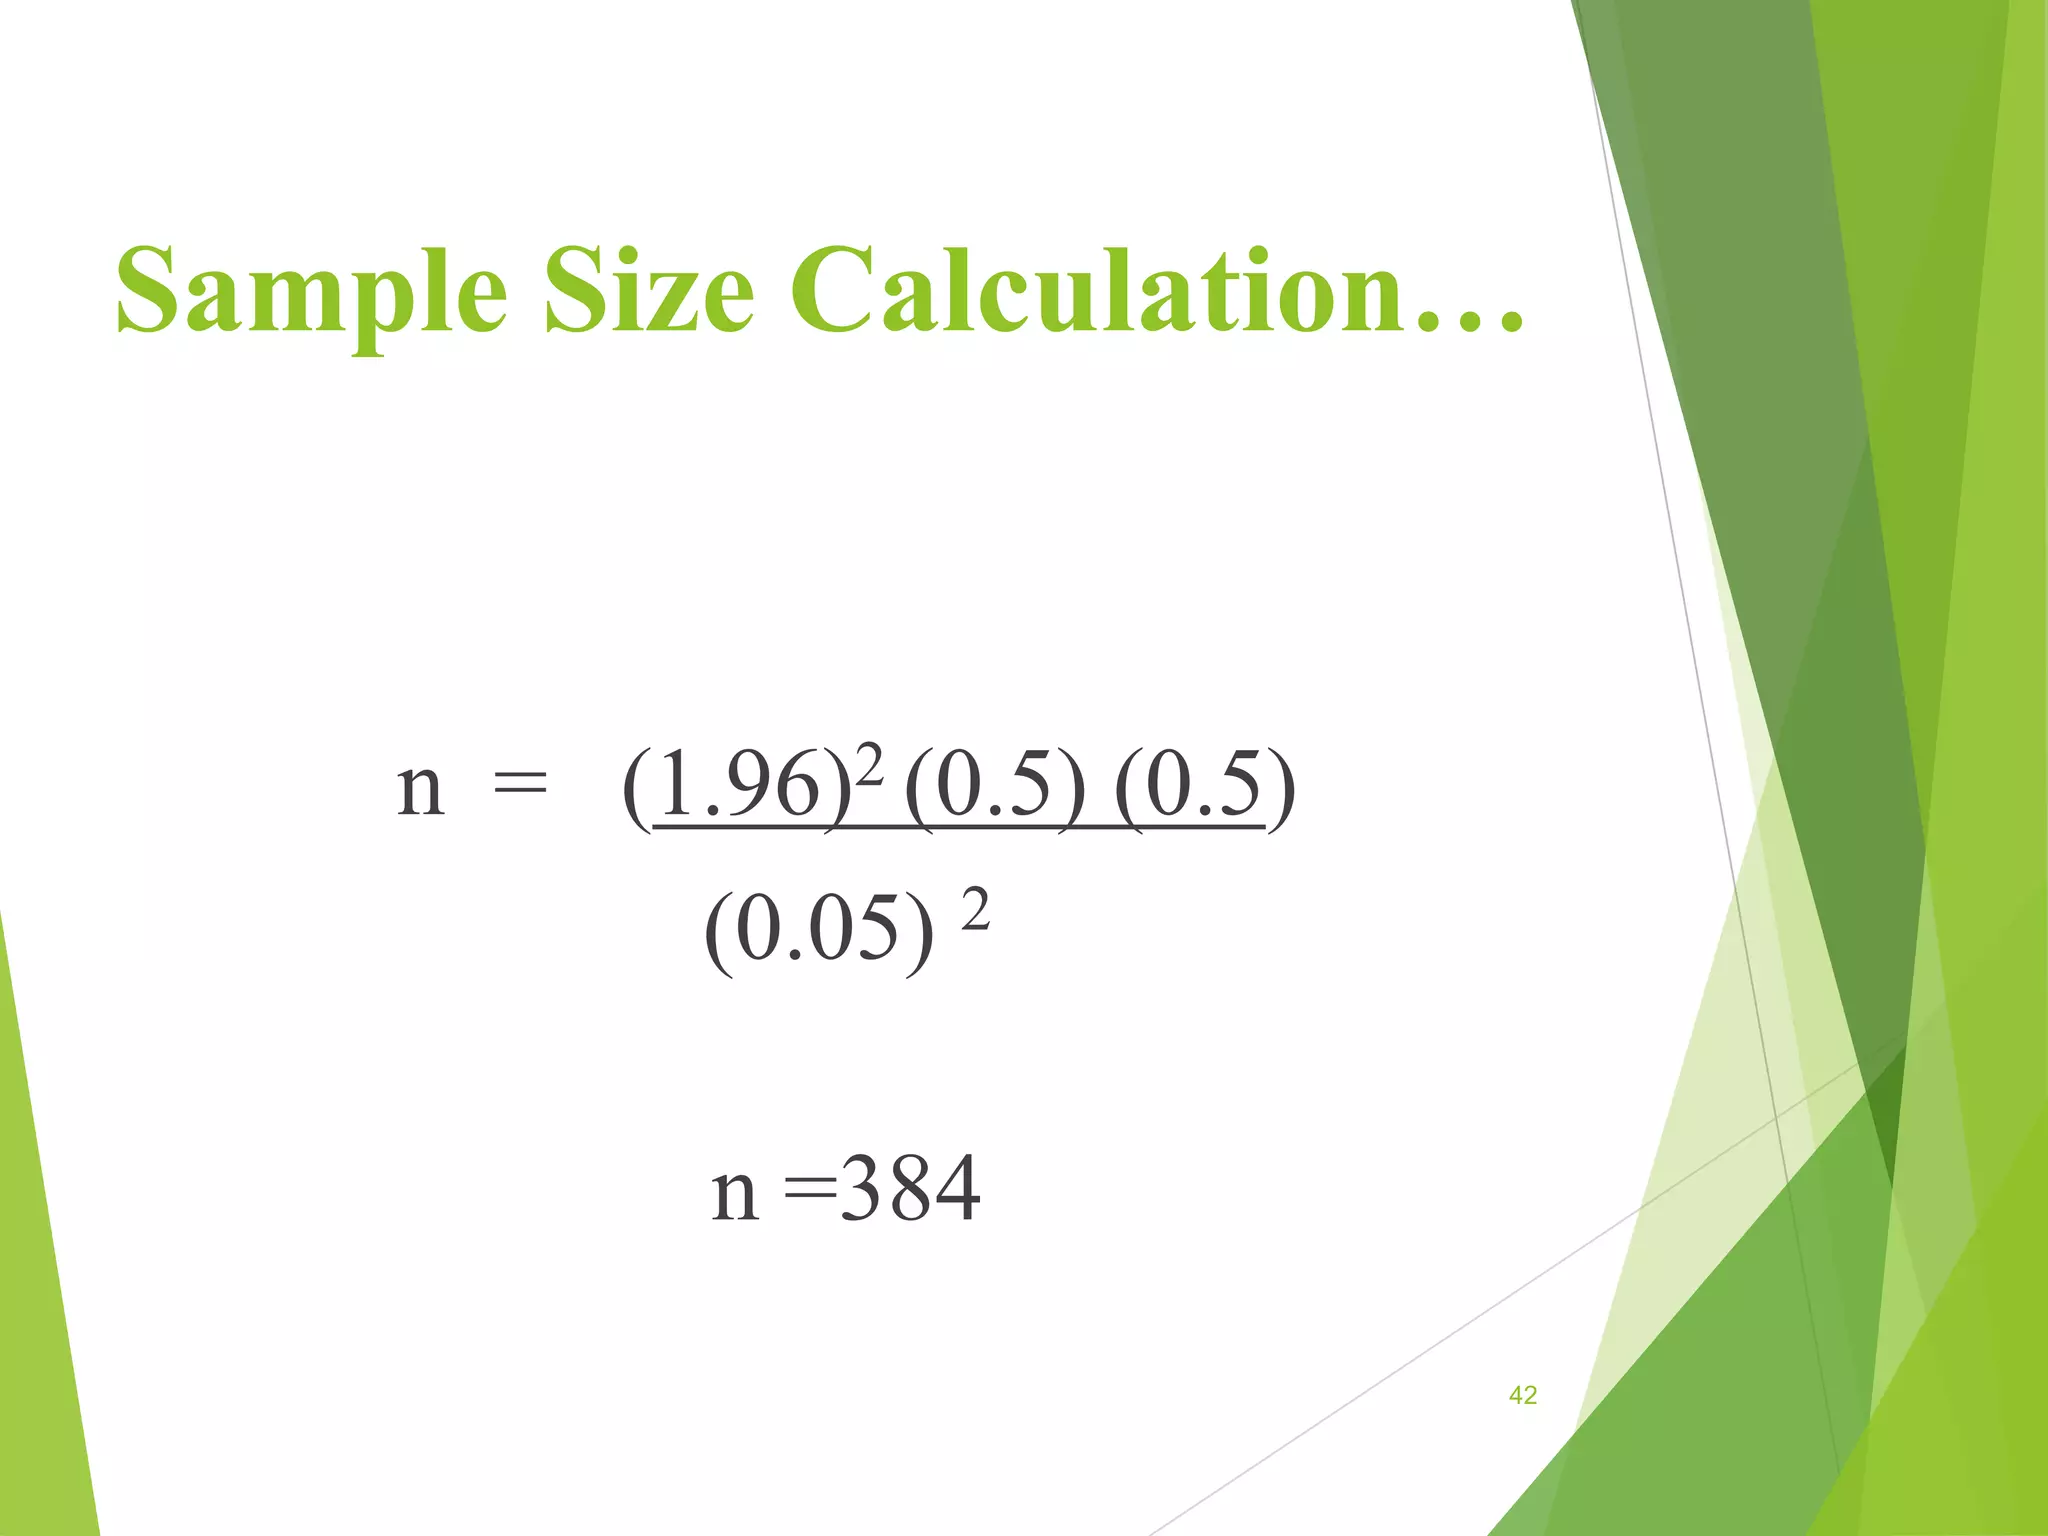
Sampling methods &
Sample Size Estimation
Abdullah Asady MD, MSc
1
2
3
Research IDs
• Google Scholar:
https://scholar.google.com/citations?user=bM2ThzUAAAAJ&hl=en
• ORCiD: https://orcid.org/0000-0001-9775-739X
• Web of Science: AAX-5132-2021
• Research Gate:
https://www.researchgate.net/profile/Abdullah-Asady-2
Outline
 History of sampling
 Why sampling
 Sampling concepts and terminologies
 Types of sampling
 Sampling and non-sampling errors
 Sample size estimation
5
History of Sampling
 Dates back to 1920 and started by Literary Digest, a
news magazine published in the U.S. between 1890
and 1938.
 Digest successfully predicted the presidential elections
in 1920, 1924,1928, 1932 but;
 Failed in 1936…
 The Literary Digest poll in 1936 used a sample of 10
million, drawn from government lists of automobile
and telephone owners. Predicted Alf Landon would
beat Franklin Roosevelt by a wide margin. But instead
Roosevelt won by a landslide. The reason was that the
sampling frame did not match the population. Only the
rich owned automobiles and telephones, and they were
the ones who favored Landon. 6
What is sampling
 A sample is some part of a larger body specially
selected to represent the whole
 Sampling is then is taking any portion of a population
or universe as representative of that population or
universe
 Sampling is the process by which this part is chosen
7
Key Definitions
 A population (universe) is the collection of things
under consideration
 A sample is a portion of the population selected for
analysis
 A parameter is a summary measure computed to
describe a characteristic of the population
 A statistic is a summary measure computed to describe
a characteristic of the sample
8
A Census
 A survey in which information is gathered about all
members of a population
 Gallup poll is able to develop representative samples of
any adult population with interviews of approximately
1500 respondents
 That sample size allows them to be 95% confident that
the results they obtain are accurate within + or – 3%
points
9
Sampling concepts and
terminologies
 Population/Target population
 Sampling frame
 Sampling unit
10
Population/Target
Population
 Target Population is the collection of all
individuals, families, groups organizations or
events that we are interested in finding out
about.
 Is the population to which the researcher would
like to generalize the results. For example, all
adults population of Afghanistan aged 65 or
older.
11
Sampling Frame
 The actual list of sampling units from which the
sample, or some stage of the sample, is collected
 It is simply a list of a study population
12
Sampling unit/Element/ Unit
of analysis
 Sampling unit is the unit about which information is
collected.
 Unit of analysis is the unit that provides the basis of
analysis.
 Each member of a population is an element. (e.g. a
child under 5)
 Sometimes it is household, e.g. any injury in the
household in the last three months.
13
Target population
List of households
(sampling frame)
Each household
(sampling unit)
Children less than 5 years
(sampling element)
14
Basic Principles
• Law of Statistical Regularity – “moderately large
number of the items chosen at random from the large
group are almost sure on the average to possess the
features of the large group.”
• Law of Inertia of Large Numbers – the larger the
size of the sample; the more accurate the results are
likely to be.
15
Advantages of sampling
 Accurate.
 Economical in nature.
 Reliable.
 High suitability ratio towards the different surveys.
 Takes less time.
 In cases, when the universe is very large, then the
sampling method is the only practical method for
collecting the data.
16
Disadvantages of sampling
 Inadequacy of samples.
 Chances for bias.
 Problems of accuracy.
 Difficulty of getting the representative sample.
 Untrained manpower.
 Absence of the informants.
 Chances of committing errors in sampling.
17
Important Issues
• Representation: The extent to which a sample is
representative of the population
• Generalization: The extent to which the results of a
study can be reasonably extended from a sample to
the population
• Sampling error: The chance occurrence that a
randomly selected sample is not representative of the
population due to errors inherent in the sampling
technique
18
Types of sampling
19
Quota
Sampling
Non-Probability
Samples
Convenience Snow ball
Probability Samples
Simple
Random
Systematic
Stratified
Cluster
Purposive
20
Simple Random Sampling
 Every individual or item from the frame has an equal
chance of being selected
 Samples obtained from table of random numbers or
computer random number generators
 Random samples are unbiased and, on average,
representative of the population
21
Systematic random Sampling
 Randomly select one individual from the 1st group
 Select every k-th individual thereafter
 Number the houses first. Then a number is taken at
random; say 3.Than every 10th number is selected
from that point onward like 3, 13, 23, 33 etc.
N = 500
n = 3
k = 10
First Group
22
Stratified Samples
 Procedure: Divide the population into strata (mutually
exclusive classes), such as men and women. Then
randomly sample within strata.
 Especially important when one group is so small (say,
3% of the population)
23
Stratified Random Sampling
24
Cluster sampling
 Each unit selected is a group of persons (all persons in a
city block, a family, etc.) rather than an individual.
 Used when (a) sampling frame not available or too
expensive, and (b) cost of reaching an individual element
is too high
 E.g., there is no list of automobile mechanics in
Afghanistan.
 First define large clusters of people. Fairly similar to other
clusters. For example, cities make good clusters.
 Once you've chosen the cities, might be able to get a
reasonably accurate list of all the mechanics in each of
those cities.
 Cluster sampling is less expensive than other methods, but
less accurate. 25
Cluster Sampling
• Population divided into several “clusters,” each
representative of the population
• Simple random sample selected from each
• The samples are combined into one
26
Population
divided
into 4
clusters.
27
28
Non- Probability Sampling /
Non-Random
 This is where the probability of inclusion in the
sample is unknown.
 Convenience sampling
 Purposive sampling
 Quota sampling
 Snow ball sampling
29
Convenience sampling
 Whoever happens to walk by your office; who's on the
street when the camera crews come out
 If you have a choice, don't use this method. Often
produces really wrong answers, because certain
attributes tend to cluster with certain geographic and
temporal variables.
 For example, at 8am, most of the people on the street are
workers heading for their jobs.
 At 10am, there are many more people who don't work, and the
proportion of women maybe much higher.
 At midnight, there are young people and muggers.
30
• The process whereby a researcher gathers data from
individuals possessing identified characteristics and
quotas
• Is an improvement on convenience sampling, but still
has problems.
• The population is first segmented into mutually
exclusive sub-groups, just as in stratified sampling.
• Then judgment used to select subjects or units from
each segment based on a specified proportion.
Quota Sampling
31
Purposive/Judgment
 Selecting sample on the basis of knowledge of the
research problem to allow selection of appropriate
persons for inclusion in the sample
 Expert judgment picks useful cases for study
 Good for exploratory, qualitative work, and for pre-
testing a questionnaire.
32
Snowball sampling
 Recruiting people based on recommendation of
people you have just interviewed
 Useful for studying invisible/illegal
populations, such as drug addicts
33
Friend
Friend
Friend
Friend
Friend
Friend
Friend
Friend
Main person
34
Friend Friend Friend Friend
Friend
Friend
Friend
Sampling Errors
 Sampling errors are the representative errors due to
selecting a sample of eligible units from the target
population instead of including every eligible unit
in the survey.
 Related to the sample size and the variability
among the sampling units.
 Can be statistically evaluated after the survey.
35
Non-Sampling Errors
 Non-sampling errors result from problems during data
collection and data processing, such as
 Failure to locate and interview the correct household,
 Misunderstanding of the questions on the part of either
the interviewer or the respondent, and
 Data entry errors.
 An inadequate sampling frame (Non- coverage)
 Non-response from participants
 Response errors
 Coding and data entry errors
 The sampling design should be as simple and
straightforward as possible. 36
Improving Response Rates
37
Prior
Notification
Motivating
Respondents
Incentives Questionnaire
Design
and
Administration
Follow-Up Other
Facilitators
Callbacks
Methods of Improving
Response Rates
Reducing
Refusals
Reducing
Not-at-Homes
Sample size estimation
38
Sample Size
 How many people to pick up for a study
 The question often asked is: How big a sample
is necessary for a good survey?
 The main objective is to obtain both a desirable
accuracy and a desirable confidence level with
a minimum cost.
39
Determination of Sample
Size
 Type of analysis to be employed
 The level of precision needed
 Population homogeneity /heterogeneity
 Available resources
 Sampling technique used
40
Sample Size Calculation
 n: the desired sample size
 z: the standard normal deviate usually set at 1.96 (which
corresponds to the 95% confidence level)
 p: the proportion in the target population to have a specific
characteristic. If no estimate available set at 50% (or 0.50)
 q:1-p
 d: absolute precision or accuracy, normally set at 0.05.
41
Sample Size Calculation…
n = (1.96)2 (0.5) (0.5)
(0.05) 2
n =384
42
Thank you
43

final-Sampling-techniques.ppt

  • 1.
    Sampling methods & SampleSize Estimation Abdullah Asady MD, MSc 1
  • 2.
  • 3.
  • 4.
    Research IDs • GoogleScholar: https://scholar.google.com/citations?user=bM2ThzUAAAAJ&hl=en • ORCiD: https://orcid.org/0000-0001-9775-739X • Web of Science: AAX-5132-2021 • Research Gate: https://www.researchgate.net/profile/Abdullah-Asady-2
  • 5.
    Outline  History ofsampling  Why sampling  Sampling concepts and terminologies  Types of sampling  Sampling and non-sampling errors  Sample size estimation 5
  • 6.
    History of Sampling Dates back to 1920 and started by Literary Digest, a news magazine published in the U.S. between 1890 and 1938.  Digest successfully predicted the presidential elections in 1920, 1924,1928, 1932 but;  Failed in 1936…  The Literary Digest poll in 1936 used a sample of 10 million, drawn from government lists of automobile and telephone owners. Predicted Alf Landon would beat Franklin Roosevelt by a wide margin. But instead Roosevelt won by a landslide. The reason was that the sampling frame did not match the population. Only the rich owned automobiles and telephones, and they were the ones who favored Landon. 6
  • 7.
    What is sampling A sample is some part of a larger body specially selected to represent the whole  Sampling is then is taking any portion of a population or universe as representative of that population or universe  Sampling is the process by which this part is chosen 7
  • 8.
    Key Definitions  Apopulation (universe) is the collection of things under consideration  A sample is a portion of the population selected for analysis  A parameter is a summary measure computed to describe a characteristic of the population  A statistic is a summary measure computed to describe a characteristic of the sample 8
  • 9.
    A Census  Asurvey in which information is gathered about all members of a population  Gallup poll is able to develop representative samples of any adult population with interviews of approximately 1500 respondents  That sample size allows them to be 95% confident that the results they obtain are accurate within + or – 3% points 9
  • 10.
    Sampling concepts and terminologies Population/Target population  Sampling frame  Sampling unit 10
  • 11.
    Population/Target Population  Target Populationis the collection of all individuals, families, groups organizations or events that we are interested in finding out about.  Is the population to which the researcher would like to generalize the results. For example, all adults population of Afghanistan aged 65 or older. 11
  • 12.
    Sampling Frame  Theactual list of sampling units from which the sample, or some stage of the sample, is collected  It is simply a list of a study population 12
  • 13.
    Sampling unit/Element/ Unit ofanalysis  Sampling unit is the unit about which information is collected.  Unit of analysis is the unit that provides the basis of analysis.  Each member of a population is an element. (e.g. a child under 5)  Sometimes it is household, e.g. any injury in the household in the last three months. 13
  • 14.
    Target population List ofhouseholds (sampling frame) Each household (sampling unit) Children less than 5 years (sampling element) 14
  • 15.
    Basic Principles • Lawof Statistical Regularity – “moderately large number of the items chosen at random from the large group are almost sure on the average to possess the features of the large group.” • Law of Inertia of Large Numbers – the larger the size of the sample; the more accurate the results are likely to be. 15
  • 16.
    Advantages of sampling Accurate.  Economical in nature.  Reliable.  High suitability ratio towards the different surveys.  Takes less time.  In cases, when the universe is very large, then the sampling method is the only practical method for collecting the data. 16
  • 17.
    Disadvantages of sampling Inadequacy of samples.  Chances for bias.  Problems of accuracy.  Difficulty of getting the representative sample.  Untrained manpower.  Absence of the informants.  Chances of committing errors in sampling. 17
  • 18.
    Important Issues • Representation:The extent to which a sample is representative of the population • Generalization: The extent to which the results of a study can be reasonably extended from a sample to the population • Sampling error: The chance occurrence that a randomly selected sample is not representative of the population due to errors inherent in the sampling technique 18
  • 19.
  • 20.
    Quota Sampling Non-Probability Samples Convenience Snow ball ProbabilitySamples Simple Random Systematic Stratified Cluster Purposive 20
  • 21.
    Simple Random Sampling Every individual or item from the frame has an equal chance of being selected  Samples obtained from table of random numbers or computer random number generators  Random samples are unbiased and, on average, representative of the population 21
  • 22.
    Systematic random Sampling Randomly select one individual from the 1st group  Select every k-th individual thereafter  Number the houses first. Then a number is taken at random; say 3.Than every 10th number is selected from that point onward like 3, 13, 23, 33 etc. N = 500 n = 3 k = 10 First Group 22
  • 23.
    Stratified Samples  Procedure:Divide the population into strata (mutually exclusive classes), such as men and women. Then randomly sample within strata.  Especially important when one group is so small (say, 3% of the population) 23
  • 24.
  • 25.
    Cluster sampling  Eachunit selected is a group of persons (all persons in a city block, a family, etc.) rather than an individual.  Used when (a) sampling frame not available or too expensive, and (b) cost of reaching an individual element is too high  E.g., there is no list of automobile mechanics in Afghanistan.  First define large clusters of people. Fairly similar to other clusters. For example, cities make good clusters.  Once you've chosen the cities, might be able to get a reasonably accurate list of all the mechanics in each of those cities.  Cluster sampling is less expensive than other methods, but less accurate. 25
  • 26.
    Cluster Sampling • Populationdivided into several “clusters,” each representative of the population • Simple random sample selected from each • The samples are combined into one 26 Population divided into 4 clusters.
  • 27.
  • 28.
  • 29.
    Non- Probability Sampling/ Non-Random  This is where the probability of inclusion in the sample is unknown.  Convenience sampling  Purposive sampling  Quota sampling  Snow ball sampling 29
  • 30.
    Convenience sampling  Whoeverhappens to walk by your office; who's on the street when the camera crews come out  If you have a choice, don't use this method. Often produces really wrong answers, because certain attributes tend to cluster with certain geographic and temporal variables.  For example, at 8am, most of the people on the street are workers heading for their jobs.  At 10am, there are many more people who don't work, and the proportion of women maybe much higher.  At midnight, there are young people and muggers. 30
  • 31.
    • The processwhereby a researcher gathers data from individuals possessing identified characteristics and quotas • Is an improvement on convenience sampling, but still has problems. • The population is first segmented into mutually exclusive sub-groups, just as in stratified sampling. • Then judgment used to select subjects or units from each segment based on a specified proportion. Quota Sampling 31
  • 32.
    Purposive/Judgment  Selecting sampleon the basis of knowledge of the research problem to allow selection of appropriate persons for inclusion in the sample  Expert judgment picks useful cases for study  Good for exploratory, qualitative work, and for pre- testing a questionnaire. 32
  • 33.
    Snowball sampling  Recruitingpeople based on recommendation of people you have just interviewed  Useful for studying invisible/illegal populations, such as drug addicts 33
  • 34.
    Friend Friend Friend Friend Friend Friend Friend Friend Main person 34 Friend FriendFriend Friend Friend Friend Friend Friend Friend Friend Friend
  • 35.
    Sampling Errors  Samplingerrors are the representative errors due to selecting a sample of eligible units from the target population instead of including every eligible unit in the survey.  Related to the sample size and the variability among the sampling units.  Can be statistically evaluated after the survey. 35
  • 36.
    Non-Sampling Errors  Non-samplingerrors result from problems during data collection and data processing, such as  Failure to locate and interview the correct household,  Misunderstanding of the questions on the part of either the interviewer or the respondent, and  Data entry errors.  An inadequate sampling frame (Non- coverage)  Non-response from participants  Response errors  Coding and data entry errors  The sampling design should be as simple and straightforward as possible. 36
  • 37.
    Improving Response Rates 37 Prior Notification Motivating Respondents IncentivesQuestionnaire Design and Administration Follow-Up Other Facilitators Callbacks Methods of Improving Response Rates Reducing Refusals Reducing Not-at-Homes
  • 38.
  • 39.
    Sample Size  Howmany people to pick up for a study  The question often asked is: How big a sample is necessary for a good survey?  The main objective is to obtain both a desirable accuracy and a desirable confidence level with a minimum cost. 39
  • 40.
    Determination of Sample Size Type of analysis to be employed  The level of precision needed  Population homogeneity /heterogeneity  Available resources  Sampling technique used 40
  • 41.
    Sample Size Calculation n: the desired sample size  z: the standard normal deviate usually set at 1.96 (which corresponds to the 95% confidence level)  p: the proportion in the target population to have a specific characteristic. If no estimate available set at 50% (or 0.50)  q:1-p  d: absolute precision or accuracy, normally set at 0.05. 41
  • 42.
    Sample Size Calculation… n= (1.96)2 (0.5) (0.5) (0.05) 2 n =384 42
  • 43.