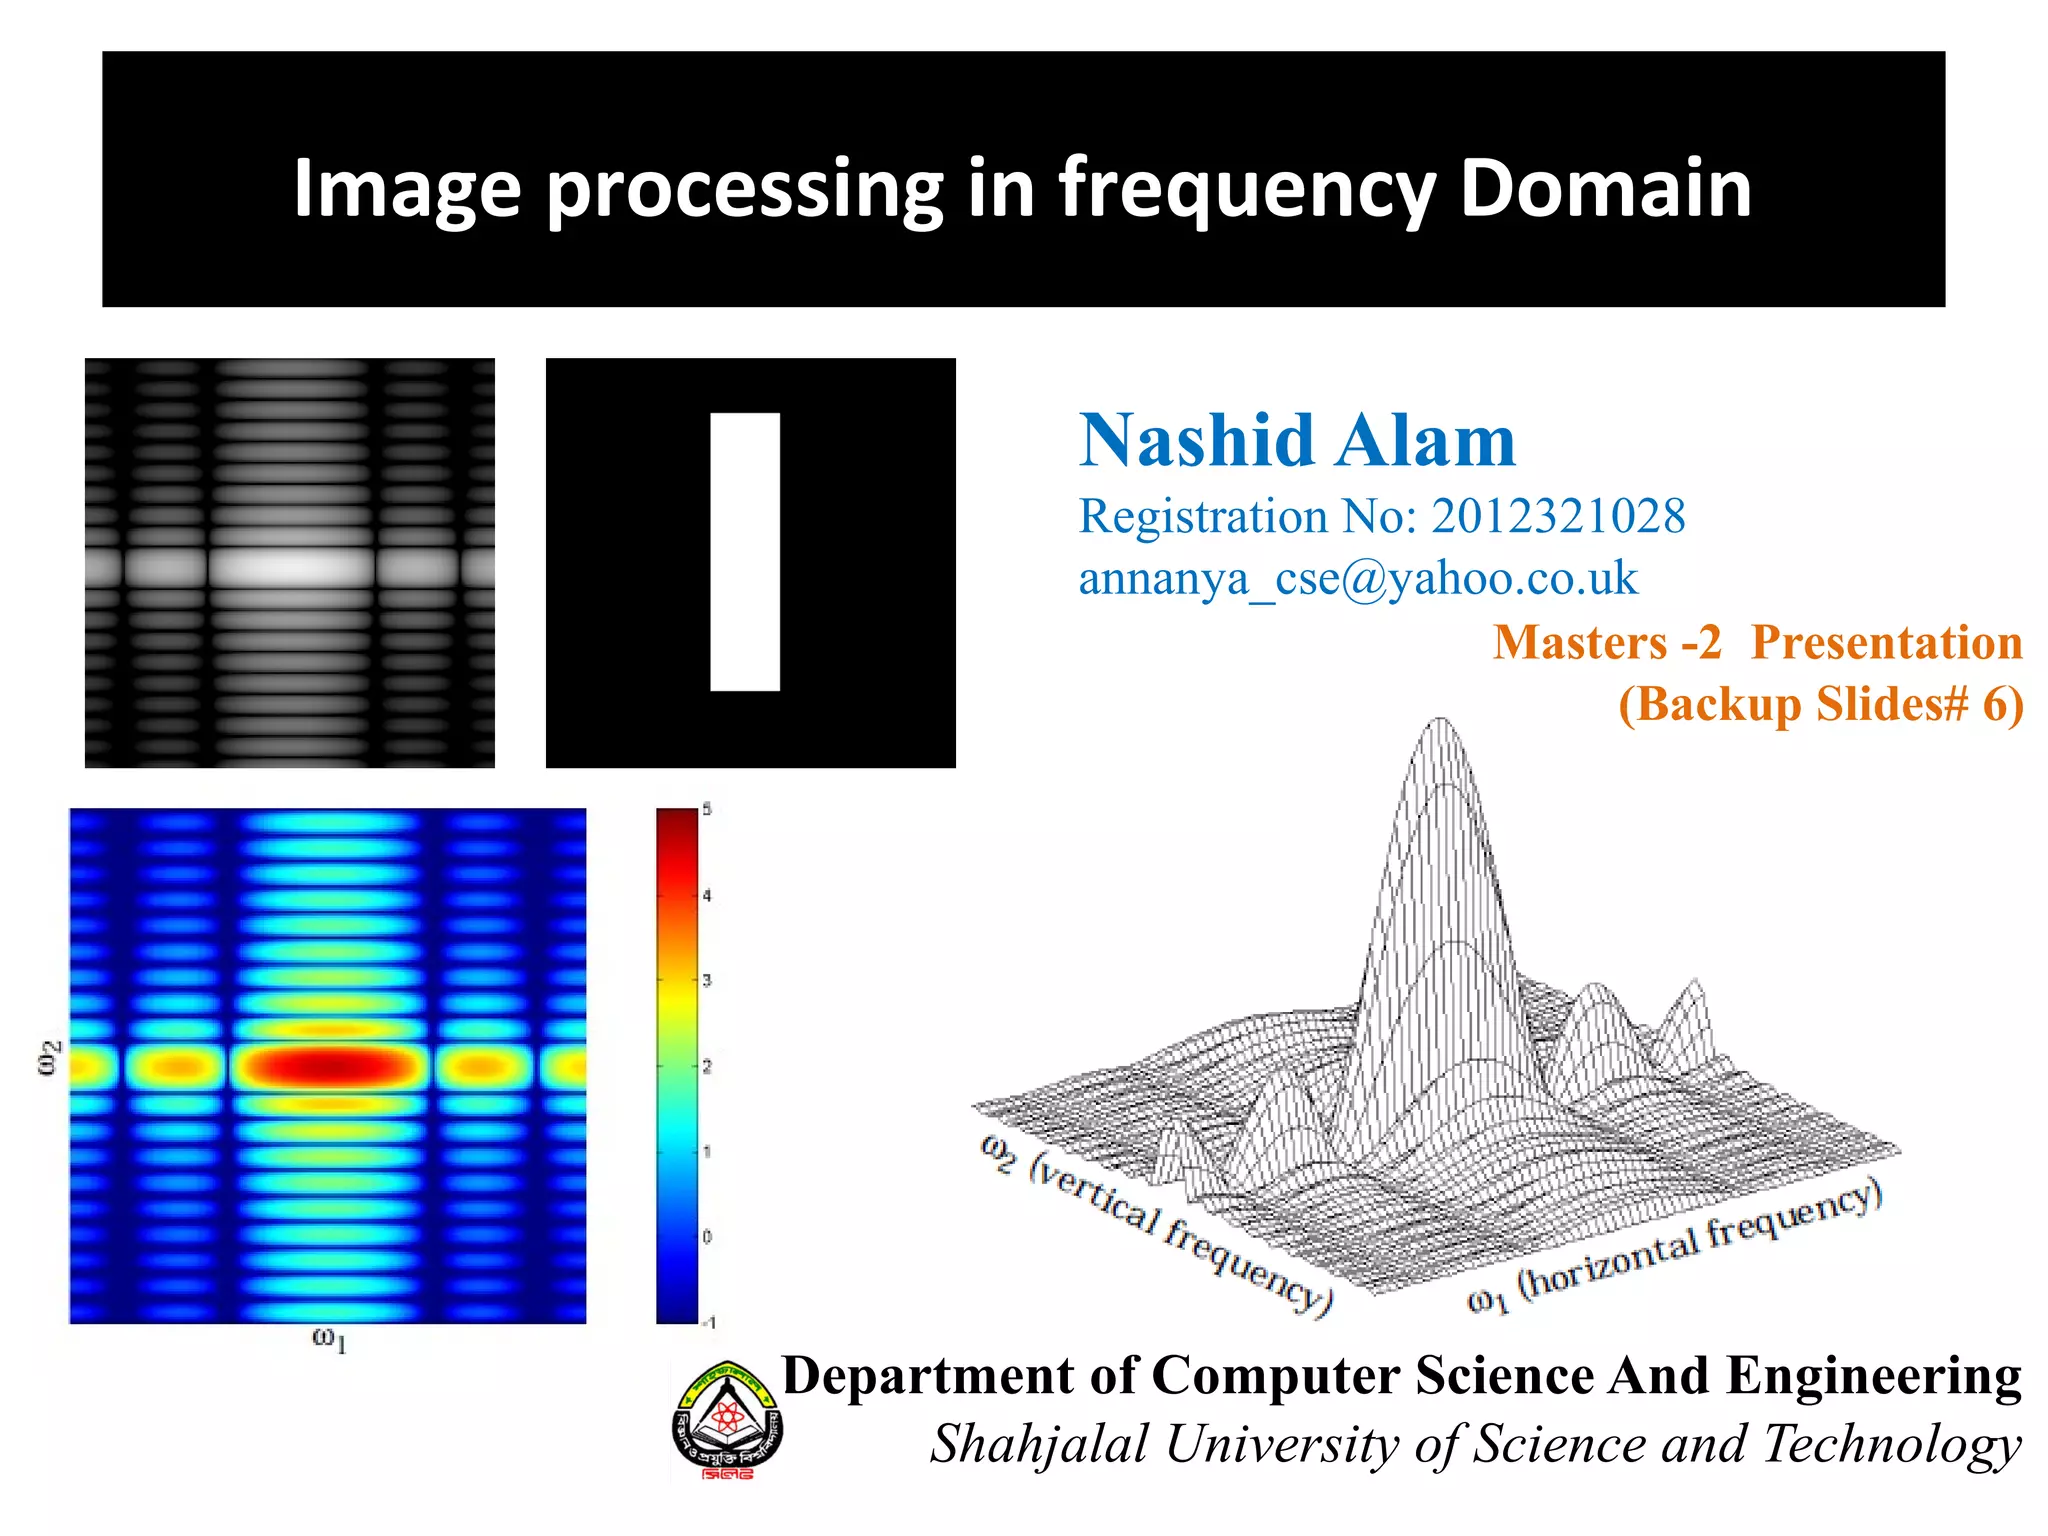
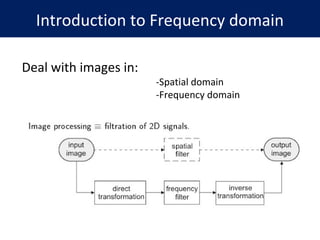
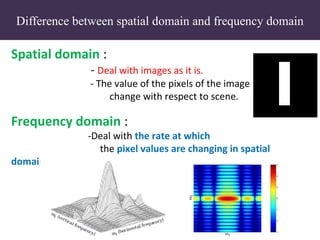
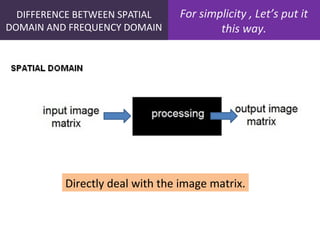
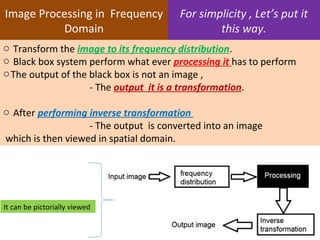
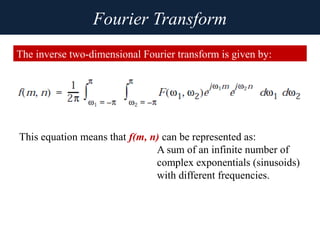
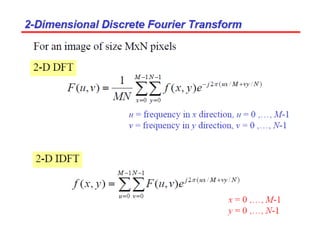
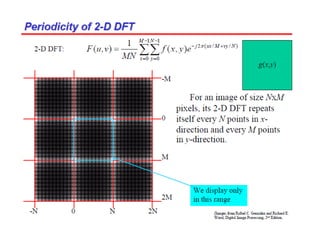
1. The document discusses image processing in the frequency domain, which involves transforming an image into its frequency distribution using mathematical operators called transformations like the Fourier transform.
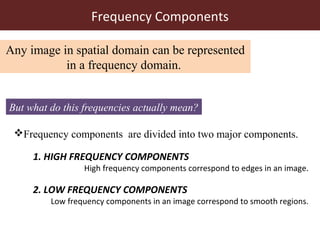
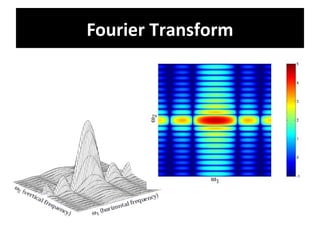
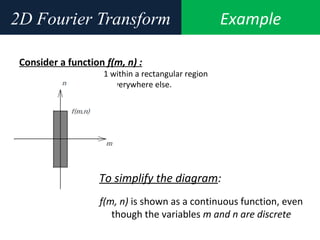
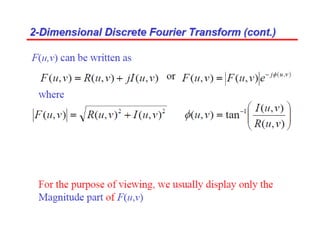
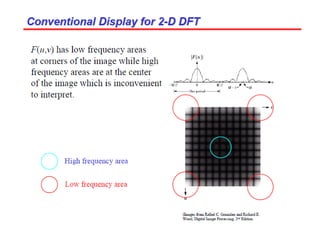
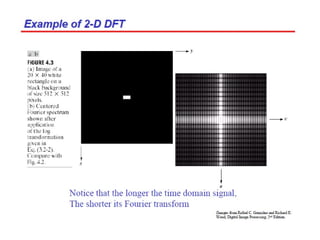
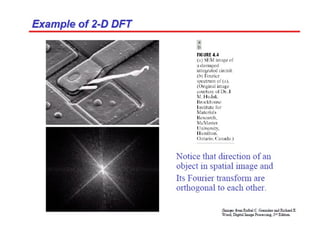
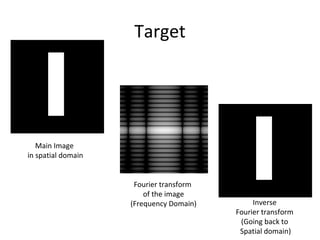
2. The Fourier transform decomposes an image into its frequency components, which can be divided into high frequency components corresponding to edges and low frequency components corresponding to smooth regions.
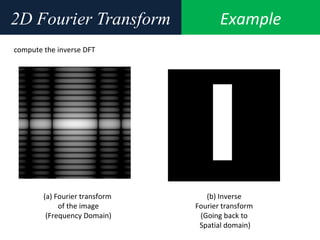
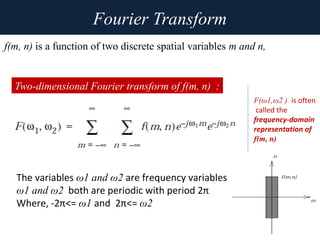
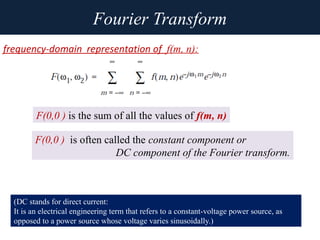
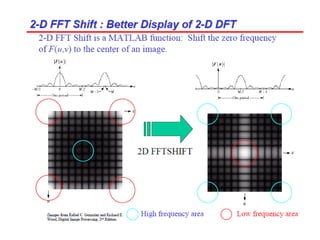
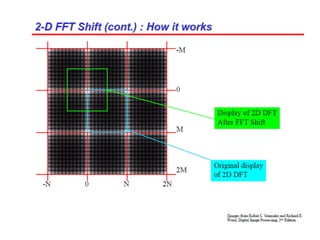
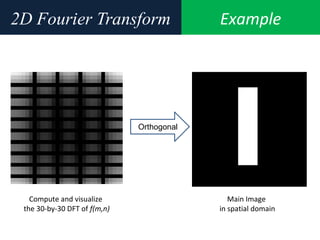
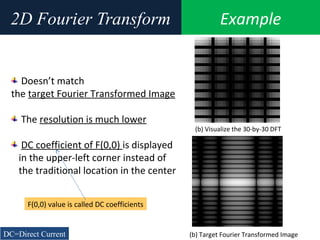
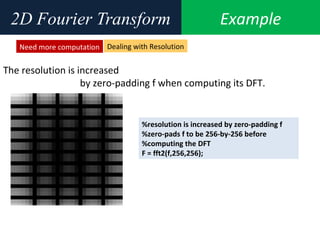
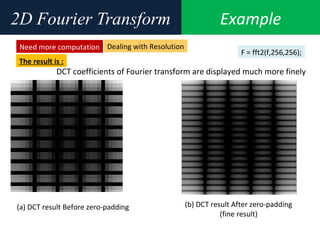
3. An example computes the 2D discrete Fourier transform of a toy image using zero-padding to increase resolution, and the fftshift function is used to center the DC coefficient when visualizing the transformed image.

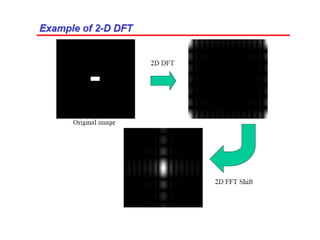

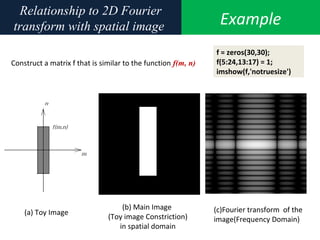
![Example2D Fourier Transform
Compute and visualize the 30-by-30 DFT of f(m,n)
F = fft2(f);
F2 = log(abs(F));
imshow(F2,[-1 5],'notruesize');
%% colormap(jet); colorbar](https://image.slidesharecdn.com/6-150414194315-conversion-gate01/85/6-frequency-domain-image_processing-35-320.jpg)
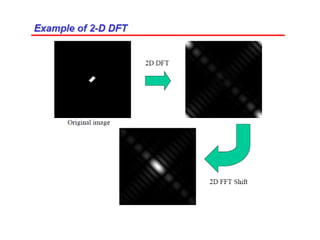
![Example2D Fourier Transform
Need more computation Dealing with displaying DC coefficient of F(0,0)
fix this problem by using the function fftshift,
which swaps the quadrants of F so that the DC
coefficient is in the center.
imshow(log(abs(F)),[-1 5]);
(b) Target Fourier Transformed Image](https://image.slidesharecdn.com/6-150414194315-conversion-gate01/85/6-frequency-domain-image_processing-39-320.jpg)