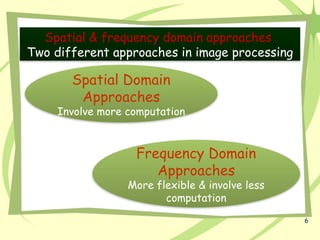
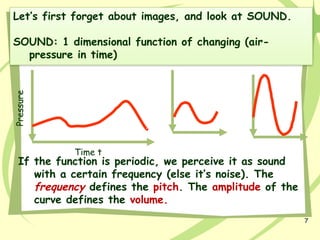
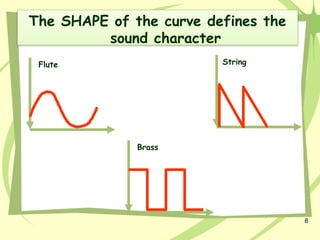
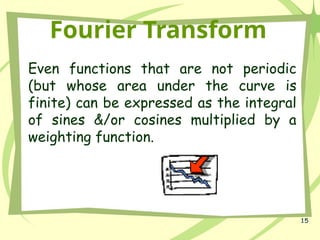
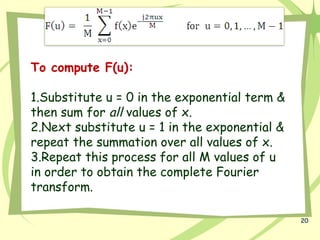
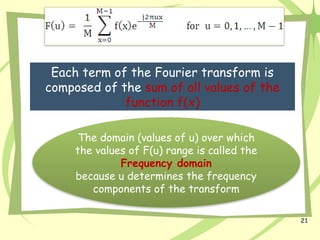
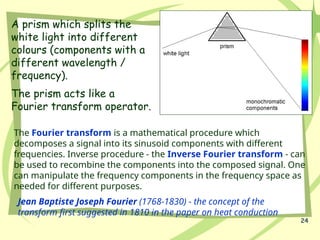
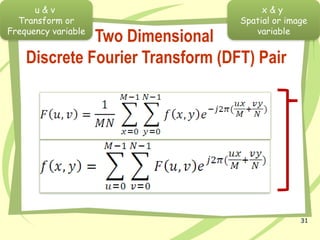
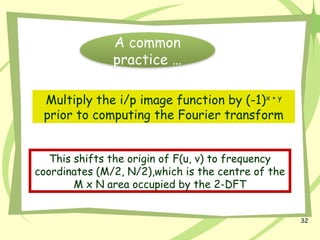
The document discusses image enhancement techniques, categorizing them into spatial and frequency domain methods. Filtering is emphasized as a crucial technique for improving image quality by manipulating pixel operations, and the significance of Fourier transforms in analyzing and processing both images and sound is explained. It details the mathematical foundations of Fourier series and transforms, showing how periodic functions can be decomposed into sinusoidal components, which can then be manipulated for various applications in image processing.


![27
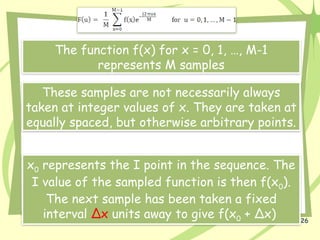
The kth
sample gives us f(x0 + k x)
∆
The final sample is ?
f(x0 + [M-1] x)
∆](https://image.slidesharecdn.com/dip0733-240913053500-2bac7d7a/85/Digital-Image-Processing-btech-third-year-27-320.jpg)
![28
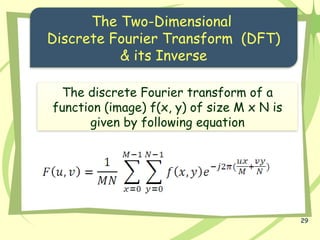
Variable u has similar interpretation
But …
The sequence always starts at true zero
frequency. Thus, the sequence for the values
of u is 0, ∆u, 2∆u, …, [M-1]∆u
Inverse relationship exits between a
function & its transform. Hence](https://image.slidesharecdn.com/dip0733-240913053500-2bac7d7a/85/Digital-Image-Processing-btech-third-year-28-320.jpg)


![[Deck] What's New in Spark-Iceberg Integration via DSV2.pptx](https://cdn.slidesharecdn.com/ss_thumbnails/deckwhatsnewinspark-icebergintegrationviadsv2-260210005337-25955b12-thumbnail.jpg?width=640&height=640&fit=bounds)


