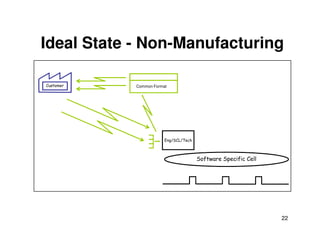
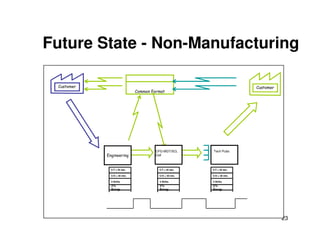
SlideShare a Scribd company logo
Value Stream Mapping 
1
Value Stream Mapping Definition 
• Value Stream Mapping (VSM): 
– Special type of flow chart that uses symbols 
known as "the language of Lean" to depict 
and improve the flow of inventory and 
2 
information.
Value Stream Mapping Purpose 
• Provide optimum value to the customer 
through a complete value creation process 
with minimum waste in: 
– Design (concept to customer) 
3 
– Build (order to delivery) 
– Sustain (in-use through life cycle to service)
Why ? 
• Many organizations pursuing “lean” conversions 
have realized that improvement events alone 
are not enough 
• Improvement events create localized 
improvements, value stream mapping & analysis 
strengthens the gains by providing vision and 
plans that connect all improvement activities 
4 
• Value stream mapping & analysis is a tool that 
allows you to see waste, and plan to eliminate it
What Is Value? 
• A capability provided to a customer 
– of the highest quality, 
– at the right time, 
– at an appropriate price, 
5 
as defined by the customer. 
• "Value" is what the customer is buying
What Is Value 
Stream Analysis? 
Planning tool to optimize 
results of eliminating waste 
current state VSM future state VSM 
6 
+ + Lean = 
Basics
Value Steam Mapping Steps 
Next Future State 
7 
Current State 
Future State 
Original State
Apply Five Simple Principles 
• Specify value from the standpoint of end 
customer 
• Identify the value stream for each product family 
• Make the product flow 
VALUE 
STREAM 
8 
• So the customer can pull 
• As you manage toward perfection 
Perfection 
VALUE 
PULL FLOW
What is the Value that Flows? 
Specify value from the standpoint of the end 
customer 
Ask how your current products and processes 
disappoint your customer’s value expectation: 
9 
• price? 
• quality? 
• reliable delivery? 
• rapid response to changing needs? 
• ???
What Flows? 
"ITEMS" flow through a value stream 
– In manufacturing, materials are the items 
– In design & development, designs are the items 
– In service, external customer needs are the items 
– In admin., internal customer needs are the items 
Analysis begins with part of a total value stream, 
That part of the value stream has customers too 
10
Value Stream Mapping Process 
Symbols 
Customer/Supplier Icon: represents the Supplier when in the upper 
left, customer when in the upper right, the usual end point for 
material 
Dedicated Process flow Icon: a process, operation, machine or 
department, through which material flows. It represents one 
department with a continuous, internal fixed flow. 
Shared Process Icon: a process, operation, department or 
11 
workcenter that other value stream families share. 
Data Box Icon: it goes under other icons that have significant 
information/data required for analyzing and observing the system. 
Workcell Icon: indicates that multiple processes are integrated in a 
manufacturing workcell.
Value Stream Mapping Material 
Symbols 
Inventory Icons: show inventory between two processes 
Shipments Icon: represents movement of raw materials from 
suppliers to the Receiving dock/s of the factory. Or, the movement of 
finished goods from the Shipping dock/s of the factory to the 
customers 
12 
Push Arrow Icon: represents the “pushing” of material from one 
process to the next process. 
Supermarket Icon: an inventory “supermarket” (kanban stockpoint). 
Material Pull Icon: supermarkets connect to downstream processes 
with this "Pull" icon that indicates physical removal.
Value Stream Mapping Material 
Symbols (Cont.) 
FIFO Lane Icon: First-In-First-Out inventory. Use this icon when 
processes are connected with a FIFO system that limits input. 
Safety Stock Icon: represents an inventory “hedge” (or safety stock) 
against problems such as downtime, to protect the system against 
sudden fluctuations in customer orders or system failures. 
13 
External Shipment Icon: shipments from suppliers or to customers 
using external transport
Value Stream Mapping 
Information Symbols 
Production Control Icon: This box represents a central production 
scheduling or control department, person or operation. 
Manual Info Icon : A straight, thin arrow shows general flow of 
information from memos, reports, or conversation. Frequency and 
other notes may be relevant. 
Electronic Info Icon : This wiggle arrow represents electronic flow 
14 
such as electronic data interchange (EDI), the Internet, Intranets, 
LANs (local area network), WANs (wide area network). You may 
indicate the frequency of information/data interchange, the type of 
media used ex. fax, phone, etc. and the type of data exchanged. 
Production Kanban Icon : This icon triggers production of a pre-defined 
number of parts. It signals a supplying process to provide 
parts to a downstream process. 
Withdrawal Kanban Icon : This icon represents a card or device that 
instructs a material handler to transfer parts from a supermarket to 
the receiving process. The material handler (or operator) goes to the 
supermarket and withdraws the necessary items.
Value Stream Mapping 
Information Symbols (Cont.) 
Signal Kanban Icon : used whenever the on-hand inventory levels in 
the supermarket between two processes drops to a trigger or 
minimum point. It is also referred as “one-per-batch” kanban. 
Kanban Post Icon : a location where kanban signals reside for 
pickup. Often used with two-card systems to exchange withdrawal 
and production kanban. 
Sequenced Pull Icon: represents a pull system that gives instruction 
15 
to subassembly processes to produce a predetermined type and 
quantity of product, typically one unit, without using a supermarket. 
Load Leveling Icon : a tool to batch kanbans in order to level the 
production volume and mix over a period of time. 
MRP/ERP Icon : scheduling using MRP/ERP or other centralized 
systems.
Value Stream Mapping 
Information Symbols (Cont.) 
Go See Icon : gathering of information through visual means. 
Verbal Information Icon: represents verbal or personal information 
flow. 
16
Value Stream Mapping 
General Symbols 
Kaizen Burst Icon: used to highlight improvement needs and plan 
kaizen workshops at specific processes that are critical to achieving 
the Future State Map of the value stream. 
Operator Icon : represents an operator. It shows the number of 
operators required to process the VSM family at a particular 
workstation. 
Other Icon : other useful or potentially useful information. 
17 
Timeline Icon : shows value added times (Cycle Times) and non-value 
added (wait) times. Use this to calculate Lead Time and Total 
Cycle Time.
TAKT TIME 
Effective Working Time per Shift 
Customer Requirement per Shift 
Takt Time = 
Synchronizes pace, evenly applying customer demand across the work day. 
18 
Takt Time is "Beat Time"? "Rate Time" or “Heart Beat" Lean Production uses Takt Time 
as the rate or time that a completed product is finished. If you have a Takt Time of two 
minutes that means every two minutes a complete product, assembly or machine is 
produced off the line. (http://www.isixsigma.com/dictionary/Takt_Time-455.htm)
Current State - Manufacturing 
19
Ideal State - Manufacturing 
ASSEMBLY COMPANY 
Production 
Control 
MACHINE COMPANY 
Production 
Control 
SUPPLIER 
20 
Ship 
CUSTOMER 
Stock MFG 
Same Site
Future State - Manufacturing 
21
Ideal State - Non-Manufacturing 
Customer Common Format 
22 
Eng/SCL/Tech 
Software Specific Cell
Future State - Non-Manufacturing 
Customer 
Common Format 
Customer 
23 
Engineering 
CFG MGT/SCL 
Cell 
Tech Pubs 
C/T = 45 sec. 
C/O = 30 min. 
3 Shifts 
2% 
Scrap 
C/T = 45 sec. 
C/O = 30 min. 
3 Shifts 
2% 
Scrap 
C/T = 45 sec. 
C/O = 30 min. 
3 Shifts 
2% 
Scrap
Step by Step Guide: An Example 
• John Smith works for ABC Company in charge of 
production. ABC company makes widgets and supply 
these through several retail outlets. Recently problems 
have emerged. 
– a shortage in supply to the retail outlets 
– Has high levels and value of inventory in the organization 
currently 
– a complaint letter to the company from a customer stating that as 
24 
a frequent consumer of the products, he’s dissatisfied at the 
quality of the product and that he often returns faulty widgets to 
the retail outlets 
• John’s unsure how to answer to these questions but he 
intends to get to the bottom of it and if possible improve 
the situation.
Step by Step Guide: An Example 
• Step 1 - Select your sponsor and set 
expectations 
– appoint someone who is responsible to make 
decisions, arbitrate solutions, and plan the 
25 
project. 
– The sponsor usually selects the processes 
that will be mapped and will usually have a 
firm grasp of what achievement is being 
targeted.
Step by Step Guide: An Example 
• Step 2 - Select your team 
– You should ensure that each area or 
stakeholder of the process is represented e.g. 
Sales, Purchasing, Warehouse etc. 
26
Step by Step Guide: An Example 
• Step 3 -Select process to be mapped 
– Value Stream Mapping is suitable for most 
businesses and can be used in 
Manufacturing, Logistics, Supply Chain and 
27 
some Service orientated Organizations.
Step by Step Guide: An Example 
• Step 4 - Collect data and produce current 
state map 
– process times, inventory or materials 
information, customer (or demand) 
requirements. 
– the future state maps will be developed using 
information captured here so it’s imperative 
you have a correct understanding of the 
business. 
28
Step by Step Guide: An Example 
• Step 5 - Critique Current state 
– challenge the current thinking, encourage 
your team to make suggestions, look for 
areas of waste. 
29
Step by Step Guide: An Example 
• Step 6 - Map Future State 
– compile a future state map based on the 
current state map and the critiques 
30
Step by Step Guide: An Example 
• Step 7 - Create Action Plan and deploy 
– taking the Future State map consider an 
action plan that could be implemented to 
change the current process to the future state. 
31
Step by Step Guide: An Example 
• Step 8 - Measure benefits 
– check to ensure that the benefits expected 
have been obtained – review each change 
made and analyze benefits 
32
Some Mapping Tips (1) 
• Always collect current-state information 
while walking the actual pathways of 
material and information flows yourself 
• Begin with a quick walk along the entire 
33 
door-to-door value stream 
• Begin at the shipping end and work 
upstream 
From Rother and Shook (2009)
Some Mapping Tips (2) 
• Bring your stopwatch and do not rely on 
standard times or information that you do 
not personally obtain 
• Map the whole value stream yourself 
34 
• Always draw by hand in pencil 
From Rother and Shook (2009)
References 
• New Lean Toolbox : Towards Fast Flexible Flow 
(2004), Bicheno, John, Picsie Books. 
• Learning to See (2009), Rother, Mike and Shook, 
John, Lean Enterprise Institute. 
• http://www.valuebasedmanagement.net/method 
35 
s_value_stream_mapping.html. 
• http://www.bizbodz.com/Business- 
Improvement/Lean/Value-Stream-Mapping-How-to- 
Guide-Part-1.asp. 
• http://www.strategosinc.com/value-stream-mapping- 
3.htm. 
• http://www.engineering.uiowa.edu/~cam/Docum 
ents/ValueStreamMapping.ppt.

More Related Content

What's hot

Value stream mapping - Future State
Value stream mapping - Future StateValue stream mapping - Future State
Value stream mapping - Future State
krishnaheda
 
Value Stream Mapping Process
Value Stream Mapping ProcessValue Stream Mapping Process
Value Stream Mapping Process
Anand Subramaniam
 
WEBINAR: Introduction to Value Stream Mapping
WEBINAR: Introduction to Value Stream MappingWEBINAR: Introduction to Value Stream Mapping
WEBINAR: Introduction to Value Stream Mapping
GoLeanSixSigma.com
 
Value Stream Mapping Overview Update
Value Stream Mapping Overview UpdateValue Stream Mapping Overview Update
Value Stream Mapping Overview Update
jheaton418
 
Lean Management and Kanban System
Lean Management and Kanban SystemLean Management and Kanban System
Lean Management and Kanban System
Gaurav Singh
 
Lean manufacturing ppt
Lean manufacturing pptLean manufacturing ppt
Lean manufacturing ppt
Muhammad Mueez Nazakat
 
Value stream mapping study with example
Value stream mapping study with exampleValue stream mapping study with example
Value stream mapping study with example
Mouhcine Nahal
 
Value Steam Mapping
Value Steam MappingValue Steam Mapping
Value Steam Mapping
antiquealterego
 
Kanban system (presentation for blog )
Kanban system (presentation for blog )Kanban system (presentation for blog )
Kanban system (presentation for blog )
industrialengg
 
Process planning SMED and VSM: Single minute exchange of die and Value stream...
Process planning SMED and VSM: Single minute exchange of die and Value stream...Process planning SMED and VSM: Single minute exchange of die and Value stream...
Process planning SMED and VSM: Single minute exchange of die and Value stream...
Yatinkumar Patel
 
Value stream mapping training
Value stream mapping trainingValue stream mapping training
Value stream mapping training
Justo Castellon
 
History of Lean manufacturing & TPS 14 Principal
History of Lean manufacturing & TPS 14 PrincipalHistory of Lean manufacturing & TPS 14 Principal
History of Lean manufacturing & TPS 14 PrincipalSumon Kumar Kundu
 
Lean basics
Lean basicsLean basics
Lean basics
Aryan Viswakarma
 
5 Steps to implementing Lean
5  Steps to implementing Lean5  Steps to implementing Lean
5 Steps to implementing Lean
Julian Kalac P.Eng
 
Lean Manufacturing - An Overview
Lean Manufacturing - An OverviewLean Manufacturing - An Overview
Lean Manufacturing - An Overview
Kanzen Institute Asia-Pacific
 
Value stream mapping- lean manufacturing tool
Value stream mapping- lean manufacturing toolValue stream mapping- lean manufacturing tool
Value stream mapping- lean manufacturing tool
bhanutomar
 
Lean Manufacturing Training
Lean Manufacturing TrainingLean Manufacturing Training
Lean Manufacturing Training
VISCAR INDUSTRIAL CAPACITY
 
Lean Manufacturing
Lean ManufacturingLean Manufacturing
Introduction To Lean
Introduction To LeanIntroduction To Lean
Introduction To Lean
GoLeanSixSigma.com
 
Lean principles
Lean principlesLean principles
Lean principles
Paul J. Walsh
 

What's hot (20)

Value stream mapping - Future State
Value stream mapping - Future StateValue stream mapping - Future State
Value stream mapping - Future State
 
Value Stream Mapping Process
Value Stream Mapping ProcessValue Stream Mapping Process
Value Stream Mapping Process
 
WEBINAR: Introduction to Value Stream Mapping
WEBINAR: Introduction to Value Stream MappingWEBINAR: Introduction to Value Stream Mapping
WEBINAR: Introduction to Value Stream Mapping
 
Value Stream Mapping Overview Update
Value Stream Mapping Overview UpdateValue Stream Mapping Overview Update
Value Stream Mapping Overview Update
 
Lean Management and Kanban System
Lean Management and Kanban SystemLean Management and Kanban System
Lean Management and Kanban System
 
Lean manufacturing ppt
Lean manufacturing pptLean manufacturing ppt
Lean manufacturing ppt
 
Value stream mapping study with example
Value stream mapping study with exampleValue stream mapping study with example
Value stream mapping study with example
 
Value Steam Mapping
Value Steam MappingValue Steam Mapping
Value Steam Mapping
 
Kanban system (presentation for blog )
Kanban system (presentation for blog )Kanban system (presentation for blog )
Kanban system (presentation for blog )
 
Process planning SMED and VSM: Single minute exchange of die and Value stream...
Process planning SMED and VSM: Single minute exchange of die and Value stream...Process planning SMED and VSM: Single minute exchange of die and Value stream...
Process planning SMED and VSM: Single minute exchange of die and Value stream...
 
Value stream mapping training
Value stream mapping trainingValue stream mapping training
Value stream mapping training
 
History of Lean manufacturing & TPS 14 Principal
History of Lean manufacturing & TPS 14 PrincipalHistory of Lean manufacturing & TPS 14 Principal
History of Lean manufacturing & TPS 14 Principal
 
Lean basics
Lean basicsLean basics
Lean basics
 
5 Steps to implementing Lean
5  Steps to implementing Lean5  Steps to implementing Lean
5 Steps to implementing Lean
 
Lean Manufacturing - An Overview
Lean Manufacturing - An OverviewLean Manufacturing - An Overview
Lean Manufacturing - An Overview
 
Value stream mapping- lean manufacturing tool
Value stream mapping- lean manufacturing toolValue stream mapping- lean manufacturing tool
Value stream mapping- lean manufacturing tool
 
Lean Manufacturing Training
Lean Manufacturing TrainingLean Manufacturing Training
Lean Manufacturing Training
 
Lean Manufacturing
Lean ManufacturingLean Manufacturing
Lean Manufacturing
 
Introduction To Lean
Introduction To LeanIntroduction To Lean
Introduction To Lean
 
Lean principles
Lean principlesLean principles
Lean principles
 

Similar to Value stream mapping (1)

VSM (Value Stream Map) metodologia Lean manufacturing
VSM (Value Stream Map) metodologia Lean manufacturingVSM (Value Stream Map) metodologia Lean manufacturing
VSM (Value Stream Map) metodologia Lean manufacturing
MarceloRamos255360
 
Value Stream Mapping
Value Stream MappingValue Stream Mapping
Value Stream Mapping
VARUN BABUNELSON
 
Mass to Lean to Six Sigma Path
Mass to Lean to Six Sigma PathMass to Lean to Six Sigma Path
Mass to Lean to Six Sigma Path
JohnHamman
 
Mass2 Lean2 Six Sigma
Mass2 Lean2 Six SigmaMass2 Lean2 Six Sigma
Mass2 Lean2 Six Sigma
guestb2a38a
 
Management information system
Management information systemManagement information system
Management information systemKush Sharma
 
Value Stream Mapping Training - ADDVALUE - Nilesh Arora
Value Stream Mapping Training - ADDVALUE - Nilesh AroraValue Stream Mapping Training - ADDVALUE - Nilesh Arora
Value Stream Mapping Training - ADDVALUE - Nilesh Arora
ADD VALUE CONSULTING Inc
 
Value stream mapping
Value stream mappingValue stream mapping
Value stream mappingAbhishek Jain
 
Learning to see (VSM)
Learning to see (VSM)Learning to see (VSM)
Learning to see (VSM)
Mohamed Effat
 
01-VSM-VSD-Training-Presentation-20140406-pptx.pptx
01-VSM-VSD-Training-Presentation-20140406-pptx.pptx01-VSM-VSD-Training-Presentation-20140406-pptx.pptx
01-VSM-VSD-Training-Presentation-20140406-pptx.pptx
abdullahmohamed10900
 
Ptak project
Ptak projectPtak project
Ptak project
Aiasha Siddiqua
 
VSM
VSMVSM
Eliminating the production bottlenecks
Eliminating the production bottlenecksEliminating the production bottlenecks
Eliminating the production bottlenecksdutconsult
 
Project Management (Practical Qustion Paper) [CBSGS - 75:25 Pattern] {2013-20...
Project Management (Practical Qustion Paper) [CBSGS - 75:25 Pattern] {2013-20...Project Management (Practical Qustion Paper) [CBSGS - 75:25 Pattern] {2013-20...
Project Management (Practical Qustion Paper) [CBSGS - 75:25 Pattern] {2013-20...
Mumbai B.Sc.IT Study
 
Caso de Sucesso Vodafone e Splunk
Caso de Sucesso Vodafone e SplunkCaso de Sucesso Vodafone e Splunk
Caso de Sucesso Vodafone e Splunk
Splunk
 
10-vcc-how-to-understand-and-complete-a-value-stream-map-v2.pdf
10-vcc-how-to-understand-and-complete-a-value-stream-map-v2.pdf10-vcc-how-to-understand-and-complete-a-value-stream-map-v2.pdf
10-vcc-how-to-understand-and-complete-a-value-stream-map-v2.pdf
BENCHERMUSHEMEZA1
 
how-to-understand-and-complete-a-value-stream-map
how-to-understand-and-complete-a-value-stream-maphow-to-understand-and-complete-a-value-stream-map
how-to-understand-and-complete-a-value-stream-map
BENCHERMUSHEMEZA1
 
value stream mapping
value stream mappingvalue stream mapping
value stream mapping
Jitesh Gaurav
 

Similar to Value stream mapping (1) (20)

VSM (Value Stream Map) metodologia Lean manufacturing
VSM (Value Stream Map) metodologia Lean manufacturingVSM (Value Stream Map) metodologia Lean manufacturing
VSM (Value Stream Map) metodologia Lean manufacturing
 
Value Stream Mapping
Value Stream MappingValue Stream Mapping
Value Stream Mapping
 
Mass to Lean to Six Sigma Path
Mass to Lean to Six Sigma PathMass to Lean to Six Sigma Path
Mass to Lean to Six Sigma Path
 
Mass2 Lean2 Six Sigma
Mass2 Lean2 Six SigmaMass2 Lean2 Six Sigma
Mass2 Lean2 Six Sigma
 
Management information system
Management information systemManagement information system
Management information system
 
VSM (Méthode HOSHIN)
VSM (Méthode HOSHIN)VSM (Méthode HOSHIN)
VSM (Méthode HOSHIN)
 
Value Stream Mapping Training - ADDVALUE - Nilesh Arora
Value Stream Mapping Training - ADDVALUE - Nilesh AroraValue Stream Mapping Training - ADDVALUE - Nilesh Arora
Value Stream Mapping Training - ADDVALUE - Nilesh Arora
 
Value stream mapping
Value stream mappingValue stream mapping
Value stream mapping
 
Learning to see (VSM)
Learning to see (VSM)Learning to see (VSM)
Learning to see (VSM)
 
01-VSM-VSD-Training-Presentation-20140406-pptx.pptx
01-VSM-VSD-Training-Presentation-20140406-pptx.pptx01-VSM-VSD-Training-Presentation-20140406-pptx.pptx
01-VSM-VSD-Training-Presentation-20140406-pptx.pptx
 
RFP Presentation Example
RFP Presentation ExampleRFP Presentation Example
RFP Presentation Example
 
Ptak project
Ptak projectPtak project
Ptak project
 
VSM
VSMVSM
VSM
 
Eliminating the production bottlenecks
Eliminating the production bottlenecksEliminating the production bottlenecks
Eliminating the production bottlenecks
 
Project Management (Practical Qustion Paper) [CBSGS - 75:25 Pattern] {2013-20...
Project Management (Practical Qustion Paper) [CBSGS - 75:25 Pattern] {2013-20...Project Management (Practical Qustion Paper) [CBSGS - 75:25 Pattern] {2013-20...
Project Management (Practical Qustion Paper) [CBSGS - 75:25 Pattern] {2013-20...
 
Caso de Sucesso Vodafone e Splunk
Caso de Sucesso Vodafone e SplunkCaso de Sucesso Vodafone e Splunk
Caso de Sucesso Vodafone e Splunk
 
10-vcc-how-to-understand-and-complete-a-value-stream-map-v2.pdf
10-vcc-how-to-understand-and-complete-a-value-stream-map-v2.pdf10-vcc-how-to-understand-and-complete-a-value-stream-map-v2.pdf
10-vcc-how-to-understand-and-complete-a-value-stream-map-v2.pdf
 
how-to-understand-and-complete-a-value-stream-map
how-to-understand-and-complete-a-value-stream-maphow-to-understand-and-complete-a-value-stream-map
how-to-understand-and-complete-a-value-stream-map
 
value stream mapping
value stream mappingvalue stream mapping
value stream mapping
 
Vsm
VsmVsm
Vsm
 

Recently uploaded

Recycled Concrete Aggregate in Construction Part III
Recycled Concrete Aggregate in Construction Part IIIRecycled Concrete Aggregate in Construction Part III
Recycled Concrete Aggregate in Construction Part III
Aditya Rajan Patra
 
Series of visio cisco devices Cisco_Icons.ppt
Series of visio cisco devices Cisco_Icons.pptSeries of visio cisco devices Cisco_Icons.ppt
Series of visio cisco devices Cisco_Icons.ppt
PauloRodrigues104553
 
原版制作(unimelb毕业证书)墨尔本大学毕业证Offer一模一样
原版制作(unimelb毕业证书)墨尔本大学毕业证Offer一模一样原版制作(unimelb毕业证书)墨尔本大学毕业证Offer一模一样
原版制作(unimelb毕业证书)墨尔本大学毕业证Offer一模一样
obonagu
 
Heap Sort (SS).ppt FOR ENGINEERING GRADUATES, BCA, MCA, MTECH, BSC STUDENTS
Heap Sort (SS).ppt FOR ENGINEERING GRADUATES, BCA, MCA, MTECH, BSC STUDENTSHeap Sort (SS).ppt FOR ENGINEERING GRADUATES, BCA, MCA, MTECH, BSC STUDENTS
Heap Sort (SS).ppt FOR ENGINEERING GRADUATES, BCA, MCA, MTECH, BSC STUDENTS
Soumen Santra
 
Low power architecture of logic gates using adiabatic techniques
Low power architecture of logic gates using adiabatic techniquesLow power architecture of logic gates using adiabatic techniques
Low power architecture of logic gates using adiabatic techniques
nooriasukmaningtyas
 
Swimming pool mechanical components design.pptx
Swimming pool  mechanical components design.pptxSwimming pool  mechanical components design.pptx
Swimming pool mechanical components design.pptx
yokeleetan1
 
一比一原版(SFU毕业证)西蒙菲莎大学毕业证成绩单如何办理
一比一原版(SFU毕业证)西蒙菲莎大学毕业证成绩单如何办理一比一原版(SFU毕业证)西蒙菲莎大学毕业证成绩单如何办理
一比一原版(SFU毕业证)西蒙菲莎大学毕业证成绩单如何办理
bakpo1
 
Ethernet Routing and switching chapter 1.ppt
Ethernet Routing and switching chapter 1.pptEthernet Routing and switching chapter 1.ppt
Ethernet Routing and switching chapter 1.ppt
azkamurat
 
Fundamentals of Induction Motor Drives.pptx
Fundamentals of Induction Motor Drives.pptxFundamentals of Induction Motor Drives.pptx
Fundamentals of Induction Motor Drives.pptx
manasideore6
 
Online aptitude test management system project report.pdf
Online aptitude test management system project report.pdfOnline aptitude test management system project report.pdf
Online aptitude test management system project report.pdf
Kamal Acharya
 
一比一原版(Otago毕业证)奥塔哥大学毕业证成绩单如何办理
一比一原版(Otago毕业证)奥塔哥大学毕业证成绩单如何办理一比一原版(Otago毕业证)奥塔哥大学毕业证成绩单如何办理
一比一原版(Otago毕业证)奥塔哥大学毕业证成绩单如何办理
dxobcob
 
Water billing management system project report.pdf
Water billing management system project report.pdfWater billing management system project report.pdf
Water billing management system project report.pdf
Kamal Acharya
 
bank management system in java and mysql report1.pdf
bank management system in java and mysql report1.pdfbank management system in java and mysql report1.pdf
bank management system in java and mysql report1.pdf
Divyam548318
 
Unbalanced Three Phase Systems and circuits.pptx
Unbalanced Three Phase Systems and circuits.pptxUnbalanced Three Phase Systems and circuits.pptx
Unbalanced Three Phase Systems and circuits.pptx
ChristineTorrepenida1
 
spirit beverages ppt without graphics.pptx
spirit beverages ppt without graphics.pptxspirit beverages ppt without graphics.pptx
spirit beverages ppt without graphics.pptx
Madan Karki
 
Hierarchical Digital Twin of a Naval Power System
Hierarchical Digital Twin of a Naval Power SystemHierarchical Digital Twin of a Naval Power System
Hierarchical Digital Twin of a Naval Power System
Kerry Sado
 
01-GPON Fundamental fttx ftth basic .pptx
01-GPON Fundamental fttx ftth basic .pptx01-GPON Fundamental fttx ftth basic .pptx
01-GPON Fundamental fttx ftth basic .pptx
benykoy2024
 
CHINA’S GEO-ECONOMIC OUTREACH IN CENTRAL ASIAN COUNTRIES AND FUTURE PROSPECT
CHINA’S GEO-ECONOMIC OUTREACH IN CENTRAL ASIAN COUNTRIES AND FUTURE PROSPECTCHINA’S GEO-ECONOMIC OUTREACH IN CENTRAL ASIAN COUNTRIES AND FUTURE PROSPECT
CHINA’S GEO-ECONOMIC OUTREACH IN CENTRAL ASIAN COUNTRIES AND FUTURE PROSPECT
jpsjournal1
 
ACRP 4-09 Risk Assessment Method to Support Modification of Airfield Separat...
ACRP 4-09 Risk Assessment Method to Support Modification of Airfield Separat...ACRP 4-09 Risk Assessment Method to Support Modification of Airfield Separat...
ACRP 4-09 Risk Assessment Method to Support Modification of Airfield Separat...
Mukeshwaran Balu
 
14 Template Contractual Notice - EOT Application
14 Template Contractual Notice - EOT Application14 Template Contractual Notice - EOT Application
14 Template Contractual Notice - EOT Application
SyedAbiiAzazi1
 

Recently uploaded (20)

Recycled Concrete Aggregate in Construction Part III
Recycled Concrete Aggregate in Construction Part IIIRecycled Concrete Aggregate in Construction Part III
Recycled Concrete Aggregate in Construction Part III
 
Series of visio cisco devices Cisco_Icons.ppt
Series of visio cisco devices Cisco_Icons.pptSeries of visio cisco devices Cisco_Icons.ppt
Series of visio cisco devices Cisco_Icons.ppt
 
原版制作(unimelb毕业证书)墨尔本大学毕业证Offer一模一样
原版制作(unimelb毕业证书)墨尔本大学毕业证Offer一模一样原版制作(unimelb毕业证书)墨尔本大学毕业证Offer一模一样
原版制作(unimelb毕业证书)墨尔本大学毕业证Offer一模一样
 
Heap Sort (SS).ppt FOR ENGINEERING GRADUATES, BCA, MCA, MTECH, BSC STUDENTS
Heap Sort (SS).ppt FOR ENGINEERING GRADUATES, BCA, MCA, MTECH, BSC STUDENTSHeap Sort (SS).ppt FOR ENGINEERING GRADUATES, BCA, MCA, MTECH, BSC STUDENTS
Heap Sort (SS).ppt FOR ENGINEERING GRADUATES, BCA, MCA, MTECH, BSC STUDENTS
 
Low power architecture of logic gates using adiabatic techniques
Low power architecture of logic gates using adiabatic techniquesLow power architecture of logic gates using adiabatic techniques
Low power architecture of logic gates using adiabatic techniques
 
Swimming pool mechanical components design.pptx
Swimming pool  mechanical components design.pptxSwimming pool  mechanical components design.pptx
Swimming pool mechanical components design.pptx
 
一比一原版(SFU毕业证)西蒙菲莎大学毕业证成绩单如何办理
一比一原版(SFU毕业证)西蒙菲莎大学毕业证成绩单如何办理一比一原版(SFU毕业证)西蒙菲莎大学毕业证成绩单如何办理
一比一原版(SFU毕业证)西蒙菲莎大学毕业证成绩单如何办理
 
Ethernet Routing and switching chapter 1.ppt
Ethernet Routing and switching chapter 1.pptEthernet Routing and switching chapter 1.ppt
Ethernet Routing and switching chapter 1.ppt
 
Fundamentals of Induction Motor Drives.pptx
Fundamentals of Induction Motor Drives.pptxFundamentals of Induction Motor Drives.pptx
Fundamentals of Induction Motor Drives.pptx
 
Online aptitude test management system project report.pdf
Online aptitude test management system project report.pdfOnline aptitude test management system project report.pdf
Online aptitude test management system project report.pdf
 
一比一原版(Otago毕业证)奥塔哥大学毕业证成绩单如何办理
一比一原版(Otago毕业证)奥塔哥大学毕业证成绩单如何办理一比一原版(Otago毕业证)奥塔哥大学毕业证成绩单如何办理
一比一原版(Otago毕业证)奥塔哥大学毕业证成绩单如何办理
 
Water billing management system project report.pdf
Water billing management system project report.pdfWater billing management system project report.pdf
Water billing management system project report.pdf
 
bank management system in java and mysql report1.pdf
bank management system in java and mysql report1.pdfbank management system in java and mysql report1.pdf
bank management system in java and mysql report1.pdf
 
Unbalanced Three Phase Systems and circuits.pptx
Unbalanced Three Phase Systems and circuits.pptxUnbalanced Three Phase Systems and circuits.pptx
Unbalanced Three Phase Systems and circuits.pptx
 
spirit beverages ppt without graphics.pptx
spirit beverages ppt without graphics.pptxspirit beverages ppt without graphics.pptx
spirit beverages ppt without graphics.pptx
 
Hierarchical Digital Twin of a Naval Power System
Hierarchical Digital Twin of a Naval Power SystemHierarchical Digital Twin of a Naval Power System
Hierarchical Digital Twin of a Naval Power System
 
01-GPON Fundamental fttx ftth basic .pptx
01-GPON Fundamental fttx ftth basic .pptx01-GPON Fundamental fttx ftth basic .pptx
01-GPON Fundamental fttx ftth basic .pptx
 
CHINA’S GEO-ECONOMIC OUTREACH IN CENTRAL ASIAN COUNTRIES AND FUTURE PROSPECT
CHINA’S GEO-ECONOMIC OUTREACH IN CENTRAL ASIAN COUNTRIES AND FUTURE PROSPECTCHINA’S GEO-ECONOMIC OUTREACH IN CENTRAL ASIAN COUNTRIES AND FUTURE PROSPECT
CHINA’S GEO-ECONOMIC OUTREACH IN CENTRAL ASIAN COUNTRIES AND FUTURE PROSPECT
 
ACRP 4-09 Risk Assessment Method to Support Modification of Airfield Separat...
ACRP 4-09 Risk Assessment Method to Support Modification of Airfield Separat...ACRP 4-09 Risk Assessment Method to Support Modification of Airfield Separat...
ACRP 4-09 Risk Assessment Method to Support Modification of Airfield Separat...
 
14 Template Contractual Notice - EOT Application
14 Template Contractual Notice - EOT Application14 Template Contractual Notice - EOT Application
14 Template Contractual Notice - EOT Application
 

Value stream mapping (1)

  • 2. Value Stream Mapping Definition • Value Stream Mapping (VSM): – Special type of flow chart that uses symbols known as "the language of Lean" to depict and improve the flow of inventory and 2 information.
  • 3. Value Stream Mapping Purpose • Provide optimum value to the customer through a complete value creation process with minimum waste in: – Design (concept to customer) 3 – Build (order to delivery) – Sustain (in-use through life cycle to service)
  • 4. Why ? • Many organizations pursuing “lean” conversions have realized that improvement events alone are not enough • Improvement events create localized improvements, value stream mapping & analysis strengthens the gains by providing vision and plans that connect all improvement activities 4 • Value stream mapping & analysis is a tool that allows you to see waste, and plan to eliminate it
  • 5. What Is Value? • A capability provided to a customer – of the highest quality, – at the right time, – at an appropriate price, 5 as defined by the customer. • "Value" is what the customer is buying
  • 6. What Is Value Stream Analysis? Planning tool to optimize results of eliminating waste current state VSM future state VSM 6 + + Lean = Basics
  • 7. Value Steam Mapping Steps Next Future State 7 Current State Future State Original State
  • 8. Apply Five Simple Principles • Specify value from the standpoint of end customer • Identify the value stream for each product family • Make the product flow VALUE STREAM 8 • So the customer can pull • As you manage toward perfection Perfection VALUE PULL FLOW
  • 9. What is the Value that Flows? Specify value from the standpoint of the end customer Ask how your current products and processes disappoint your customer’s value expectation: 9 • price? • quality? • reliable delivery? • rapid response to changing needs? • ???
  • 10. What Flows? "ITEMS" flow through a value stream – In manufacturing, materials are the items – In design & development, designs are the items – In service, external customer needs are the items – In admin., internal customer needs are the items Analysis begins with part of a total value stream, That part of the value stream has customers too 10
  • 11. Value Stream Mapping Process Symbols Customer/Supplier Icon: represents the Supplier when in the upper left, customer when in the upper right, the usual end point for material Dedicated Process flow Icon: a process, operation, machine or department, through which material flows. It represents one department with a continuous, internal fixed flow. Shared Process Icon: a process, operation, department or 11 workcenter that other value stream families share. Data Box Icon: it goes under other icons that have significant information/data required for analyzing and observing the system. Workcell Icon: indicates that multiple processes are integrated in a manufacturing workcell.
  • 12. Value Stream Mapping Material Symbols Inventory Icons: show inventory between two processes Shipments Icon: represents movement of raw materials from suppliers to the Receiving dock/s of the factory. Or, the movement of finished goods from the Shipping dock/s of the factory to the customers 12 Push Arrow Icon: represents the “pushing” of material from one process to the next process. Supermarket Icon: an inventory “supermarket” (kanban stockpoint). Material Pull Icon: supermarkets connect to downstream processes with this "Pull" icon that indicates physical removal.
  • 13. Value Stream Mapping Material Symbols (Cont.) FIFO Lane Icon: First-In-First-Out inventory. Use this icon when processes are connected with a FIFO system that limits input. Safety Stock Icon: represents an inventory “hedge” (or safety stock) against problems such as downtime, to protect the system against sudden fluctuations in customer orders or system failures. 13 External Shipment Icon: shipments from suppliers or to customers using external transport
  • 14. Value Stream Mapping Information Symbols Production Control Icon: This box represents a central production scheduling or control department, person or operation. Manual Info Icon : A straight, thin arrow shows general flow of information from memos, reports, or conversation. Frequency and other notes may be relevant. Electronic Info Icon : This wiggle arrow represents electronic flow 14 such as electronic data interchange (EDI), the Internet, Intranets, LANs (local area network), WANs (wide area network). You may indicate the frequency of information/data interchange, the type of media used ex. fax, phone, etc. and the type of data exchanged. Production Kanban Icon : This icon triggers production of a pre-defined number of parts. It signals a supplying process to provide parts to a downstream process. Withdrawal Kanban Icon : This icon represents a card or device that instructs a material handler to transfer parts from a supermarket to the receiving process. The material handler (or operator) goes to the supermarket and withdraws the necessary items.
  • 15. Value Stream Mapping Information Symbols (Cont.) Signal Kanban Icon : used whenever the on-hand inventory levels in the supermarket between two processes drops to a trigger or minimum point. It is also referred as “one-per-batch” kanban. Kanban Post Icon : a location where kanban signals reside for pickup. Often used with two-card systems to exchange withdrawal and production kanban. Sequenced Pull Icon: represents a pull system that gives instruction 15 to subassembly processes to produce a predetermined type and quantity of product, typically one unit, without using a supermarket. Load Leveling Icon : a tool to batch kanbans in order to level the production volume and mix over a period of time. MRP/ERP Icon : scheduling using MRP/ERP or other centralized systems.
  • 16. Value Stream Mapping Information Symbols (Cont.) Go See Icon : gathering of information through visual means. Verbal Information Icon: represents verbal or personal information flow. 16
  • 17. Value Stream Mapping General Symbols Kaizen Burst Icon: used to highlight improvement needs and plan kaizen workshops at specific processes that are critical to achieving the Future State Map of the value stream. Operator Icon : represents an operator. It shows the number of operators required to process the VSM family at a particular workstation. Other Icon : other useful or potentially useful information. 17 Timeline Icon : shows value added times (Cycle Times) and non-value added (wait) times. Use this to calculate Lead Time and Total Cycle Time.
  • 18. TAKT TIME Effective Working Time per Shift Customer Requirement per Shift Takt Time = Synchronizes pace, evenly applying customer demand across the work day. 18 Takt Time is "Beat Time"? "Rate Time" or “Heart Beat" Lean Production uses Takt Time as the rate or time that a completed product is finished. If you have a Takt Time of two minutes that means every two minutes a complete product, assembly or machine is produced off the line. (http://www.isixsigma.com/dictionary/Takt_Time-455.htm)
  • 19. Current State - Manufacturing 19
  • 20. Ideal State - Manufacturing ASSEMBLY COMPANY Production Control MACHINE COMPANY Production Control SUPPLIER 20 Ship CUSTOMER Stock MFG Same Site
  • 21. Future State - Manufacturing 21
  • 22. Ideal State - Non-Manufacturing Customer Common Format 22 Eng/SCL/Tech Software Specific Cell
  • 23. Future State - Non-Manufacturing Customer Common Format Customer 23 Engineering CFG MGT/SCL Cell Tech Pubs C/T = 45 sec. C/O = 30 min. 3 Shifts 2% Scrap C/T = 45 sec. C/O = 30 min. 3 Shifts 2% Scrap C/T = 45 sec. C/O = 30 min. 3 Shifts 2% Scrap
  • 24. Step by Step Guide: An Example • John Smith works for ABC Company in charge of production. ABC company makes widgets and supply these through several retail outlets. Recently problems have emerged. – a shortage in supply to the retail outlets – Has high levels and value of inventory in the organization currently – a complaint letter to the company from a customer stating that as 24 a frequent consumer of the products, he’s dissatisfied at the quality of the product and that he often returns faulty widgets to the retail outlets • John’s unsure how to answer to these questions but he intends to get to the bottom of it and if possible improve the situation.
  • 25. Step by Step Guide: An Example • Step 1 - Select your sponsor and set expectations – appoint someone who is responsible to make decisions, arbitrate solutions, and plan the 25 project. – The sponsor usually selects the processes that will be mapped and will usually have a firm grasp of what achievement is being targeted.
  • 26. Step by Step Guide: An Example • Step 2 - Select your team – You should ensure that each area or stakeholder of the process is represented e.g. Sales, Purchasing, Warehouse etc. 26
  • 27. Step by Step Guide: An Example • Step 3 -Select process to be mapped – Value Stream Mapping is suitable for most businesses and can be used in Manufacturing, Logistics, Supply Chain and 27 some Service orientated Organizations.
  • 28. Step by Step Guide: An Example • Step 4 - Collect data and produce current state map – process times, inventory or materials information, customer (or demand) requirements. – the future state maps will be developed using information captured here so it’s imperative you have a correct understanding of the business. 28
  • 29. Step by Step Guide: An Example • Step 5 - Critique Current state – challenge the current thinking, encourage your team to make suggestions, look for areas of waste. 29
  • 30. Step by Step Guide: An Example • Step 6 - Map Future State – compile a future state map based on the current state map and the critiques 30
  • 31. Step by Step Guide: An Example • Step 7 - Create Action Plan and deploy – taking the Future State map consider an action plan that could be implemented to change the current process to the future state. 31
  • 32. Step by Step Guide: An Example • Step 8 - Measure benefits – check to ensure that the benefits expected have been obtained – review each change made and analyze benefits 32
  • 33. Some Mapping Tips (1) • Always collect current-state information while walking the actual pathways of material and information flows yourself • Begin with a quick walk along the entire 33 door-to-door value stream • Begin at the shipping end and work upstream From Rother and Shook (2009)
  • 34. Some Mapping Tips (2) • Bring your stopwatch and do not rely on standard times or information that you do not personally obtain • Map the whole value stream yourself 34 • Always draw by hand in pencil From Rother and Shook (2009)
  • 35. References • New Lean Toolbox : Towards Fast Flexible Flow (2004), Bicheno, John, Picsie Books. • Learning to See (2009), Rother, Mike and Shook, John, Lean Enterprise Institute. • http://www.valuebasedmanagement.net/method 35 s_value_stream_mapping.html. • http://www.bizbodz.com/Business- Improvement/Lean/Value-Stream-Mapping-How-to- Guide-Part-1.asp. • http://www.strategosinc.com/value-stream-mapping- 3.htm. • http://www.engineering.uiowa.edu/~cam/Docum ents/ValueStreamMapping.ppt.