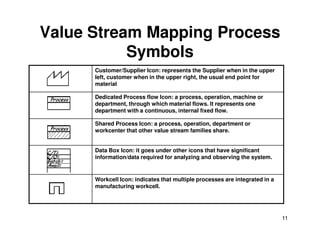
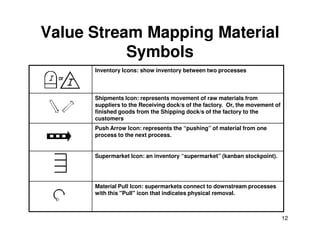
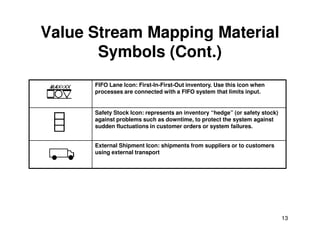
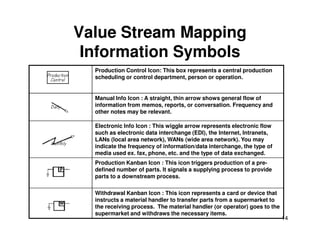
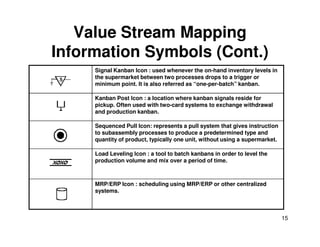
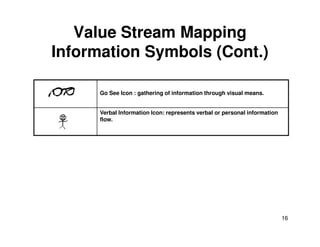
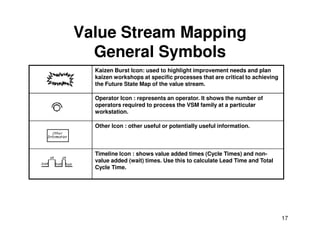
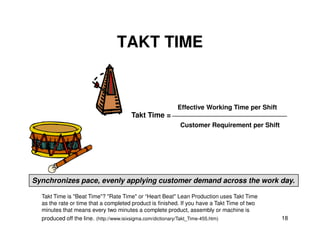
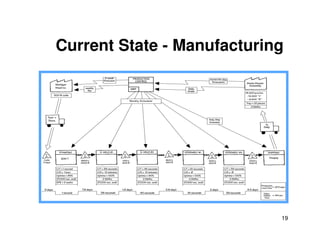
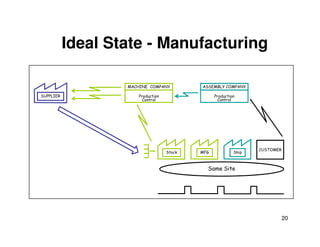
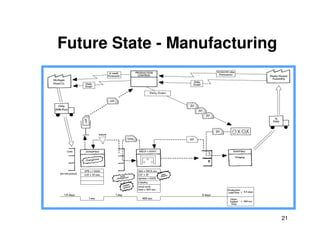
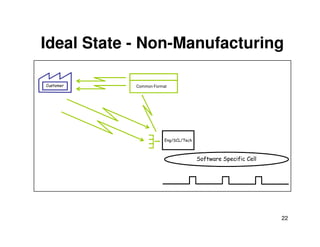
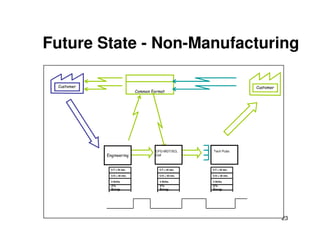
Value Stream Mapping
1
Value Stream Mapping Definition
• Value Stream Mapping (VSM):
– Special type of flow chart that uses symbols
known as "the language of Lean" to depict
and improve the flow of inventory and
2
and improve the flow of inventory and
information.
Value Stream Mapping Purpose
• Provide optimum value to the customer
through a complete value creation process
with minimum waste in:
– Design (concept to customer)
3
– Design (concept to customer)
– Build (order to delivery)
– Sustain (in-use through life cycle to service)
Why ?
• Many organizations pursuing “lean” conversions
have realized that improvement events alone
are not enough
• Improvement events create localized
4
• Improvement events create localized
improvements, value stream mapping & analysis
strengthens the gains by providing vision and
plans that connect all improvement activities
• Value stream mapping & analysis is a tool that
allows you to see waste, and plan to eliminate it
What Is Value?
• A capability provided to a customer
– of the highest quality,
– at the right time,
– at an appropriate price,
5
– at an appropriate price,
as defined by the customer.
• "Value" is what the customer is buying
Planning tool to optimize
results of eliminating waste
What Is Value
Stream Analysis?
6
results of eliminating waste
+ + =
Lean
Basics
current state VSM future state VSM
Value Steam Mapping Steps
Next Future State
7
Current State
Future State
Original State
Apply Five Simple Principles
• Specify value from the standpoint of end
customer
• Identify the value stream for each product family
• Make the product flow
8
• Make the product flow
• So the customer can pull
• As you manage toward perfection
Perfection
PULL FLOW
VALUE
STREAM
VALUE
What is the Value that Flows?
Specify value from the standpoint of the end
customer
Ask how your current products and processes
disappoint your customer’s value expectation:
9
disappoint your customer’s value expectation:
• price?
• quality?
• reliable delivery?
• rapid response to changing needs?
• ???
"ITEMS" flow through a value stream
– In manufacturing, materials are the items
– In design & development, designs are the items
– In service, external customer needs are the items
What Flows?
10
– In service, external customer needs are the items
– In admin., internal customer needs are the items
Analysis begins with part of a total value stream,
That part of the value stream has customers too
Value Stream Mapping Process
Symbols
Customer/Supplier Icon: represents the Supplier when in the upper
left, customer when in the upper right, the usual end point for
material
Dedicated Process flow Icon: a process, operation, machine or
department, through which material flows. It represents one
department with a continuous, internal fixed flow.
Shared Process Icon: a process, operation, department or
11
Shared Process Icon: a process, operation, department or
workcenter that other value stream families share.
Data Box Icon: it goes under other icons that have significant
information/data required for analyzing and observing the system.
Workcell Icon: indicates that multiple processes are integrated in a
manufacturing workcell.
Value Stream Mapping Material
Symbols
Inventory Icons: show inventory between two processes
Shipments Icon: represents movement of raw materials from
suppliers to the Receiving dock/s of the factory. Or, the movement of
finished goods from the Shipping dock/s of the factory to the
customers
12
Push Arrow Icon: represents the “pushing” of material from one
process to the next process.
Supermarket Icon: an inventory “supermarket” (kanban stockpoint).
Material Pull Icon: supermarkets connect to downstream processes
with this "Pull" icon that indicates physical removal.
Value Stream Mapping Material
Symbols (Cont.)
FIFO Lane Icon: First-In-First-Out inventory. Use this icon when
processes are connected with a FIFO system that limits input.
Safety Stock Icon: represents an inventory “hedge” (or safety stock)
against problems such as downtime, to protect the system against
sudden fluctuations in customer orders or system failures.
13
sudden fluctuations in customer orders or system failures.
External Shipment Icon: shipments from suppliers or to customers
using external transport
Value Stream Mapping
Information Symbols
Production Control Icon: This box represents a central production
scheduling or control department, person or operation.
Manual Info Icon : A straight, thin arrow shows general flow of
information from memos, reports, or conversation. Frequency and
other notes may be relevant.
Electronic Info Icon : This wiggle arrow represents electronic flow
14
Electronic Info Icon : This wiggle arrow represents electronic flow
such as electronic data interchange (EDI), the Internet, Intranets,
LANs (local area network), WANs (wide area network). You may
indicate the frequency of information/data interchange, the type of
media used ex. fax, phone, etc. and the type of data exchanged.
Production Kanban Icon : This icon triggers production of a pre-
defined number of parts. It signals a supplying process to provide
parts to a downstream process.
Withdrawal Kanban Icon : This icon represents a card or device that
instructs a material handler to transfer parts from a supermarket to
the receiving process. The material handler (or operator) goes to the
supermarket and withdraws the necessary items.
Value Stream Mapping
Information Symbols (Cont.)
Signal Kanban Icon : used whenever the on-hand inventory levels in
the supermarket between two processes drops to a trigger or
minimum point. It is also referred as “one-per-batch” kanban.
Kanban Post Icon : a location where kanban signals reside for
pickup. Often used with two-card systems to exchange withdrawal
and production kanban.
Sequenced Pull Icon: represents a pull system that gives instruction
15
Sequenced Pull Icon: represents a pull system that gives instruction
to subassembly processes to produce a predetermined type and
quantity of product, typically one unit, without using a supermarket.
Load Leveling Icon : a tool to batch kanbans in order to level the
production volume and mix over a period of time.
MRP/ERP Icon : scheduling using MRP/ERP or other centralized
systems.
Value Stream Mapping
Information Symbols (Cont.)
Go See Icon : gathering of information through visual means.
Verbal Information Icon: represents verbal or personal information
flow.
16
Value Stream Mapping
General Symbols
Kaizen Burst Icon: used to highlight improvement needs and plan
kaizen workshops at specific processes that are critical to achieving
the Future State Map of the value stream.
Operator Icon : represents an operator. It shows the number of
operators required to process the VSM family at a particular
workstation.
Other Icon : other useful or potentially useful information.
17
Other Icon : other useful or potentially useful information.
Timeline Icon : shows value added times (Cycle Times) and non-
value added (wait) times. Use this to calculate Lead Time and Total
Cycle Time.
TAKT TIME
Effective Working Time per Shift
Customer Requirement per Shift
Takt Time =
18
Customer Requirement per Shift
Synchronizes pace, evenly applying customer demand across the work day.
Takt Time is "Beat Time"? "Rate Time" or “Heart Beat" Lean Production uses Takt Time
as the rate or time that a completed product is finished. If you have a Takt Time of two
minutes that means every two minutes a complete product, assembly or machine is
produced off the line. (http://www.isixsigma.com/dictionary/Takt_Time-455.htm)
Current State - Manufacturing
19
Ideal State - Manufacturing
Production
Control
ASSEMBLY COMPANY
Production
Control
MACHINE COMPANY
SUPPLIER
20
Ship
CUSTOMER
MFG
Stock
Same Site
Future State - Manufacturing
21
Ideal State - Non-Manufacturing
Customer Common Format
22
Eng/SCL/Tech
Software Specific Cell
Future State - Non-Manufacturing
Customer
Common Format
Customer
23
Engineering
CFG MGT/SCL
Cell
Tech Pubs
C/T = 45 sec.
C/O = 30 min.
3 Shifts
2%
Scrap
C/T = 45 sec.
C/O = 30 min.
3 Shifts
2%
Scrap
C/T = 45 sec.
C/O = 30 min.
3 Shifts
2%
Scrap
Step by Step Guide: An Example
• John Smith works for ABC Company in charge of
production. ABC company makes widgets and supply
these through several retail outlets. Recently problems
have emerged.
– a shortage in supply to the retail outlets
– Has high levels and value of inventory in the organization
currently
24
currently
– a complaint letter to the company from a customer stating that as
a frequent consumer of the products, he’s dissatisfied at the
quality of the product and that he often returns faulty widgets to
the retail outlets
• John’s unsure how to answer to these questions but he
intends to get to the bottom of it and if possible improve
the situation.
Step by Step Guide: An Example
• Step 1 - Select your sponsor and set
expectations
– appoint someone who is responsible to make
decisions, arbitrate solutions, and plan the
25
decisions, arbitrate solutions, and plan the
project.
– The sponsor usually selects the processes
that will be mapped and will usually have a
firm grasp of what achievement is being
targeted.
Step by Step Guide: An Example
• Step 2 - Select your team
– You should ensure that each area or
stakeholder of the process is represented e.g.
Sales, Purchasing, Warehouse etc.
26
Sales, Purchasing, Warehouse etc.
Step by Step Guide: An Example
• Step 3 -Select process to be mapped
– Value Stream Mapping is suitable for most
businesses and can be used in
Manufacturing, Logistics, Supply Chain and
27
Manufacturing, Logistics, Supply Chain and
some Service orientated Organizations.
Step by Step Guide: An Example
• Step 4 - Collect data and produce current
state map
– process times, inventory or materials
information, customer (or demand)
28
information, customer (or demand)
requirements.
– the future state maps will be developed using
information captured here so it’s imperative
you have a correct understanding of the
business.
Step by Step Guide: An Example
• Step 5 - Critique Current state
– challenge the current thinking, encourage
your team to make suggestions, look for
areas of waste.
29
areas of waste.
Step by Step Guide: An Example
• Step 6 - Map Future State
– compile a future state map based on the
current state map and the critiques
30
Step by Step Guide: An Example
• Step 7 - Create Action Plan and deploy
– taking the Future State map consider an
action plan that could be implemented to
change the current process to the future state.
31
change the current process to the future state.
Step by Step Guide: An Example
• Step 8 - Measure benefits
– check to ensure that the benefits expected
have been obtained – review each change
made and analyze benefits
32
made and analyze benefits
Some Mapping Tips (1)
• Always collect current-state information
while walking the actual pathways of
material and information flows yourself
• Begin with a quick walk along the entire
33
• Begin with a quick walk along the entire
door-to-door value stream
• Begin at the shipping end and work
upstream
From Rother and Shook (2009)
Some Mapping Tips (2)
• Bring your stopwatch and do not rely on
standard times or information that you do
not personally obtain
• Map the whole value stream yourself
34
• Map the whole value stream yourself
• Always draw by hand in pencil
From Rother and Shook (2009)
References
• New Lean Toolbox : Towards Fast Flexible Flow
(2004), Bicheno, John, Picsie Books.
• Learning to See (2009), Rother, Mike and Shook,
John, Lean Enterprise Institute.
• http://www.valuebasedmanagement.net/method
35
• http://www.valuebasedmanagement.net/method
s_value_stream_mapping.html.
• http://www.bizbodz.com/Business-
Improvement/Lean/Value-Stream-Mapping-How-
to-Guide-Part-1.asp.
• http://www.strategosinc.com/value-stream-
mapping-3.htm.
• http://www.engineering.uiowa.edu/~cam/Docum
ents/ValueStreamMapping.ppt.

VSM (Value Stream Map) metodologia Lean manufacturing

  • 1.
  • 2.
    Value Stream MappingDefinition • Value Stream Mapping (VSM): – Special type of flow chart that uses symbols known as "the language of Lean" to depict and improve the flow of inventory and 2 and improve the flow of inventory and information.
  • 3.
    Value Stream MappingPurpose • Provide optimum value to the customer through a complete value creation process with minimum waste in: – Design (concept to customer) 3 – Design (concept to customer) – Build (order to delivery) – Sustain (in-use through life cycle to service)
  • 4.
    Why ? • Manyorganizations pursuing “lean” conversions have realized that improvement events alone are not enough • Improvement events create localized 4 • Improvement events create localized improvements, value stream mapping & analysis strengthens the gains by providing vision and plans that connect all improvement activities • Value stream mapping & analysis is a tool that allows you to see waste, and plan to eliminate it
  • 5.
    What Is Value? •A capability provided to a customer – of the highest quality, – at the right time, – at an appropriate price, 5 – at an appropriate price, as defined by the customer. • "Value" is what the customer is buying
  • 6.
    Planning tool tooptimize results of eliminating waste What Is Value Stream Analysis? 6 results of eliminating waste + + = Lean Basics current state VSM future state VSM
  • 7.
    Value Steam MappingSteps Next Future State 7 Current State Future State Original State
  • 8.
    Apply Five SimplePrinciples • Specify value from the standpoint of end customer • Identify the value stream for each product family • Make the product flow 8 • Make the product flow • So the customer can pull • As you manage toward perfection Perfection PULL FLOW VALUE STREAM VALUE
  • 9.
    What is theValue that Flows? Specify value from the standpoint of the end customer Ask how your current products and processes disappoint your customer’s value expectation: 9 disappoint your customer’s value expectation: • price? • quality? • reliable delivery? • rapid response to changing needs? • ???
  • 10.
    "ITEMS" flow througha value stream – In manufacturing, materials are the items – In design & development, designs are the items – In service, external customer needs are the items What Flows? 10 – In service, external customer needs are the items – In admin., internal customer needs are the items Analysis begins with part of a total value stream, That part of the value stream has customers too
  • 11.
    Value Stream MappingProcess Symbols Customer/Supplier Icon: represents the Supplier when in the upper left, customer when in the upper right, the usual end point for material Dedicated Process flow Icon: a process, operation, machine or department, through which material flows. It represents one department with a continuous, internal fixed flow. Shared Process Icon: a process, operation, department or 11 Shared Process Icon: a process, operation, department or workcenter that other value stream families share. Data Box Icon: it goes under other icons that have significant information/data required for analyzing and observing the system. Workcell Icon: indicates that multiple processes are integrated in a manufacturing workcell.
  • 12.
    Value Stream MappingMaterial Symbols Inventory Icons: show inventory between two processes Shipments Icon: represents movement of raw materials from suppliers to the Receiving dock/s of the factory. Or, the movement of finished goods from the Shipping dock/s of the factory to the customers 12 Push Arrow Icon: represents the “pushing” of material from one process to the next process. Supermarket Icon: an inventory “supermarket” (kanban stockpoint). Material Pull Icon: supermarkets connect to downstream processes with this "Pull" icon that indicates physical removal.
  • 13.
    Value Stream MappingMaterial Symbols (Cont.) FIFO Lane Icon: First-In-First-Out inventory. Use this icon when processes are connected with a FIFO system that limits input. Safety Stock Icon: represents an inventory “hedge” (or safety stock) against problems such as downtime, to protect the system against sudden fluctuations in customer orders or system failures. 13 sudden fluctuations in customer orders or system failures. External Shipment Icon: shipments from suppliers or to customers using external transport
  • 14.
    Value Stream Mapping InformationSymbols Production Control Icon: This box represents a central production scheduling or control department, person or operation. Manual Info Icon : A straight, thin arrow shows general flow of information from memos, reports, or conversation. Frequency and other notes may be relevant. Electronic Info Icon : This wiggle arrow represents electronic flow 14 Electronic Info Icon : This wiggle arrow represents electronic flow such as electronic data interchange (EDI), the Internet, Intranets, LANs (local area network), WANs (wide area network). You may indicate the frequency of information/data interchange, the type of media used ex. fax, phone, etc. and the type of data exchanged. Production Kanban Icon : This icon triggers production of a pre- defined number of parts. It signals a supplying process to provide parts to a downstream process. Withdrawal Kanban Icon : This icon represents a card or device that instructs a material handler to transfer parts from a supermarket to the receiving process. The material handler (or operator) goes to the supermarket and withdraws the necessary items.
  • 15.
    Value Stream Mapping InformationSymbols (Cont.) Signal Kanban Icon : used whenever the on-hand inventory levels in the supermarket between two processes drops to a trigger or minimum point. It is also referred as “one-per-batch” kanban. Kanban Post Icon : a location where kanban signals reside for pickup. Often used with two-card systems to exchange withdrawal and production kanban. Sequenced Pull Icon: represents a pull system that gives instruction 15 Sequenced Pull Icon: represents a pull system that gives instruction to subassembly processes to produce a predetermined type and quantity of product, typically one unit, without using a supermarket. Load Leveling Icon : a tool to batch kanbans in order to level the production volume and mix over a period of time. MRP/ERP Icon : scheduling using MRP/ERP or other centralized systems.
  • 16.
    Value Stream Mapping InformationSymbols (Cont.) Go See Icon : gathering of information through visual means. Verbal Information Icon: represents verbal or personal information flow. 16
  • 17.
    Value Stream Mapping GeneralSymbols Kaizen Burst Icon: used to highlight improvement needs and plan kaizen workshops at specific processes that are critical to achieving the Future State Map of the value stream. Operator Icon : represents an operator. It shows the number of operators required to process the VSM family at a particular workstation. Other Icon : other useful or potentially useful information. 17 Other Icon : other useful or potentially useful information. Timeline Icon : shows value added times (Cycle Times) and non- value added (wait) times. Use this to calculate Lead Time and Total Cycle Time.
  • 18.
    TAKT TIME Effective WorkingTime per Shift Customer Requirement per Shift Takt Time = 18 Customer Requirement per Shift Synchronizes pace, evenly applying customer demand across the work day. Takt Time is "Beat Time"? "Rate Time" or “Heart Beat" Lean Production uses Takt Time as the rate or time that a completed product is finished. If you have a Takt Time of two minutes that means every two minutes a complete product, assembly or machine is produced off the line. (http://www.isixsigma.com/dictionary/Takt_Time-455.htm)
  • 19.
    Current State -Manufacturing 19
  • 20.
    Ideal State -Manufacturing Production Control ASSEMBLY COMPANY Production Control MACHINE COMPANY SUPPLIER 20 Ship CUSTOMER MFG Stock Same Site
  • 21.
    Future State -Manufacturing 21
  • 22.
    Ideal State -Non-Manufacturing Customer Common Format 22 Eng/SCL/Tech Software Specific Cell
  • 23.
    Future State -Non-Manufacturing Customer Common Format Customer 23 Engineering CFG MGT/SCL Cell Tech Pubs C/T = 45 sec. C/O = 30 min. 3 Shifts 2% Scrap C/T = 45 sec. C/O = 30 min. 3 Shifts 2% Scrap C/T = 45 sec. C/O = 30 min. 3 Shifts 2% Scrap
  • 24.
    Step by StepGuide: An Example • John Smith works for ABC Company in charge of production. ABC company makes widgets and supply these through several retail outlets. Recently problems have emerged. – a shortage in supply to the retail outlets – Has high levels and value of inventory in the organization currently 24 currently – a complaint letter to the company from a customer stating that as a frequent consumer of the products, he’s dissatisfied at the quality of the product and that he often returns faulty widgets to the retail outlets • John’s unsure how to answer to these questions but he intends to get to the bottom of it and if possible improve the situation.
  • 25.
    Step by StepGuide: An Example • Step 1 - Select your sponsor and set expectations – appoint someone who is responsible to make decisions, arbitrate solutions, and plan the 25 decisions, arbitrate solutions, and plan the project. – The sponsor usually selects the processes that will be mapped and will usually have a firm grasp of what achievement is being targeted.
  • 26.
    Step by StepGuide: An Example • Step 2 - Select your team – You should ensure that each area or stakeholder of the process is represented e.g. Sales, Purchasing, Warehouse etc. 26 Sales, Purchasing, Warehouse etc.
  • 27.
    Step by StepGuide: An Example • Step 3 -Select process to be mapped – Value Stream Mapping is suitable for most businesses and can be used in Manufacturing, Logistics, Supply Chain and 27 Manufacturing, Logistics, Supply Chain and some Service orientated Organizations.
  • 28.
    Step by StepGuide: An Example • Step 4 - Collect data and produce current state map – process times, inventory or materials information, customer (or demand) 28 information, customer (or demand) requirements. – the future state maps will be developed using information captured here so it’s imperative you have a correct understanding of the business.
  • 29.
    Step by StepGuide: An Example • Step 5 - Critique Current state – challenge the current thinking, encourage your team to make suggestions, look for areas of waste. 29 areas of waste.
  • 30.
    Step by StepGuide: An Example • Step 6 - Map Future State – compile a future state map based on the current state map and the critiques 30
  • 31.
    Step by StepGuide: An Example • Step 7 - Create Action Plan and deploy – taking the Future State map consider an action plan that could be implemented to change the current process to the future state. 31 change the current process to the future state.
  • 32.
    Step by StepGuide: An Example • Step 8 - Measure benefits – check to ensure that the benefits expected have been obtained – review each change made and analyze benefits 32 made and analyze benefits
  • 33.
    Some Mapping Tips(1) • Always collect current-state information while walking the actual pathways of material and information flows yourself • Begin with a quick walk along the entire 33 • Begin with a quick walk along the entire door-to-door value stream • Begin at the shipping end and work upstream From Rother and Shook (2009)
  • 34.
    Some Mapping Tips(2) • Bring your stopwatch and do not rely on standard times or information that you do not personally obtain • Map the whole value stream yourself 34 • Map the whole value stream yourself • Always draw by hand in pencil From Rother and Shook (2009)
  • 35.
    References • New LeanToolbox : Towards Fast Flexible Flow (2004), Bicheno, John, Picsie Books. • Learning to See (2009), Rother, Mike and Shook, John, Lean Enterprise Institute. • http://www.valuebasedmanagement.net/method 35 • http://www.valuebasedmanagement.net/method s_value_stream_mapping.html. • http://www.bizbodz.com/Business- Improvement/Lean/Value-Stream-Mapping-How- to-Guide-Part-1.asp. • http://www.strategosinc.com/value-stream- mapping-3.htm. • http://www.engineering.uiowa.edu/~cam/Docum ents/ValueStreamMapping.ppt.