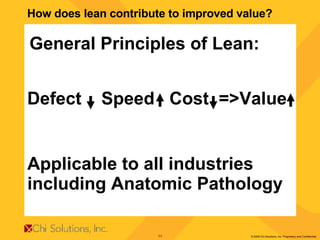
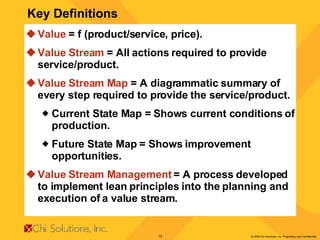
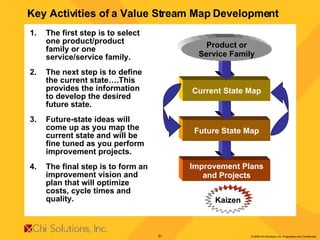
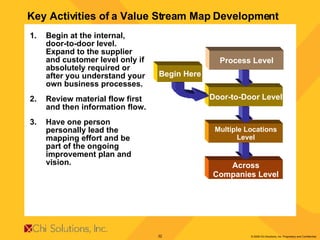
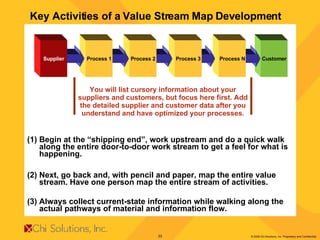
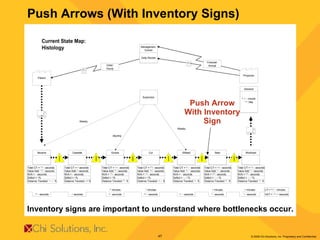
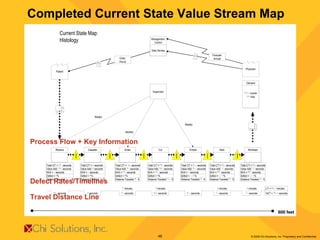
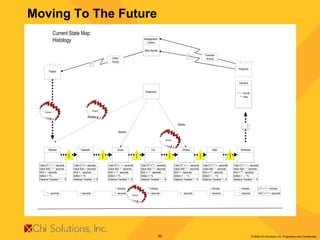
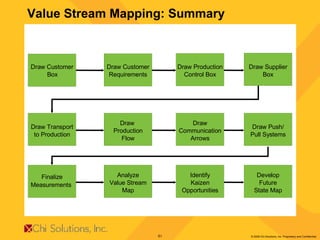
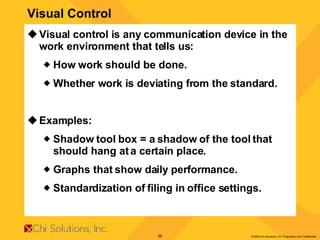
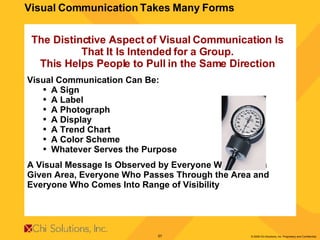
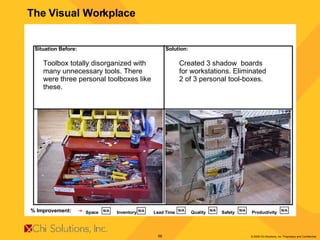
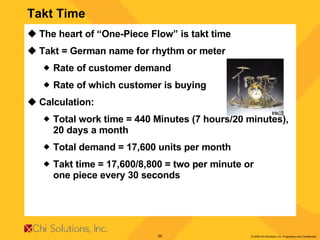
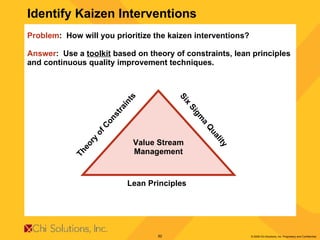
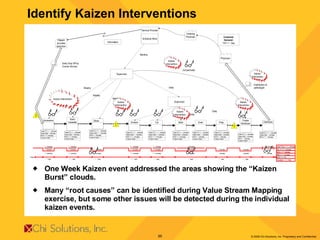
Laboratory Outreach 2008  Value Stream Mapping (Anatomic Pathology) Hans Froehling, DBA/CMBB June 2008
Part A:  The Value Stream Map How to Create a Value Stream Map
Key message No. 1 “ We know what needs to be done to reduce defects in anatomic pathology, the challenge is to implement the principles that lead us to zero defect rates”  Adapted from Dr. Barnes, professor of strategy, Nova Southeastern University
Key messages No. 2 “ The hardest part of leaning out a process  is living through change” Adapted from Michael Hammer “Reengineering the Corporation”
Key Message No. 3 “ Create constancy of purpose toward improvement of product and service, with the aim to become competitive and to stay in business and to provide jobs”. W. Edwards Deming, First point of his “14 Points for Management”.
Key Objectives Demonstrate why lean principles developed in the automotive industry can be successfully used to reduce defects and increase value of anatomic pathology services. Give an understanding of how value stream management allows for the implementation of lean principles. Demonstrate how a value stream map can be used to identify opportunities for defect reduction in Anatomic Pathology. Describe the key lean tools to develop a lean value stream map that reduces the defect rate of Anatomic Pathology. Demonstrate via a case study how lean principles can be successfully applied to anatomic pathology.
Objectives of Lean Reduced Defects = Improved Quality Reduced Lead Time = Improved Turnaround Time (TAT) Reduced Costs = Increased profitability Improved value = Decreased waste Lean makes the defects “visible” through one-piece flow!
How does lean contribute to defect reduction? Batch Production  Inspection  Feedback with delayed Action  One Piece Flow – Immediate Feedback with Immediate Action Input Defect-free output Defective output
How does lean contribute to improved speed? Batch Production  Batch Production  Input  Output Input Defect-Free Output Defective output Constant Bottleneck First-In => Anytime Out One Piece Flow    Constant Flow First-In => First Out
How does lean contribute to reduced costs? Less Work-In-Progress Faster Turnover Faster collection of money Less need for inventory stocks (reagents etc.)
How does lean contribute to improved value? Defect  Speed  Cost  =>Value General Principles of Lean: Applicable to all industries  including Anatomic Pathology
Lean and Value Stream Management
Key Definitions Value  = f (product/service, price). Value Stream  = All actions required to provide service/product. Value Stream Map  = A diagrammatic summary of every step required to provide the service/product. Current State Map = Shows current conditions of production. Future State Map = Shows improvement opportunities. Value Stream Management  = A process developed to implement lean principles into the planning and execution of a value stream.
Value Stream “ A Value Stream is an end-to-end collection of activities that create or achieve a result for a customer of the enterprise.”
Value Stream Mapping is a tool that helps you to see and understand the flow of material and information as a “product” makes its way through their value stream. You then look for opportunities to eliminate or reduce wasted time or activities in the process. Value Stream Mapping
Value is meaningful when expressed in terms of the service which meets the client’s price at a specific time.   Specify Value
The key question of all lean processes is: Does the process  add value  to the delivery of the product or service? Value-added defined: Does this process step meet a customer need? Does it change the product/service? Is it rework? Value Defined
Specify  value  from the standpoint of the end customer. Identify the  value stream  for each product family. Make the products  flow . Produce when the customer  pulls  from your operations. Manage towards  perfection. Value Defined  (cont.)
Helps you visualize the process on multiple levels. You can see the flow and sources of waste. Provides a common language for analyzing processes. Provides a blueprint for creating flow and implementing lean  concepts and techniques  throughout the entire  process stream. Benefits of Value Stream Mapping
If a task does not add value lean considers it as “waste” (muda). Seven Sources of “Waste” Defects (Rework) Overproduction Wait Time Unnecessary Movement Excess Inventory Work-in-Progress Unnecessary Movement Waste (Muda) - The Opposite of Value
Actitivities which actually create value as perceived by the customer. Activities which are required, add no value but cannot be deleted yet  (type I muda). Certain Government Regulations/Policies. Facility Layout. Technology. Activities which are required by the customer, and which can be deleted right away ( type II muda ). Lean Kaizen Events. Types of Waste
A Value Stream Consists Of: The  people  who perform the tasks, their skills and knowledge The  tools and technology  that are utilized The  physical facility  and the environment Policies, procedures and processes  which govern the activities The  social system  that supports the value stream The  organization  and the culture of the enterprise The values and beliefs that dictate the  corporate culture Behaviors  that affect the way work is approached The  communication channels  and the way information is disseminated
Managerial Aspects  Style and philosophies Structure and hierarchy Communication (chartage) Values and beliefs Information Flow Operational Aspects Ensure business processes, policies and procedures are cost effective and satisfy the customers needs Information Flow Social Systems Titles, compensation and rewards, training supporting the value stream Technological Aspects Ensure technology is being utilized appropriately and leveraged to gain maximum benefit to the customer and the company Investigate These Areas
The process map depicts “How Specimens flow through the process” It does not show: Information Flow Communication Flow Managerial Systems Social Systems Social Interactions Process Map:  Material Flow
Adds key information to a generic process  map A Value Steam adds critical Information: Material Flow Information Flow Information regarding time and transportation distances Example of Completed Value Stream Map
At What Level Do You Start a Value Stream? Total Value Stream: Enterprise vs. Operation Enterprise Operational Strategy Operations Operational Tactics Enterprise/Business Unit Level Operations Level Action Our Focus in this part of the workshop is here. Action Action Action Action Action Action
Document the information flow from beginning to end. Track the work information associated with the process steps. Track the production order associated with the specimen (tissue, block etc.) through the system. Map the scheduling system and document tracking of the information and materials throughout the system. Document how the system communicates with the customers and suppliers. Mapping Information Flow GO WALK IT !!!
Go to the  Actual  place where the process is performed. Talk to the  Actual  people involved in the process and get the real facts. Observe and chart the  Actual  process. Reality is invariably different from perception; Few processes work the way we think they do. The purpose of value stream mapping is to identify waste, not to develop the perfect process map. Three Actual Rules Understand the process through facts and data! GO WALK IT!
Customer Number of Specimen Number of Cassettes Lead time (Total TAT) Cycle time (each step) Queue time (Wait time) Transportation time Travel distance Equipment requirements Special process  requirements, etc . . . Relevant Process Data More detail captured now, easier to improve later!
Basic Structure of a Value Stream Map Management Control (2) Customer (1) Supplier (3) Information Flow (8) Information Flow (8) Activities/ Measurements (4) Transportation Line (6) Summary Measures (7) Defect Rate/Timeline (5)
The first step is to select one product/product family or one service/service family. The next step is to define the current state….This provides the information to develop the desired future state. Future-state ideas will come up as you map the current state and will be fine tuned as you perform improvement projects. The final step is to form an improvement vision and plan that will optimize costs, cycle times and quality. Key Activities of a Value Stream Map Development Improvement Plans and Projects Future State Map Current State Map Product or Service Family Kaizen
Begin at the internal, door-to-door level. Expand to the supplier and customer level only if absolutely required or after you understand your own business processes.  Review material flow first and then information flow.  Have one person personally lead the mapping effort and be part of the ongoing improvement plan and vision. Key Activities of a Value Stream Map Development Across Companies Level Multiple Locations Level Door-to-Door Level Process Level Begin Here
Customer Process N Process 3 Process 2 Process 1 Supplier You will list cursory information about your suppliers and customers, but focus here first. Add the detailed supplier and customer data after you understand and have optimized your processes. (1) Begin at the “shipping end”, work upstream and do a quick walk along the entire door-to-door work stream to get a feel for what is happening. (2) Next, go back and, with pencil and paper, map the entire value stream. Have one person map the entire stream of activities. (3) Always collect current-state information while walking along the actual pathways of material and information flow.  Key Activities of a Value Stream Map Development
Key Value Stream Symbols Customer/Supplier Process/  Measurements Information Flow Inventory/ Work In Progress Specimen Flow Transportation Pick up Schedule People First-In-First-Out Work Cell Go-And-See Physician/Patient 1x Daily
Management Control Management controls the coordination between customer demand, suppliers and information and material flow. Put management control at the center of value stream map to show that this is where the control center is.  Management controls: Information flow Material scheduling Specimen flow Work scheduling Work distribution Process sequence Schedules of suppliers
Customer - Management Control - Supplier Draw the customer icon on the upper right corner. Draw the supplier icon (same type as the one that represents the customer) in the upper left corner. Draw the production control icon between and slightly above the customer and supplier icons. Note:  Always draw the customer icon first as a reminder that the purpose underlying the value stream map is to ensure customer satisfaction.
Enter Customer Requirements Next, draw a box below or above the customer icon for entering Customer requirements: Enter monthly requirements in the data box. Calculate daily requirements by dividing the monthly requirements for the total number of tests and for each major type of test by the number of days. Enter the results on the map next to the data box showing the monthly requirements. 3,600/month Days: 30 120/day TAT = 2 days
Delivery and Transportation Icons Draw a shipping icon in the bottom right corner, below the customer icon. Draw a trucking icon between the shipping and customer icons, and enter the delivery frequency (hourly) inside the truck’s trailer. Draw a truck icon in the bottom left corner below the supplier icon; enter the delivery frequency (hourly) inside the truck’s trailer. Draw the direction arrow running from the supplier icon and the lower left corner, where the testing operation will be located. Draw in a direction arrow running from the shipping icon to the customer icon.
Delivery (Specimen/Tissue)
Map The Production Process After drawing the truck icons, draw icons representing the  operations along the bottom of the sheet. Determine the number of boxes you will need ahead of time so that you have enough space for all of them, keeping in mind the following: The key operations in this case are:  receiving, grossing, cutting, embedding, staining, work loading. Remember to leave space between the operations to draw inventory work in progress (WIP) icons. Remember to draw the operations in sequence from left to right; always draw the shipping icon furthest down stream (to the right). Draw and label a box for each operation in the process. Draw information boxes for attributes and measurements below the icon for each operation.
Map the Production Process Create a box for each process step
Enter Process Attributes Examples of measures critical in the lab industry: Defect Rate Turnaround Time Total Cycle Time Value Added Time Non-Value Added Time Defect Deliveries Operators Distance Traveled Defect Rate = 1% Turnaround Time = 50 Minutes Total Cycle Time = 200 seconds Value Added Time = 20 seconds Non-Value Added Time = 180 seconds Units Produced = 16/hour Total Uptime = 88% Work-In-Progress = 5 bags Accession
Production Lead Time (PLT = TAT) The time it takes a specimen to move all the way through the process or value stream from order to report (start to finish). Cycle Time (CT) The time it takes a technician/assistant to go through all work elements before repeating them. Value-Added Time (VAT) The time of those elements that actually transform the product in a way that the customer is willing to pay for. Non-Value Added Time (NVAT) The time of those elements that to do not add value Percent Value Added Time  = Production Lead Time/Value Added Time Note: Time spent due to government regulations are called  business value added time ; counted as “value added time.”  Key Terms of Time
Additional Summary Lines TIMELINE The timeline gives important information about the distribution  of time within the process. In particular, it shows total cycle time vs. value-added time for  each process step. Shown on next page TRAVEL DISTANCE The travel distance gives important information about the  distances traveled between the various process steps.  They give indication where unnecessary movements occur. Shown on final value stream map
Process Attributes and Timeline Total Cycle  Value Added => 20 sec. / 180 sec. = 11.1%  Time Time Value added time can be calculated for Total Production Lead Time OR Each Step in the process (Cycle Time)
Communication Arrows Represents phone call Information Flow Product Flow Information Flow
Push Arrows (With Inventory Signs) Push Arrow With Inventory Sign Inventory signs are important to understand where bottlenecks occur.
Completed Current State Value Stream Map Process Flow + Key Information Defect Rates/Timelines Travel Distance Line 600 feet
Add the sign of a “Kaizen Blitz” to show “Kaizen” or  “ Lean Six Sigma” interventions that help you move from the current  to the future state Moving To The Future:  Kaizen Events
Moving To The Future
Value Stream Mapping: Summary Draw Customer Box Draw Customer Requirements Draw Production Control Box Draw Supplier Box Draw Transport to Production Draw  Production Flow Draw Communication Arrows Draw Push/ Pull Systems Finalize Measurements Analyze Value Stream Map Identify Kaizen Opportunities Develop Future State Map
Standardized Work 5S (Housekeeping)  Visual Controls Management Systems Takt-Flow - Pull Concepts/One-Piece Flow Cell Designs Total Productive Maintenance Mistake Proofing - Poka Yoke Work Balancing (most complex to use) Kaizen Blitzes Key Operational Tools To Get You Started
The first step in improving a process is to ask: Was the standard procedure for that task followed? If the worker is following the standardized work and the defects still occur, then the standards need to be modified.  Standardized Tasks “ One must standardize, and thus stabilize the process  before continuous Improvement can be made.” Imai, Kaizen
Through a  5S program  you organize a workplace and remove barriers to quality: 5S – A Key Tool for Lean Step  Japanese Literal Translation  English Step 1: Seiri Clearing Up Sorting Step 2: Seiton Organizing Straightening Step 3: Seiso Cleaning Shining Step 4: Seketsu Standardizing Standardizing Step 5: Shitsuke Training & Discipline Sustaining
5S Rules for Sorting Dispose Useless Sorting Keep & Monitor Unknown Useless Item Keep & Store Useful Useful ABC Storage
Visual control is any communication device in the work environment that tells us: How work should be done. Whether work is deviating from the standard. Examples: Shadow tool box = a shadow of the tool that should hang at a certain place. Graphs that show daily performance. Standardization of filing in office settings. Visual Control
Visual Communication Takes Many Forms The Distinctive Aspect of Visual Communication Is That It Is Intended for a Group. This Helps People to Pull in the Same Direction Visual Communication Can Be: A Sign A Label A Photograph A Display A Trend Chart A Color Scheme Whatever Serves the Purpose A Visual Message Is Observed by Everyone Working in a Given Area, Everyone Who Passes Through the Area and Everyone Who Comes Into Range of Visibility
Situation Before: Solution: % Improvement: Space  Inventory  Lead Time  Quality  Safety  Productivity N/A Toolbox totally disorganized with many unnecessary tools. There were three personal toolboxes like these. Created 3 shadow  boards for workstations. Eliminated 2 of 3 personal tool-boxes. N/A N/A N/A N/A N/A The Visual Workplace
Takt Time The heart of “One-Piece Flow” is takt time Takt = German name for rhythm or meter Rate of customer demand Rate of which customer is buying Calculation: Total work time = 440 Minutes (7 hours/20 minutes),  20 days a month Total demand = 17,600 units per month Takt time = 17,600/8,800 = two per minute or  one piece every 30 seconds
The optimally lean process is characterized by “One-Piece Flow” No Work-In-Progress inventory costs No quality defect Shortest Cycle Time No Waste One-Piece Flow/Pull system
Pull System (mass customization): Reduce cost of inventories by producing the product when the customer needs it. Ideal:  Build product or deliver service exactly when the customer orders it. Push System (mass production) Distribute product to the customer when the company is ready for it. Ideal: “I wish they would make a meeting planner that would plan a meeting when I am ready   .”  Push vs. Pull System
Builds in Quality Creates Real Flexibility Creates Higher Productivity Frees up Floor Space Improves Safety Improves Morale Reduces Cost of WIP Inventory Benefits of One-Piece Flow/Pull System
Process C is a bottleneck: “ A bottleneck is one process in a chain of processes, such that its limited capacity reduces the capacity of the whole chain” The maximum the chain of processes can process in one hour is 18 units! Most if not all lean projects attempt to identify and overcome the process bottleneck(s). Bottleneck Process A 20 Units Process B 80 Units Process C 18 Units
Cell Design Options Pod Pattern Characteristics: Ideal for craft work Low throughput Low variety Tough changeover High takt Pod Design
Cell Design Options “ L”  Shaped Line Flow Pattern Characteristics:   Well suited to assembly operations with Point of Use storage inside L. Easier expansion of critical, high fixed assets space if located in the turn area. Allows fitting lengthy series of operations into limited space. Lets feeding line start on aisle and end at point of use. “ L” Shaped Line Design
Cell Design Options “ U” Shaped Line Flow Pattern Characteristics: One operator can see and attend all machines with minimum of walking. They are flexible in the number of operators they can accommodate (capable of responding to changing production levels). Single operator can monitor work entering and leaving a cell to ensure that it remains constant (JIT flow). Operators can conveniently cooperate to smooth out unbalanced operations and address other problems as they surface. “ U” Shaped Line Design
Cell Design Options Combination Line Flow Pattern Characteristics: Lands itself to two-way flow and to easy access at multiple points. Branches can be segregated by function or special requirements. Well suited to sequences of operations that change or vary from job to job or part to part. Permits multiple routings with automated integration of process, handling, and controls. Combination Line Design
Cell Design General Rules 1 or 2 operator assembly Straight Line 3 to 8 assembly stations L or U Shape Line More than 8 Serpentine, U or  Multiple U
Cell Design Wrap-Up This is not an easy process Let the process drive the shape and direction Cover all bases Evaluate alternatives Perform simulations Get the buy-in of the project area team Get the buy-in of the management
The main function of a withdrawal Kanban is to pass the authorization for the movement of parts from one stage to another.  Once it gets the parts from the preceding process and moves them to the next process, remaining with the parts until the last part has been consumed by the next process.  The withdrawal Kanban then travels back to the preceding process to get parts thus creating the cycle.  Withdrawal Kanban
The primary function of the production Kanban is to release an order to the preceding stage to build the lot size indicated on the card.  The production Kanban card should have the following information:  Materials required as inputs at the preceding stage  Parts required as inputs at the preceding stage  Information stated on withdrawals Kanban  The first two pieces of information are not required on the withdrawal Kanban as it’s only used for communicating the authorization of movement of parts between work stations.   Production Kanban
The goal is to get to Scheduled Maintenance Breakdown Maintenance Maintenance Prevention Corrective Maintenance Reactive Scheduled Maintenance Total Productive Maintenance (TPM) Proactive
Poka Yoke – Dual Focus Defects Mistakes Process Prevention Poka-Yoke that focuses here works on mistake prevention or making mistakes impossible. Detection Poka-Yoke that focuses here works on mistake detection, or making sure mistakes do not turn into defects. People and systems do make mistakes. A portion of mistakes turn into defects.
There Are 2 States of a Defect: Error About to Occur Defect About to Occur (Prediction) Warning Signal Control/Feedback Shutdown (Stop Operation ) Error Has Occurred Defect Has Occurred (Detection) Warning Signal Control/Feedback Shutdown } MISTAKE-PROOF FUNCTION Mistake Proofing – Poka Yoke
1 6 5 4 3 2 7 8 Mistake Proofing – Examples
Part B: Case Study: Apply Value Stream Mapping to reduce errors and improve TAT in commercial Anatomic Pathology Lab.
Next Section:  Case Study DEFINE: Define the Project Goal IMPROVE: Implement Solutions & Evaluate Results A B C D ANALYZE: Analyze to Identify Causes CONTROL: Standardize & Make Future Plans MEASURE: Measure the Current Situation =1.0 =3.0 IMPROVE: Implement Solutions & Evaluate Results CONTROL: Standardize & Make Future Plans
Background A commercial service provider of anatomic pathology services is facing increased turnaround times for reporting to client physicians The commercial service provider would like to know where and how to best improve the existing process The site director, medical director and director of the anatomic pathology subdivision sponsor a value-stream map exercise to identify opportunities for TAT improvements Develop Value Stream Map Identify Kaizen Opportunities Create Future State Map  Implement kaizen opportunities
Project Charter - Kaizen Week Business Case: Opportunity Statement: Physicians complain that TAT for commercial anatomic pathology reports takes too long and is unpredictable.  This results in lost goodwill. Improve work flow; Reduce Defect. Defect Definition:  A “workload” that is not in the hands of the pathologist within one business day. Goal Statement: Project Scope: Reduce TAT from 2 days to 1 day. Process Start Point:  Specimen is delivered by transportation to accessioning in the accessioning room. Process End Point:  Workload is handed off to transportation (off-site) or handed to pathologist for review (on-site).
Generic Process Map and Project Scope High Level Work Flow Project Scope:  From accession to distribution of tissue stains to pathologists.
Process Performance - Example Before The process is in control, but has high variability.  Be aware that a process can actually become more erratic if it is not in control before you start the Kaizen events Note:  Example data
Key Information Defect Rate TAT  for total process Cycle Time  for each key process (CT = TAT   for process step). Value Added Time  for each key process (VAT). Non-Value Added Time  for each key process (NVAT). Transportation/Walking Distance. Work-In-Progress  (Work not yet performed). Data generated through observations and validated by time stamps generated by IT system.  All shifts included. Duration of data gathering:  two weeks.
Current State Map Value Stream Map represents the current flow of tissue specimens and information through the process.
Summary Data - Time related data Total Turnaround Time = 21 hours (1,260 Minutes) Value Added Time = 6 hours (364 minutes including oven) Percent Value Added Time = 28.9% Traveled Distance = 1,542 feet TAT = 1260 minutes (= 21 hours) Value Added Time = 364 minutes (= 6 hours) Non Value Added = 896 minutes (= 15 hours) Work In Progress = 960 minutes (= 16 hours) Percent Value Added Time = 28.9% Traveled Distance = 1542 feet Defect Rate = < 1%
Summary Data - Work Balancing Graph  Work Balancing Graph shows the biggest bottlenecks and depicts value added vs. non-value added times Longest non-value added times:  Distribution Embedding Accessioning Build Cassette  Constraint Constraint
Lost in “Spaghetti World” (Womack) Carrier Drop Off Accession    Label Print Label Print    Gross Gross    Cover slip Oven    Distribution to pathologists Start End
Embed (30 per hour) Cut (60 per hour) Embed Classical Work Set up   - Linear   Lean Set Up - Cell Design Summary Data - Work Flow Design 60 units 30  units Cut 30  units Cut E M B E D E M B E D Work Cell (U shaped)
Summary of Key Issues Accessioning   Schedule of workers not synchronized with schedule of drop offs. Drop off starts at 5:00 p.m., but real accessioning doesn’t start before 8:00 a.m. No supervision in the accessioning area (7:00 p.m. - 3:00 a.m. shift). No procedure for hand-off to cassette building. Cassette Building Printer for labels in room different from computer that generates the labels. Long wait times for tissue specimens due to delays in accessioning. Unpredictable inputs.
Summary of Key Issues  (cont.) Grossing Grossing in different room from Cassette Building. No synchronized flow from accession    cassette building    grossing. Oven technology old/no productive maintenance schedule/frequent break downs. Preference for large batch sizes rather than scheduled shorter runs of smaller batch sizes. No “First-In-First-Out!
Summary of Key Issues  (cont.)   Embed/Cut/Mount/Stain/Cover Slip Schedule of workers not synchronized with schedule of grossing (both 1st and 2nd shift). First batch of tissues comes out of oven at 4:00 p.m., but shift starts at 7:00 a.m.; real work does not start before 7:30 a.m. due to set up time    long wait time. No cell design for embed/cut/mount/stain. Little supervision from existing supervisors (technical rather than managerial expertise; time breaks are not synchronized with flow of inputs from grossing).
Summary of Key Issues  (cont.)   Distribution to Physician Distribution assistant works in a room that is different from Embed/Cut/Stain. Reporting structure of assistant not clear. No full coverage of two shifts (1 FTE for two shifts). Physician offices in different locations. Physicians release reports in batches.  Other No timely reporting (one week after the fact). Employee morale is low. Communication issues about re-stains between pathologists and Histotechs when pathologists are in a different building.
Identify Kaizen Interventions Problem :  How will you prioritize the kaizen interventions? Answer :  Use a  toolkit  based on theory of constraints, lean principles and continuous quality improvement techniques. Value Stream Management Lean Principles Six Sigma Quality Theory of Constraints
Identify and Use The Right Tool  Analysis and Diagnostics – Identify Improvement Opportunities Improvement – Taking Action and Achieving Results Sustaining – Build upon  Improvements and make  it a new way of life. If You Only Have A Hammer…. Everything Will Look Like A Nail
The process is capable of meeting your clients’ specifications (six sigma). The report is available when needed. The process has the right levels of capacity. Only Perform Value Added Steps (Remove Waste) Create Flow Where Possible (Cell Design) Create Pull (Let your customer pull production) Continuously improve your process (Manage towards Perfection) Goals That Help You Identify The Right Tools
Identify Kaizen Interventions One Week Kaizen event addressed the areas showing the “Kaizen Burst” clouds. Many “root causes” can be identified during Value Stream Mapping exercise, but some other issues will be detected during the individual kaizen events.
Summary of Key Interventions Instituted First-In-First-Out ( FIFO - continuous flow ). More frequent  runs of oven at set intervals ( one-piece flow/small batches ). Moved distribution into histology room ( remove unnecessary transportation ). Conducted 5S exercise in preparation of work cells ( continuous flow). Created window to enable hand off between accession and grossing ( remove unnecessary transportation ). Created work cell for embed/cut/mount/stain/cover slip ( one-piece flow/small batches, worker flexibility, reduce unnecessary movements ). Large tissues not processed in cell ( work balance ).
Summary of Key Interventions  (cont.) Created daily reporting for each function ( visual workplace ). Created daily reporting at noon to determine what percentage of specimens has not been distributed ( standardized work ). Synchronized schedules for all functions ( one-piece flow/small batches ). Clarified roles and responsibilities for all functions ( standardized work ). Synchronized schedules of delivery to off-site facility with flow of specimens ( one-piece flow/small batches ). Created schedule whereby physician releases one report at a time ( one-piece flow) Created “hot line” for physicians to call in with requests.
Summary of Lean Tools Standard Work Visual Workplace Teamwork Make defects visible 5S Work Cell Worker Flexibility Work Schedule Focused Operation (Factory)
Key Outcomes Reduced risk of data entry errors in accessioning. Reduced TAT to 1 day at on-site, 2 days at off site. Improved employee morale. Created employee suggestion program to continuously improve the process.
Future State Map The process was simplified by creating a work cell design  for embed/cut/stain/mount/process/prepare for delivery. Work Cell
Process of Conducting Kaizen Events Developing Future State Map and conducting kaizen events can  Become an interactive process.
Kaizen Newspaper Make sure to conduct follow up meetings (weekly) to ensure the changes become implemented!
Challenges of Sustainability Histo techs reluctant to change schedules. Histo techs reluctant to work in work cells (individual work pace vs. team work). Work cells only work when all three histo techs are present (be aware of sick time, vacation time). Measurement system requires systematic update and distribution of report at 7:00 a.m. and noon. Clarification of roles and responsibilities requires culture change. New flow impacts work schedules of pathologists.    The bottleneck moves!     Continuously manage the value stream and avoid  inertia!
Summary:  Lean vs. Traditional Thinking Traditional Thinking: Large batches Low unit costs Work at full capacity Tight Schedules High WIP Inventories High level of Specialization Long Cycle Times Lean Thinking: Small batches N/A Work at necessary capacity Flexible Schedules Low WIP Inventories Cross-training Short Cycle   Times
Value Stream Management:  A Win-Win

Value Stream Mapping in Anatomic Pathology

  • 1.
    Laboratory Outreach 2008 Value Stream Mapping (Anatomic Pathology) Hans Froehling, DBA/CMBB June 2008
  • 2.
    Part A: The Value Stream Map How to Create a Value Stream Map
  • 3.
    Key message No.1 “ We know what needs to be done to reduce defects in anatomic pathology, the challenge is to implement the principles that lead us to zero defect rates” Adapted from Dr. Barnes, professor of strategy, Nova Southeastern University
  • 4.
    Key messages No.2 “ The hardest part of leaning out a process is living through change” Adapted from Michael Hammer “Reengineering the Corporation”
  • 5.
    Key Message No.3 “ Create constancy of purpose toward improvement of product and service, with the aim to become competitive and to stay in business and to provide jobs”. W. Edwards Deming, First point of his “14 Points for Management”.
  • 6.
    Key Objectives Demonstratewhy lean principles developed in the automotive industry can be successfully used to reduce defects and increase value of anatomic pathology services. Give an understanding of how value stream management allows for the implementation of lean principles. Demonstrate how a value stream map can be used to identify opportunities for defect reduction in Anatomic Pathology. Describe the key lean tools to develop a lean value stream map that reduces the defect rate of Anatomic Pathology. Demonstrate via a case study how lean principles can be successfully applied to anatomic pathology.
  • 7.
    Objectives of LeanReduced Defects = Improved Quality Reduced Lead Time = Improved Turnaround Time (TAT) Reduced Costs = Increased profitability Improved value = Decreased waste Lean makes the defects “visible” through one-piece flow!
  • 8.
    How does leancontribute to defect reduction? Batch Production Inspection Feedback with delayed Action One Piece Flow – Immediate Feedback with Immediate Action Input Defect-free output Defective output
  • 9.
    How does leancontribute to improved speed? Batch Production Batch Production Input Output Input Defect-Free Output Defective output Constant Bottleneck First-In => Anytime Out One Piece Flow Constant Flow First-In => First Out
  • 10.
    How does leancontribute to reduced costs? Less Work-In-Progress Faster Turnover Faster collection of money Less need for inventory stocks (reagents etc.)
  • 11.
    How does leancontribute to improved value? Defect Speed Cost =>Value General Principles of Lean: Applicable to all industries including Anatomic Pathology
  • 12.
    Lean and ValueStream Management
  • 13.
    Key Definitions Value = f (product/service, price). Value Stream = All actions required to provide service/product. Value Stream Map = A diagrammatic summary of every step required to provide the service/product. Current State Map = Shows current conditions of production. Future State Map = Shows improvement opportunities. Value Stream Management = A process developed to implement lean principles into the planning and execution of a value stream.
  • 14.
    Value Stream “A Value Stream is an end-to-end collection of activities that create or achieve a result for a customer of the enterprise.”
  • 15.
    Value Stream Mappingis a tool that helps you to see and understand the flow of material and information as a “product” makes its way through their value stream. You then look for opportunities to eliminate or reduce wasted time or activities in the process. Value Stream Mapping
  • 16.
    Value is meaningfulwhen expressed in terms of the service which meets the client’s price at a specific time. Specify Value
  • 17.
    The key questionof all lean processes is: Does the process add value to the delivery of the product or service? Value-added defined: Does this process step meet a customer need? Does it change the product/service? Is it rework? Value Defined
  • 18.
    Specify value from the standpoint of the end customer. Identify the value stream for each product family. Make the products flow . Produce when the customer pulls from your operations. Manage towards perfection. Value Defined (cont.)
  • 19.
    Helps you visualizethe process on multiple levels. You can see the flow and sources of waste. Provides a common language for analyzing processes. Provides a blueprint for creating flow and implementing lean concepts and techniques throughout the entire process stream. Benefits of Value Stream Mapping
  • 20.
    If a taskdoes not add value lean considers it as “waste” (muda). Seven Sources of “Waste” Defects (Rework) Overproduction Wait Time Unnecessary Movement Excess Inventory Work-in-Progress Unnecessary Movement Waste (Muda) - The Opposite of Value
  • 21.
    Actitivities which actuallycreate value as perceived by the customer. Activities which are required, add no value but cannot be deleted yet (type I muda). Certain Government Regulations/Policies. Facility Layout. Technology. Activities which are required by the customer, and which can be deleted right away ( type II muda ). Lean Kaizen Events. Types of Waste
  • 22.
    A Value StreamConsists Of: The people who perform the tasks, their skills and knowledge The tools and technology that are utilized The physical facility and the environment Policies, procedures and processes which govern the activities The social system that supports the value stream The organization and the culture of the enterprise The values and beliefs that dictate the corporate culture Behaviors that affect the way work is approached The communication channels and the way information is disseminated
  • 23.
    Managerial Aspects Style and philosophies Structure and hierarchy Communication (chartage) Values and beliefs Information Flow Operational Aspects Ensure business processes, policies and procedures are cost effective and satisfy the customers needs Information Flow Social Systems Titles, compensation and rewards, training supporting the value stream Technological Aspects Ensure technology is being utilized appropriately and leveraged to gain maximum benefit to the customer and the company Investigate These Areas
  • 24.
    The process mapdepicts “How Specimens flow through the process” It does not show: Information Flow Communication Flow Managerial Systems Social Systems Social Interactions Process Map: Material Flow
  • 25.
    Adds key informationto a generic process map A Value Steam adds critical Information: Material Flow Information Flow Information regarding time and transportation distances Example of Completed Value Stream Map
  • 26.
    At What LevelDo You Start a Value Stream? Total Value Stream: Enterprise vs. Operation Enterprise Operational Strategy Operations Operational Tactics Enterprise/Business Unit Level Operations Level Action Our Focus in this part of the workshop is here. Action Action Action Action Action Action
  • 27.
    Document the informationflow from beginning to end. Track the work information associated with the process steps. Track the production order associated with the specimen (tissue, block etc.) through the system. Map the scheduling system and document tracking of the information and materials throughout the system. Document how the system communicates with the customers and suppliers. Mapping Information Flow GO WALK IT !!!
  • 28.
    Go to the Actual place where the process is performed. Talk to the Actual people involved in the process and get the real facts. Observe and chart the Actual process. Reality is invariably different from perception; Few processes work the way we think they do. The purpose of value stream mapping is to identify waste, not to develop the perfect process map. Three Actual Rules Understand the process through facts and data! GO WALK IT!
  • 29.
    Customer Number ofSpecimen Number of Cassettes Lead time (Total TAT) Cycle time (each step) Queue time (Wait time) Transportation time Travel distance Equipment requirements Special process requirements, etc . . . Relevant Process Data More detail captured now, easier to improve later!
  • 30.
    Basic Structure ofa Value Stream Map Management Control (2) Customer (1) Supplier (3) Information Flow (8) Information Flow (8) Activities/ Measurements (4) Transportation Line (6) Summary Measures (7) Defect Rate/Timeline (5)
  • 31.
    The first stepis to select one product/product family or one service/service family. The next step is to define the current state….This provides the information to develop the desired future state. Future-state ideas will come up as you map the current state and will be fine tuned as you perform improvement projects. The final step is to form an improvement vision and plan that will optimize costs, cycle times and quality. Key Activities of a Value Stream Map Development Improvement Plans and Projects Future State Map Current State Map Product or Service Family Kaizen
  • 32.
    Begin at theinternal, door-to-door level. Expand to the supplier and customer level only if absolutely required or after you understand your own business processes. Review material flow first and then information flow. Have one person personally lead the mapping effort and be part of the ongoing improvement plan and vision. Key Activities of a Value Stream Map Development Across Companies Level Multiple Locations Level Door-to-Door Level Process Level Begin Here
  • 33.
    Customer Process NProcess 3 Process 2 Process 1 Supplier You will list cursory information about your suppliers and customers, but focus here first. Add the detailed supplier and customer data after you understand and have optimized your processes. (1) Begin at the “shipping end”, work upstream and do a quick walk along the entire door-to-door work stream to get a feel for what is happening. (2) Next, go back and, with pencil and paper, map the entire value stream. Have one person map the entire stream of activities. (3) Always collect current-state information while walking along the actual pathways of material and information flow. Key Activities of a Value Stream Map Development
  • 34.
    Key Value StreamSymbols Customer/Supplier Process/ Measurements Information Flow Inventory/ Work In Progress Specimen Flow Transportation Pick up Schedule People First-In-First-Out Work Cell Go-And-See Physician/Patient 1x Daily
  • 35.
    Management Control Managementcontrols the coordination between customer demand, suppliers and information and material flow. Put management control at the center of value stream map to show that this is where the control center is. Management controls: Information flow Material scheduling Specimen flow Work scheduling Work distribution Process sequence Schedules of suppliers
  • 36.
    Customer - ManagementControl - Supplier Draw the customer icon on the upper right corner. Draw the supplier icon (same type as the one that represents the customer) in the upper left corner. Draw the production control icon between and slightly above the customer and supplier icons. Note: Always draw the customer icon first as a reminder that the purpose underlying the value stream map is to ensure customer satisfaction.
  • 37.
    Enter Customer RequirementsNext, draw a box below or above the customer icon for entering Customer requirements: Enter monthly requirements in the data box. Calculate daily requirements by dividing the monthly requirements for the total number of tests and for each major type of test by the number of days. Enter the results on the map next to the data box showing the monthly requirements. 3,600/month Days: 30 120/day TAT = 2 days
  • 38.
    Delivery and TransportationIcons Draw a shipping icon in the bottom right corner, below the customer icon. Draw a trucking icon between the shipping and customer icons, and enter the delivery frequency (hourly) inside the truck’s trailer. Draw a truck icon in the bottom left corner below the supplier icon; enter the delivery frequency (hourly) inside the truck’s trailer. Draw the direction arrow running from the supplier icon and the lower left corner, where the testing operation will be located. Draw in a direction arrow running from the shipping icon to the customer icon.
  • 39.
  • 40.
    Map The ProductionProcess After drawing the truck icons, draw icons representing the operations along the bottom of the sheet. Determine the number of boxes you will need ahead of time so that you have enough space for all of them, keeping in mind the following: The key operations in this case are: receiving, grossing, cutting, embedding, staining, work loading. Remember to leave space between the operations to draw inventory work in progress (WIP) icons. Remember to draw the operations in sequence from left to right; always draw the shipping icon furthest down stream (to the right). Draw and label a box for each operation in the process. Draw information boxes for attributes and measurements below the icon for each operation.
  • 41.
    Map the ProductionProcess Create a box for each process step
  • 42.
    Enter Process AttributesExamples of measures critical in the lab industry: Defect Rate Turnaround Time Total Cycle Time Value Added Time Non-Value Added Time Defect Deliveries Operators Distance Traveled Defect Rate = 1% Turnaround Time = 50 Minutes Total Cycle Time = 200 seconds Value Added Time = 20 seconds Non-Value Added Time = 180 seconds Units Produced = 16/hour Total Uptime = 88% Work-In-Progress = 5 bags Accession
  • 43.
    Production Lead Time(PLT = TAT) The time it takes a specimen to move all the way through the process or value stream from order to report (start to finish). Cycle Time (CT) The time it takes a technician/assistant to go through all work elements before repeating them. Value-Added Time (VAT) The time of those elements that actually transform the product in a way that the customer is willing to pay for. Non-Value Added Time (NVAT) The time of those elements that to do not add value Percent Value Added Time = Production Lead Time/Value Added Time Note: Time spent due to government regulations are called business value added time ; counted as “value added time.” Key Terms of Time
  • 44.
    Additional Summary LinesTIMELINE The timeline gives important information about the distribution of time within the process. In particular, it shows total cycle time vs. value-added time for each process step. Shown on next page TRAVEL DISTANCE The travel distance gives important information about the distances traveled between the various process steps. They give indication where unnecessary movements occur. Shown on final value stream map
  • 45.
    Process Attributes andTimeline Total Cycle Value Added => 20 sec. / 180 sec. = 11.1% Time Time Value added time can be calculated for Total Production Lead Time OR Each Step in the process (Cycle Time)
  • 46.
    Communication Arrows Representsphone call Information Flow Product Flow Information Flow
  • 47.
    Push Arrows (WithInventory Signs) Push Arrow With Inventory Sign Inventory signs are important to understand where bottlenecks occur.
  • 48.
    Completed Current StateValue Stream Map Process Flow + Key Information Defect Rates/Timelines Travel Distance Line 600 feet
  • 49.
    Add the signof a “Kaizen Blitz” to show “Kaizen” or “ Lean Six Sigma” interventions that help you move from the current to the future state Moving To The Future: Kaizen Events
  • 50.
  • 51.
    Value Stream Mapping:Summary Draw Customer Box Draw Customer Requirements Draw Production Control Box Draw Supplier Box Draw Transport to Production Draw Production Flow Draw Communication Arrows Draw Push/ Pull Systems Finalize Measurements Analyze Value Stream Map Identify Kaizen Opportunities Develop Future State Map
  • 52.
    Standardized Work 5S(Housekeeping) Visual Controls Management Systems Takt-Flow - Pull Concepts/One-Piece Flow Cell Designs Total Productive Maintenance Mistake Proofing - Poka Yoke Work Balancing (most complex to use) Kaizen Blitzes Key Operational Tools To Get You Started
  • 53.
    The first stepin improving a process is to ask: Was the standard procedure for that task followed? If the worker is following the standardized work and the defects still occur, then the standards need to be modified. Standardized Tasks “ One must standardize, and thus stabilize the process before continuous Improvement can be made.” Imai, Kaizen
  • 54.
    Through a 5S program you organize a workplace and remove barriers to quality: 5S – A Key Tool for Lean Step Japanese Literal Translation English Step 1: Seiri Clearing Up Sorting Step 2: Seiton Organizing Straightening Step 3: Seiso Cleaning Shining Step 4: Seketsu Standardizing Standardizing Step 5: Shitsuke Training & Discipline Sustaining
  • 55.
    5S Rules forSorting Dispose Useless Sorting Keep & Monitor Unknown Useless Item Keep & Store Useful Useful ABC Storage
  • 56.
    Visual control isany communication device in the work environment that tells us: How work should be done. Whether work is deviating from the standard. Examples: Shadow tool box = a shadow of the tool that should hang at a certain place. Graphs that show daily performance. Standardization of filing in office settings. Visual Control
  • 57.
    Visual Communication TakesMany Forms The Distinctive Aspect of Visual Communication Is That It Is Intended for a Group. This Helps People to Pull in the Same Direction Visual Communication Can Be: A Sign A Label A Photograph A Display A Trend Chart A Color Scheme Whatever Serves the Purpose A Visual Message Is Observed by Everyone Working in a Given Area, Everyone Who Passes Through the Area and Everyone Who Comes Into Range of Visibility
  • 58.
    Situation Before: Solution:% Improvement: Space Inventory Lead Time Quality Safety Productivity N/A Toolbox totally disorganized with many unnecessary tools. There were three personal toolboxes like these. Created 3 shadow boards for workstations. Eliminated 2 of 3 personal tool-boxes. N/A N/A N/A N/A N/A The Visual Workplace
  • 59.
    Takt Time Theheart of “One-Piece Flow” is takt time Takt = German name for rhythm or meter Rate of customer demand Rate of which customer is buying Calculation: Total work time = 440 Minutes (7 hours/20 minutes), 20 days a month Total demand = 17,600 units per month Takt time = 17,600/8,800 = two per minute or one piece every 30 seconds
  • 60.
    The optimally leanprocess is characterized by “One-Piece Flow” No Work-In-Progress inventory costs No quality defect Shortest Cycle Time No Waste One-Piece Flow/Pull system
  • 61.
    Pull System (masscustomization): Reduce cost of inventories by producing the product when the customer needs it. Ideal: Build product or deliver service exactly when the customer orders it. Push System (mass production) Distribute product to the customer when the company is ready for it. Ideal: “I wish they would make a meeting planner that would plan a meeting when I am ready  .” Push vs. Pull System
  • 62.
    Builds in QualityCreates Real Flexibility Creates Higher Productivity Frees up Floor Space Improves Safety Improves Morale Reduces Cost of WIP Inventory Benefits of One-Piece Flow/Pull System
  • 63.
    Process C isa bottleneck: “ A bottleneck is one process in a chain of processes, such that its limited capacity reduces the capacity of the whole chain” The maximum the chain of processes can process in one hour is 18 units! Most if not all lean projects attempt to identify and overcome the process bottleneck(s). Bottleneck Process A 20 Units Process B 80 Units Process C 18 Units
  • 64.
    Cell Design OptionsPod Pattern Characteristics: Ideal for craft work Low throughput Low variety Tough changeover High takt Pod Design
  • 65.
    Cell Design Options“ L” Shaped Line Flow Pattern Characteristics: Well suited to assembly operations with Point of Use storage inside L. Easier expansion of critical, high fixed assets space if located in the turn area. Allows fitting lengthy series of operations into limited space. Lets feeding line start on aisle and end at point of use. “ L” Shaped Line Design
  • 66.
    Cell Design Options“ U” Shaped Line Flow Pattern Characteristics: One operator can see and attend all machines with minimum of walking. They are flexible in the number of operators they can accommodate (capable of responding to changing production levels). Single operator can monitor work entering and leaving a cell to ensure that it remains constant (JIT flow). Operators can conveniently cooperate to smooth out unbalanced operations and address other problems as they surface. “ U” Shaped Line Design
  • 67.
    Cell Design OptionsCombination Line Flow Pattern Characteristics: Lands itself to two-way flow and to easy access at multiple points. Branches can be segregated by function or special requirements. Well suited to sequences of operations that change or vary from job to job or part to part. Permits multiple routings with automated integration of process, handling, and controls. Combination Line Design
  • 68.
    Cell Design GeneralRules 1 or 2 operator assembly Straight Line 3 to 8 assembly stations L or U Shape Line More than 8 Serpentine, U or Multiple U
  • 69.
    Cell Design Wrap-UpThis is not an easy process Let the process drive the shape and direction Cover all bases Evaluate alternatives Perform simulations Get the buy-in of the project area team Get the buy-in of the management
  • 70.
    The main functionof a withdrawal Kanban is to pass the authorization for the movement of parts from one stage to another. Once it gets the parts from the preceding process and moves them to the next process, remaining with the parts until the last part has been consumed by the next process. The withdrawal Kanban then travels back to the preceding process to get parts thus creating the cycle. Withdrawal Kanban
  • 71.
    The primary functionof the production Kanban is to release an order to the preceding stage to build the lot size indicated on the card. The production Kanban card should have the following information: Materials required as inputs at the preceding stage Parts required as inputs at the preceding stage Information stated on withdrawals Kanban The first two pieces of information are not required on the withdrawal Kanban as it’s only used for communicating the authorization of movement of parts between work stations. Production Kanban
  • 72.
    The goal isto get to Scheduled Maintenance Breakdown Maintenance Maintenance Prevention Corrective Maintenance Reactive Scheduled Maintenance Total Productive Maintenance (TPM) Proactive
  • 73.
    Poka Yoke –Dual Focus Defects Mistakes Process Prevention Poka-Yoke that focuses here works on mistake prevention or making mistakes impossible. Detection Poka-Yoke that focuses here works on mistake detection, or making sure mistakes do not turn into defects. People and systems do make mistakes. A portion of mistakes turn into defects.
  • 74.
    There Are 2States of a Defect: Error About to Occur Defect About to Occur (Prediction) Warning Signal Control/Feedback Shutdown (Stop Operation ) Error Has Occurred Defect Has Occurred (Detection) Warning Signal Control/Feedback Shutdown } MISTAKE-PROOF FUNCTION Mistake Proofing – Poka Yoke
  • 75.
    1 6 54 3 2 7 8 Mistake Proofing – Examples
  • 76.
    Part B: CaseStudy: Apply Value Stream Mapping to reduce errors and improve TAT in commercial Anatomic Pathology Lab.
  • 77.
    Next Section: Case Study DEFINE: Define the Project Goal IMPROVE: Implement Solutions & Evaluate Results A B C D ANALYZE: Analyze to Identify Causes CONTROL: Standardize & Make Future Plans MEASURE: Measure the Current Situation =1.0 =3.0 IMPROVE: Implement Solutions & Evaluate Results CONTROL: Standardize & Make Future Plans
  • 78.
    Background A commercialservice provider of anatomic pathology services is facing increased turnaround times for reporting to client physicians The commercial service provider would like to know where and how to best improve the existing process The site director, medical director and director of the anatomic pathology subdivision sponsor a value-stream map exercise to identify opportunities for TAT improvements Develop Value Stream Map Identify Kaizen Opportunities Create Future State Map Implement kaizen opportunities
  • 79.
    Project Charter -Kaizen Week Business Case: Opportunity Statement: Physicians complain that TAT for commercial anatomic pathology reports takes too long and is unpredictable. This results in lost goodwill. Improve work flow; Reduce Defect. Defect Definition: A “workload” that is not in the hands of the pathologist within one business day. Goal Statement: Project Scope: Reduce TAT from 2 days to 1 day. Process Start Point: Specimen is delivered by transportation to accessioning in the accessioning room. Process End Point: Workload is handed off to transportation (off-site) or handed to pathologist for review (on-site).
  • 80.
    Generic Process Mapand Project Scope High Level Work Flow Project Scope: From accession to distribution of tissue stains to pathologists.
  • 81.
    Process Performance -Example Before The process is in control, but has high variability. Be aware that a process can actually become more erratic if it is not in control before you start the Kaizen events Note: Example data
  • 82.
    Key Information DefectRate TAT for total process Cycle Time for each key process (CT = TAT for process step). Value Added Time for each key process (VAT). Non-Value Added Time for each key process (NVAT). Transportation/Walking Distance. Work-In-Progress (Work not yet performed). Data generated through observations and validated by time stamps generated by IT system. All shifts included. Duration of data gathering: two weeks.
  • 83.
    Current State MapValue Stream Map represents the current flow of tissue specimens and information through the process.
  • 84.
    Summary Data -Time related data Total Turnaround Time = 21 hours (1,260 Minutes) Value Added Time = 6 hours (364 minutes including oven) Percent Value Added Time = 28.9% Traveled Distance = 1,542 feet TAT = 1260 minutes (= 21 hours) Value Added Time = 364 minutes (= 6 hours) Non Value Added = 896 minutes (= 15 hours) Work In Progress = 960 minutes (= 16 hours) Percent Value Added Time = 28.9% Traveled Distance = 1542 feet Defect Rate = < 1%
  • 85.
    Summary Data -Work Balancing Graph Work Balancing Graph shows the biggest bottlenecks and depicts value added vs. non-value added times Longest non-value added times: Distribution Embedding Accessioning Build Cassette Constraint Constraint
  • 86.
    Lost in “SpaghettiWorld” (Womack) Carrier Drop Off Accession  Label Print Label Print  Gross Gross  Cover slip Oven  Distribution to pathologists Start End
  • 87.
    Embed (30 perhour) Cut (60 per hour) Embed Classical Work Set up - Linear Lean Set Up - Cell Design Summary Data - Work Flow Design 60 units 30 units Cut 30 units Cut E M B E D E M B E D Work Cell (U shaped)
  • 88.
    Summary of KeyIssues Accessioning Schedule of workers not synchronized with schedule of drop offs. Drop off starts at 5:00 p.m., but real accessioning doesn’t start before 8:00 a.m. No supervision in the accessioning area (7:00 p.m. - 3:00 a.m. shift). No procedure for hand-off to cassette building. Cassette Building Printer for labels in room different from computer that generates the labels. Long wait times for tissue specimens due to delays in accessioning. Unpredictable inputs.
  • 89.
    Summary of KeyIssues (cont.) Grossing Grossing in different room from Cassette Building. No synchronized flow from accession  cassette building  grossing. Oven technology old/no productive maintenance schedule/frequent break downs. Preference for large batch sizes rather than scheduled shorter runs of smaller batch sizes. No “First-In-First-Out!
  • 90.
    Summary of KeyIssues (cont.) Embed/Cut/Mount/Stain/Cover Slip Schedule of workers not synchronized with schedule of grossing (both 1st and 2nd shift). First batch of tissues comes out of oven at 4:00 p.m., but shift starts at 7:00 a.m.; real work does not start before 7:30 a.m. due to set up time  long wait time. No cell design for embed/cut/mount/stain. Little supervision from existing supervisors (technical rather than managerial expertise; time breaks are not synchronized with flow of inputs from grossing).
  • 91.
    Summary of KeyIssues (cont.) Distribution to Physician Distribution assistant works in a room that is different from Embed/Cut/Stain. Reporting structure of assistant not clear. No full coverage of two shifts (1 FTE for two shifts). Physician offices in different locations. Physicians release reports in batches. Other No timely reporting (one week after the fact). Employee morale is low. Communication issues about re-stains between pathologists and Histotechs when pathologists are in a different building.
  • 92.
    Identify Kaizen InterventionsProblem : How will you prioritize the kaizen interventions? Answer : Use a toolkit based on theory of constraints, lean principles and continuous quality improvement techniques. Value Stream Management Lean Principles Six Sigma Quality Theory of Constraints
  • 93.
    Identify and UseThe Right Tool Analysis and Diagnostics – Identify Improvement Opportunities Improvement – Taking Action and Achieving Results Sustaining – Build upon Improvements and make it a new way of life. If You Only Have A Hammer…. Everything Will Look Like A Nail
  • 94.
    The process iscapable of meeting your clients’ specifications (six sigma). The report is available when needed. The process has the right levels of capacity. Only Perform Value Added Steps (Remove Waste) Create Flow Where Possible (Cell Design) Create Pull (Let your customer pull production) Continuously improve your process (Manage towards Perfection) Goals That Help You Identify The Right Tools
  • 95.
    Identify Kaizen InterventionsOne Week Kaizen event addressed the areas showing the “Kaizen Burst” clouds. Many “root causes” can be identified during Value Stream Mapping exercise, but some other issues will be detected during the individual kaizen events.
  • 96.
    Summary of KeyInterventions Instituted First-In-First-Out ( FIFO - continuous flow ). More frequent runs of oven at set intervals ( one-piece flow/small batches ). Moved distribution into histology room ( remove unnecessary transportation ). Conducted 5S exercise in preparation of work cells ( continuous flow). Created window to enable hand off between accession and grossing ( remove unnecessary transportation ). Created work cell for embed/cut/mount/stain/cover slip ( one-piece flow/small batches, worker flexibility, reduce unnecessary movements ). Large tissues not processed in cell ( work balance ).
  • 97.
    Summary of KeyInterventions (cont.) Created daily reporting for each function ( visual workplace ). Created daily reporting at noon to determine what percentage of specimens has not been distributed ( standardized work ). Synchronized schedules for all functions ( one-piece flow/small batches ). Clarified roles and responsibilities for all functions ( standardized work ). Synchronized schedules of delivery to off-site facility with flow of specimens ( one-piece flow/small batches ). Created schedule whereby physician releases one report at a time ( one-piece flow) Created “hot line” for physicians to call in with requests.
  • 98.
    Summary of LeanTools Standard Work Visual Workplace Teamwork Make defects visible 5S Work Cell Worker Flexibility Work Schedule Focused Operation (Factory)
  • 99.
    Key Outcomes Reducedrisk of data entry errors in accessioning. Reduced TAT to 1 day at on-site, 2 days at off site. Improved employee morale. Created employee suggestion program to continuously improve the process.
  • 100.
    Future State MapThe process was simplified by creating a work cell design for embed/cut/stain/mount/process/prepare for delivery. Work Cell
  • 101.
    Process of ConductingKaizen Events Developing Future State Map and conducting kaizen events can Become an interactive process.
  • 102.
    Kaizen Newspaper Makesure to conduct follow up meetings (weekly) to ensure the changes become implemented!
  • 103.
    Challenges of SustainabilityHisto techs reluctant to change schedules. Histo techs reluctant to work in work cells (individual work pace vs. team work). Work cells only work when all three histo techs are present (be aware of sick time, vacation time). Measurement system requires systematic update and distribution of report at 7:00 a.m. and noon. Clarification of roles and responsibilities requires culture change. New flow impacts work schedules of pathologists.  The bottleneck moves!  Continuously manage the value stream and avoid inertia!
  • 104.
    Summary: Leanvs. Traditional Thinking Traditional Thinking: Large batches Low unit costs Work at full capacity Tight Schedules High WIP Inventories High level of Specialization Long Cycle Times Lean Thinking: Small batches N/A Work at necessary capacity Flexible Schedules Low WIP Inventories Cross-training Short Cycle Times
  • 105.